MicroRNA profiling in sera of patients with type 2
diabetes mellitus reveals an upregulation of miR-31
expression in subjects with microvascular
complications
Guido Sebastiani1,2*, Laura Nigi1,2*, Isabella Spagnuolo1,2, Elena Morganti1,2, Cecilia Fondelli1, Francesco Dotta1,2
1Diabetes Unit, Department of Medicine, Surgery and Neuroscience, University of Siena, Siena, Italy 2Fondazione Umberto Di Mario ONLUS, c/o Toscana Life Science Park, Siena, Italy
Email: [email protected]
Received 4 March 2013; revised 6 April 2013; accepted 10 May 2013
Copyright © 2013 Guido Sebastiani et al. This is an open access article distributed under the Creative Commons Attribution License, which permits unrestricted use, distribution, and reproduction in any medium, provided the original work is properly cited.
ABSTRACT
Type 2 diabetes (T2D) is a metabolic disease charac- terized by chronic hyperglycaemia due to a combina- tion of resistance to insulin action and an inadequate compensatory insulin secretory response. Chronic hyperglycemia is associated with long-term micro- and macrovascular complications leading to dysfunc- tion of several organs including kidney, heart, eye and nervous system. Early identification of chronic diabetic complications is necessary in order to pre- vent dysfunction and failure of these different organs. MicroRNAs (or miRNAs) are small endogenous RNAs, which negatively regulate gene expression. Recently, it has been demonstrated that miRNAs can be se- creted by cells, thus being detectable in serum and in other biological fluids. Circulating microRNAs have been proposed as possible biomarkers of several dis- eases. Here, we performed a miRNAs expression pro- filing in the sera of T2D patients with or without vascular complications in order to find specific bio- markers to characterize T2D complications. We ana- lyzed the expression of 384 microRNAs in serum pools from 3 groups of T2D patients: 12 T2D patients without any chronic complications, 12 T2D patients with macrovascular complications and 12 with mi- crovascular complications. We found 223 miRNAs expressed in T2D, 224 in T2D with microvascular and 221 in T2D with macrovascular complications. Among expressed microRNAs, 45 resulted upregulated and 23 downregulated in microvascular patients sera, while 13 upregulated and 41 downregulated in ma-
crovascular T2D patients compared to those without complications. We focused and validated microRNA miR-31 expression in single sera from each group, which resulted significantly upregulated in patients with microvascular complications and may be indeed related to the presence of microangiopathy. In con- clusion, our study has identified miR-31 as a promis- ing biomarker for diabetic microvascular complica- tions; further prospective studies in the clinical set- ting are however required to establish the real util- ity of measuring serum circulating levels of this mi- croRNA.
Keywords: Type 2 Diabetes; microRNAs; Diabetic Chronic Complications; Microangiopathy
1. INTRODUCTION
Type 2 Diabetes (T2D) is a chronic metabolic disease, characterized by a combination of resistance to insulin action and of an inadequate compensatory insulin secre- tory response, resulting in chronic hyperglycaemia. Most patients with this form of diabetes are obese or have an increased percentage of body fat distributed predomi- nantly in the abdominal region; both of these conditions are causes of some degree of insulin resistance [1-3]. Type 2 Diabetes may remain undiagnosed for many years because of the gradually developing hyperglycaemia and at the time of diagnosis chronic diabetic complications can already be present [4,5]. Classically, long-term com- plications of diabetes are divided into macrovascular (coronary artery disease, peripheral vascular disease and cerebrovascular disease) and microvascular complications
(diabetic nephropathy, neuropathy and retinopathy) and represent, with direct and indirect effects of chronic hy- perglycaemia on vascular vessels, the major source of morbidity and mortality in T2D [6]. Therefore, predic- tion and prevention of chronic diabetic complications represent two major objectives necessary to improve the quality of life of T2D patients. Thus, to date, specific biomarkers are needed for prediction, diagnosis and mo- nitoring of above mentioned complications. Recently, microRNAs (miRNAs) received great attention as new potential biomarkers in several diseases. MicroRNAs are small endogenous RNAs, which negatively regulate gene expression through their binding to the 3’UTR (3’Un- Translated Region) of specific mRNA targets [7]. Due to their inhibitory function, miRNAs may negatively regu- late many genes and, therefore, they are involved in sev- eral biological processes such as apoptosis, cell differen- tiation or immune function [8]. Interestingly, it has been demonstrated that miRNAs can be secreted by cells, via different pathways, and a significant number of them are indeed detectable in biological fluids, including serum [9].
Compared to other biomarkers, miRNAs are less com- plex, very stable in biological fluids and conserved among different species. Moreover, the expression of some miRNAs is restricted to specific tissues leading to a much lower complexity and simpler targeting.
Many studies evaluated the expression of miRNAs in serum/plasma from patients affected by several diseases and some of them were successful in identifying poten- tial miRNAs directly related to the disorder. Interestingly, circulating miRNAs can display unique expression pro- files related to several characteristics or to the presence or not of the disease. An example of this includes the association of miR-499 with myocardial infarction, miR- 122 with liver injury or miR-141 with prostate cancer [9-11].
In T2D, circulating miRNAs have been investigated in two studies, which focused on miRNAs expression pro- file differences in serum/plasma between T2D patients and control groups [10,11].
Interestingly, both studies found several microRNAs differentially expressed in T2D patients plasma com- pared to control subjects, pointing out the potentiality of circulating miRNAs as biomarkers also in T2D [12,13].
In the present study we analyzed serum miRNAs ex- pression profile in three groups of T2D patients: 1) T2D patients without any clinical, biochemical and/or instru- mental evidence of diabetic chronic complications; 2) T2D patients with macrovascular complications and 3) T2D patients with microvascular complications. Results uncovered a specific and significant hyperexpression of microRNA miR-31 in T2D patients with microvascular complications. Of note, this microRNA was previously
reported to be hyperexpressed in retinal endothelial cells from diabetic rats.
2. MATERIALS AND METHODS
2.1. Study Population
The study population consisted of 36 Caucasian patients with type 2 diabetes, who referred to the Diabetes Unit at University of Siena, Italy. Exclusion criteria were the presence of a concomitant autoimmune disease or of a neoplastic disease. Patients were divided into 3 groups: 1) 12 patients without any clinical, biochemical and/or in- strumental evidence of diabetic chronic complications; 2) 12 patients with diabetic macrovascular complications (cardiovascular or cerebrovascular or peripheral vascu- lar); 3) 12 subjects with diabetic microvascular compli- cations (retinopathy or neuropathy or nephropathy). For all subjects in the study, the following data were col- lected: age, gender, body mass index (BMI), duration of diabetes, presence of hypertension and/or dyslipidemia, glucose-, blood pressure- and lipid-lowering therapy (with indication of the class of drug). Table 1 shows main clinical parameters.
Diabetic retinopathy was diagnosed by ophthalmologic
Table 1. Main clinical parameters of study subjects.
T2D w/o complications (n = 12) T2D with macrovascular complications (n = 12) T2D with microvascular complications (n = 12) Gender (M/F) 6/6 8/4 6/6 Age (years) 67.6 ± 4.9 67.6 ± 5.6 67.5 ± 4.5 BMI (Kg/m2) 28.8 ± 4.7 28.9 ± 5.1 32.1 ± 8.2 Duration of T2D (years) 17.6 ± 4.4 15.7 ± 6.4 15.1 ± 4.3 HbA1c (%) 6.8 ± 0,8 7.3 ± 0.8 7.5 ± 0.9 Triglyceride (mg/dl) 137.0 ± 100 127.2 ± 66.9 137.5 ± 72.0 Total cholesterol (mg/dl) 157.9 ± 27.3 148.0 ±23.0 174.8 ± 31.2*** LDL cholesterol (mg/dl) 79.9 ± 18.2 81.3 ± 20.2 97.0 ±27.9 HDL cholesterol (mg/dl) 52.7 ± 8.4 41.4 ± 12.5* 49.9 ± 13.8 Albuminuria (A/C) 0.4 ± 0.3 0.58 ± 0.53 4.3 ± 8.2** eGFR-MDRD (ml/min/1.73 m2) 85.3 ± 17.8 80.4 ± 17.2 72.0 ± 21.0 eGFR-CDK-EPI (ml/min/1.73 m2) 84.8 ± 12.7 80.0 ±12.6 73.7 ± 20.7
*T2D with macrovascular complications vs T2D without complications (p =
0.019); **T2D with microvascular complications vs T2D without complica-
tions (p = 0.017); ***T2D with microvascular complications vs T2D with
examination with fundus oculi. Diabetic neuropathy was evaluated on the basis of characteristic symptoms, al- tered vibratory sensibility (evaluated by biothesiometer), altered protective sensibility (evaluated by monofilament of Semmes-Weinstein), alteration of tendon reflexes (patellar and achilles), electroneugraphic alterations. Dia- betic nephropathy was diagnosed by the concomitant presence of albuminuria, reduction of glomerular filtra- tion rate and hypertension. Cardiovascular disease was defined as positive electrocardiogram in accordance with Minnesota codex, positive exercise testing, positive coro- nary examination, or according to documented myocar- dial infarction. Cerebrovascular disease was defined ac- cording to documented ischemic brain injury or transient ischemic attack, while diagnosis of peripheral vascular disease was based on lower extremity arterial Doppler or on documented revascularization surgery.
2.2. Serum Collection and RNA Extraction
The serum fraction of each sample from T2D subjects was collected starting from 6 - 10 ml of entire blood. Serum was prepared by leaving the blood at room tem- perature for maximum 2 hours and then centrifuged. The supernatant was collected and immediately stored at −80˚C pending for RNA extraction. For initial miRNA expression profiling, we used 3 pools of serum obtained from 12 patients for each group.
Total RNA from 200ul of either pooled or single sera, was extracted using miRNeasy kit (Qiagen, Valencia, CA) with some modifications. Briefly, 5 volumes of Trizol LS Reagent (Ambion, Austin, TX) were added to 200 ul of serum together with 25 pM of the spike-in miRNA ath-miR-159 (Ambion). Phenol-chloroform se- paration followed by on-column RNA extraction was performed as specified by manufacturer’s instructions. Total RNA was eluted in 30ul of nuclease-free water and then subjected to downstream reactions.
2.3. MiRNA Expression Profiling
Serum miRNAs expression profiling was performed us- ing Taqman Human MicroRNA Array Cards Panel A v2.1 (Applied Biosystem, Foster City, CA) which al- lowed to evaluate the expression of 384 microRNAs. MiRNAs were reverse-transcribed using Megaplex Hu- man microRNA RT primers pools v2.1 and then pre- amplified. Briefly, 5 ul of RNA was used for each reac- tion adding 1.33 ul of 10X Megaplex human microRNAs RT primers pool A v2.1, 0.33 ul of 100 mM dNTPs, 1.33 ul of 10X RT Buffer, 1.50 ul of 25 mM MgCl2, 0.17 ul of
20 U/ul RNAse Inhibitor, 2.50 ul of 50 U/ul Multiscribe Reverse Transcriptase and 0.33 ul H2O (all from Applied
Biosystem). The reaction was then incubated for 40 cy-
cles at [16˚C × 2 min, 42˚C × 1 min, 50˚C × 1 sec] and then at 85˚C × 5 min. cDNA was then pre-amplified us- ing 4.16 ul of final RT reaction volume by adding 20.8 ul of 2X Taqman Preamp Master mix, 4.16 ul of 10X Taqman Human Preamp primers pool v2.1 and 12.5 ul of H2O (all from Applied Biosystem). The reaction was
then incubated 95˚C × 10 min, 55˚C × 2 min, 72˚C × 2 min, 12 cycles at [95˚C × 15 sec, 60˚C × 4 min] and fi- nally 99.9˚C × 10 min. Preamplification reaction was diluted 1:4 in Tris-EDTA buffer pH 8.0 and 100 ul were loaded in Taqman Human MicroRNA Array Cards fol- lowing manufacturer instructions.
For single assay miRNAs evaluation in each serum, 2.5 ul of preamplification product were used in Real Time PCR reaction for each microRNA analyzed. VIIA7 Real Time PCR instrument (Applied Biosystem) was used to perform Array cards or single assay reactions.
2.4. Data and Statistical Analysis
Data from Taqman Human MicroRNA Array Cards were exported using ViiA7 RUO software and then analyzed using Expression Suite software v1.0.1 (Applied Biosys- tem). Data normalization was performed using 4 differ- ent housekeeping microRNAs: ath-miR-159 (spike-in), RNAU6, hsa-miR-16 and hsa-miR-451. Only miRNAs with Ct < 35 and with a high efficiency amplification plot were taken into consideration for subsequent analy- sis. Data were further analyzed using 2−ddCt method and
differentially expressed miRNAs were identified using a fold change cutoff <0.35 (downregulation) and >2.5 (upregulation). Graphical analysis for Hierarchycal clus- tering was performed using Spotfire software v5.0 (Tibco). Data from single assay miRNAs in single serum were normalized using ath-miR-159 and hsa-miR-16 and analyzed using 2−dCt method. Non-parametrical Mann-
Whitney U test was performed to evaluate significance (p-value < 0.05) of differentially expressed miRNAs or of clinical parameters.
3. RESULTS
3.1. MiRNAs Expression Profile in Sera from T2D Patients
We analyzed the expression of 384 microRNAs (381 single miRNAs + 3 miRNAs repeated for stability con- trol) using Human Taqman array Card A v2.1, in total- RNA extracted from 12 pooled sera derived from T2D patients without complications, 12 from T2D with ma- crovascular complications and 12 from T2D with mi- crovascular complications.
Among the 381 miRNAs analyzed, we considered as expressed those with a Ct value < 35 and with a valid
amplification plot. On this basis, we detected 223 miRNAs expressed in T2D patients without complica- tions, 221 in T2D with macrovascular complications and 224 in T2D with microvascular complications.
We used four different housekeeping small RNAs/ miRNAs (ath-miR-159, miR-16, miR-451, U6) to nor- malize overall miRNA expression; all four resulted stably expressed in all samples analyzed.
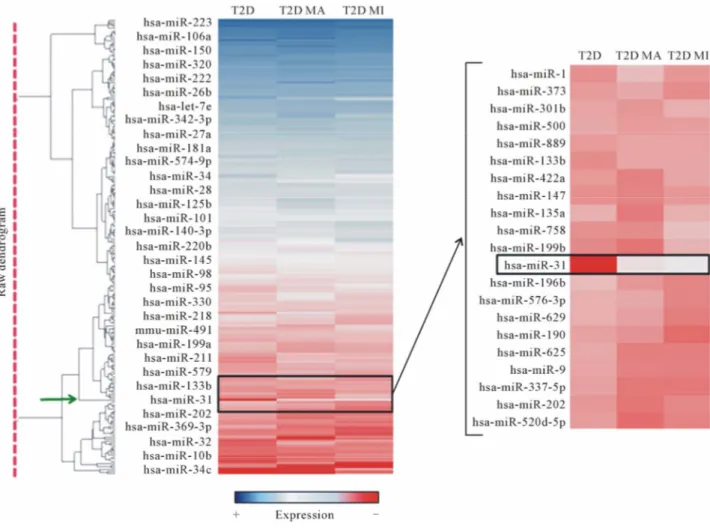
MicroRNA miR-223 resulted as the most expressed miRNA in serum from all three groups of patients ana- lyzed (Figure 1), followed by miR-19b and by miR-451. As demonstrated by hierarchical clustering/heat map analysis (Figure 1), a differential miRNA expression was detected among the three groups of samples. More specifically, in comparison with T2D patients without complications, we detected 54 differentially expressed miRNAs (13 upregulated and 41 downregulated) in T2D patients with macrovascular and 68 (45 upregulated and
23 downregulated) in T2D subjects with microvascular complications.
3.2. Increased Expression Levels of miR-31 in Sera from T2D Patients with Microvascular Complications
Among differentially expressed miRNAs, we identified miR-31 as the most upregulated miRNA in serum of T2D patients with chronic complications compared to T2D without. As shown by hierarchical clustering analy- sis (Figure 1 right panel), we found little or no expres- sion of miR-31 in serum of T2D patients without com- plications, in contrast to high levels detectable in ma- crovascular and in microvascular T2D patient sera
Moreover, we found that miR-31 resulted overex- pressed in serum of T2D patients with microvascular vs T2D with macrovascular complications (Figure 1 right panel).
Figure 1. Hierarchical clustering analysis of miRNA expression profiling. MicroRNAs expressed in the 3 groups analyzed (T2D = Type 2 Diabetes without complications; T2D MA = Type 2 Diabetes with macrovascular complications; T2D MI = Type 2 Diabetes with microvascular complications) are reported in the hierarchical clustering heatmap analysis in which each row represents a miRNA. The scale color from blue (high expression) to red (low expression) reports the expression levels of each microRNA. On the right side, high magnification of the heatmap shows a graph zone reporting miR-31 differential expression, whose clustering node is indicated by the green arrow (left side dendogram).
Interestingly, we observed that miR-31 was the unique miRNA, among those analyzed, which clustered alone with a high hierarchy node (Figure 1 green arrow).
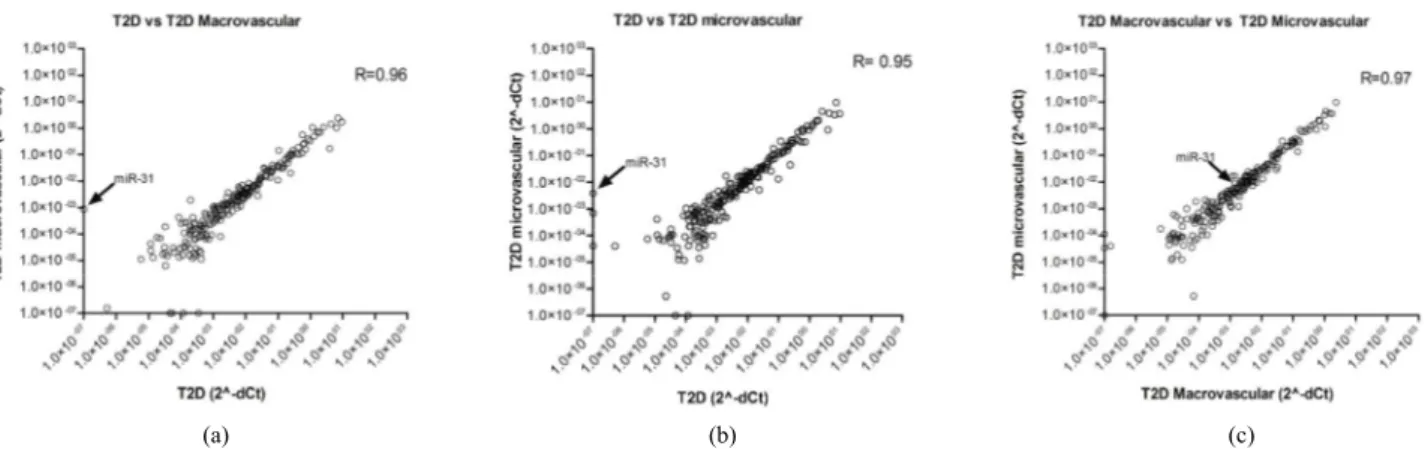
Using correlation analysis, we plotted miRNA expres- sion values to determine the level of correlation between the 3 groups of patients analyzed. As shown in Figures 2(a)-(c), we detected a significant correlation (R > 0.90, Spearman R correlation test) for the three comparisons; a better correlation was shown between T2D with mi- crovascular complications vs T2D with macrovascular complications (Figure 2(c)). MicroRNA miR-31 (Figure 2 indicated by the arrow) was located far from the ideal correlation fitting line both in T2D without complica- tions vs T2D with macrovascular (Figure 2(a)) or with microvascular complications (Figure 2(b)).
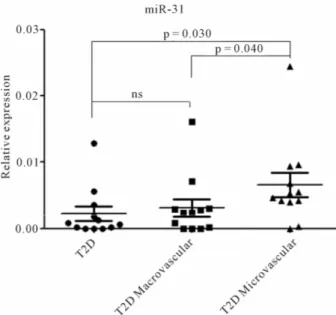
In the light of the interesting miR-31 expression pat- tern, we decided to further analyze its expression by Real Time PCR single assay, in sera from all patients. Indeed, we confirmed that miR-31 was upregulated in serum of T2D patients with microvascular complications vs T2D without complications (p = 0.03) and vs T2D individuals with macroangiopathy (p = 0.04). No significant miR-31 upregulation was observed in T2D patients with ma- crovascular complications vs uncomplicated T2D (Fig- ure 3).
4. DISCUSSION
Vascular complications represent the major cause of morbidity and mortality in T2D. Of note, major chronic complications may already be present at the time of dis- ease diagnosis, due to the gradual development of hyper- glycaemia in the disease natural history. Adequate early detection of diabetic complications may help to prevent many of detrimental effects caused by vasculopathy. Currently, there are no good soluble biomarkers to spe-
cifically detect vascular damage in diabetes. Therefore, search for new biomarkers is necessary in order to im- prove prediction, diagnosis and monitoring of diabetic complications. MicroRNAs may represent ideal candi- dates as new biomarkers for several diseases. Indeed, recent findings indicate that miRNAs can be secreted by cells and, therefore, can be found in biological fluids. Serum circulating miRNAs are becoming widely used to predict or follow-up several disorders (e.g. cancer). In- deed, they are relatively stable in biological fluids, and easily measurable, thanks to newly available expression profiling platforms. Moreover, some miRNAs have been shown to be highly tissue- and/or disease-specific, thus representing potentially valuable sensors of diseased cells/tissues.
Here, we aimed to detect differentially expressed miRNAs in serum of T2D patients without and with vascular chronic complications, in order to identify po- tentially usable biomarkers associated with diabetic mi- cro- or macro-angiopathy. We initially performed an ex- tensive miRNAs expression profiling using pooled sera from each group.
We detected a similar number of miRNAs expressed among the three groups of samples. As quality and con- cordance control we detected miR-223 as the most ex- pressed miRNA in serum of all three groups of patients analyzed, without any differential expression among such groups. These results are in agreement with those reported by Wang et al., who analyzed miRNA expres- sion profile in serum and plasma of normal control sub- jects using two different profiling platforms [14].
Among differentially expressed miRNAs, we further studied miR-31, since this miRNA was the most differ- entially expressed between T2D subjects without and with diabetic vascular complications. To this end, miR- 31 expression was analyzed in each serum by real-time
(a) (b) (c)
Figure 2. MicroRNA profiling correlation plot between groups of patients. (a) miRNA expression correlation plot between T2D without complications (x-axis) and T2D with macrovascular complications (y-axis); (b) miRNA expression correlation plot between T2D without complication (x-axis) and T2D with microvascular complication (y-axis); (c) miRNA expression correlation plot be- tween T2D with microvascular (x-axis) and macrovascular complication (y-axis). In all three panels, miR-31 is indicated by the ar- row. Spearman R test values are shown.
Figure 3. Increased expression levels of miR-31 in sera from T2D patients with microvascular complications. MicroRNA miR-31 expression was assessed in single sera using Taqman single assay real time PCR. The three sample groups (T2D = Type 2 Diabetes without complications; T2D MA = Type 2 Diabetes with macrovascular complications; T2D MI = Type 2 Diabetes with microvascular complications) are reported. Mi- croRNA miR-31 expression level is reported as 2−dCT. Mean ±
SEM are reported for each group. Mann Whitney U test has been used to evaluate statistical significance.
PCR using Taqman miRNA single assay. Indeed, miR- 31 was significantly hyperexpressed in serum of patients with microvascular complications vs uncomplicated T2D subjects and vs T2D individuals with macrovascular complications. Comparison of miR-31 expression be- tween T2D with macrovascular and T2D without com- plications did not reveal any significant difference, thus suggesting that miR-31 upregulation may be specifically related to microvascular complications. This is the first report to uncover miR-31 serum levels as a potential biomarker of diabetic microangiopathy in man. It is pos- sible to speculate that increased miR-31 levels in serum from T2D subjects with microangiopathy may reflect phenomena occurring at endothelial cell level. This is supported by the observation of increased miR-31 ex- pression in retinal endothelial cells (RECs) and in total retina of streptozotocin-induced diabetic rats, 3 months after diabetes onset [15].
Vascular endothelial cells may play a critical role in the establishment of microvascular complications in T2D [16,17]. Inflammatory cytokines in T2D strongly con- tribute to microvascular damage. Specifically, systemic TNF-alpha resulted increased in T2D patients and di- rectly correlated with microvascular complications [18, 19]. Recently, Suarez et al. demonstrated the effects of TNF-alpha on miRNAs expression in endothelial cell
line HUVEC, uncovering increased miR-31 expression in response to TNF-alpha as a possible mechanism to control inflammation through reduction of E-Selectin (involved in leukostasis), which is specifically controlled by miR-31 itself. The same authors found that miR-31 is one of the VEGF responsive miRNAs and therefore could be involved in vascular remodeling secondary to inflammatory insults [20]. Of note, miR-31 target genes include E-selectin (involved in leukostasis-experiment- tally validated), integrin-alpha5 (involved in angiogene- sis-experimentally validated) and NOS1 (oxidative stress- predicted using Targetscan 6.2) [20].
Overall, upregulation of miR-31 may have inhibitory functions on leukostasis, vascular permeability and an- giogenesis, thus reflecting a response of endothelial cells to diabetes-induced damage. It is possible to hypothesize that miR-31 increased expression levels in serum of T2D patients with microvascular complications may therefore derive from endothelial cells, by shedding vesicles or apoptotic bodies containing miR-31.
In conclusion, our study has identified miR-31 as a promising biomarker for diabetic microvascular compli- cations; further prospective studies in the clinical setting are however required to establish the real utility of meas- uring circulating serum levels of this microRNA.
5. ACKNOWLEDGEMENTS
Prof. F. Dotta is supported by the European Union [Collaborative Projects NAIMIT and PEVNET in the Framework Program 7 (FP7)], by the Juvenile Diabetes Research Foundation International, by the Italian Ministry of Research and by the Tuscany Region.
REFERENCES
[1] ADA Statement (2013) Diagnosis and classification of diabetes mellitus. Diabetes Care, 36, 67-74.
doi:10.2337/dc13-S067
[2] Kahn, S.E. (2003) The relative contributions of insulin resistance and beta cell dysfunction to the pathophysiol- ogy of type 2 diabetes. Diabetologia, 46, 193-194. [3] Steppel, J.H. and Horton, E.S. (2004) Beta-cell failure in
the pathogenesis of type 2 diabetes mellitus. Current Diabetes Report, 4, 169-175.
doi:10.1007/s11892-004-0019-3
[4] Fong, D.S., Aiello, L.P., Ferris, F.L., et al. (2004) Dia- betic retinopathy. Diabetes Care, 27, 2540-2553.
doi:10.2337/diacare.27.10.2540
[5] Gross, J.L., de Azevedo, M.J., Silveiro, S.P., et al. (2005) Diabetic nephropathy: Diagnosis, prevention and treat- ment. Diabetes Care, 28, 164-176.
doi:10.2337/diacare.28.1.164
[6] Zachary, T. and Bloomgarden, M.D. (2004) Diabetes complications. Diabetes Care, 27, 1506-1514.
doi:10.2337/diacare.27.6.1506
RNAs. Trends in Genetics, 22, 165-173.
doi:10.1016/j.tig.2006.01.003
[8] Sebastiani, G., Vendrame, F. and Dotta, F. (2011) Mi- croRNAs as new tools for exploring type-1 Diabetes: Relevance for immunomodulation and transplantation therapy. Transplntation Proceedings, 43, 330-332.
doi:10.1016/j.transproceed.2010.09.104
[9] Mitchell, P.S., Patrik, K.M., Kroh, E.M., et al. (2008) Circulating microRNAs as stable blood-based markers for cancer detection. Proceedings National Academy of Science of the United States of America, 105, 10513- 10518. doi:10.1073/pnas.0804549105
[10] Adachi, T., Nakanishi, M., Otsuka, J., et al. (2010) Plasma microRNA 499 as a biomarker of acute myocar- dial infarction. Clinical Chemistry, 56, 1733-1741.
doi:10.1373/clinchem.2010.144121
[11] Wang, K., Zhang, S., Marzolf, B., et al. (2009) Circulat- ing microRNAs, potential biomarkers for drug-induced liver injury. Proceedings National Academy of Science of the United States of America, 106, 4402-4407.
doi:10.1073/pnas.0813371106
[12] Zampetaki, A., Kiechl, S., Drozdov, I., et al. (2012) Plasma microRNA profiling reveals loss of endothelial miR-126 and other microRNAs in type 2 diabetes. Cir- culation Research, 107, 810-817.
doi:10.1161/CIRCRESAHA.110.226357
[13] Kong, L., Zhu, J., Han, W., et al. (2011) Significance of serum microRNA in pre-diabetes and newly diagnosed type 2 diabetes: A clinical study. Acta Diabetologica, 48, 61-69. doi:10.1007/s00592-010-0226-0
[14] Wang, K., Yuan, Y., Cho, J.H., et al. (2012) Com paring
the microRNA spectrum between serum and plasma. PLoS ONE, 7, e14561.
[15] Kovacs, B., Lumayag, S., Cowan, C., et al. (2011) Mi- croRNAs in early diabetic retinopathy in streptozotocin- induced diabetic rats. Investigative Ophthalmology and Visual Science, 52, 4402-4409.
doi:10.1167/iovs.10-6879
[16] Avogaro, A., Albiero, M., Menegazzo, L., et al. (2011) Endothelial dysfunction in diabetes: the role of reparatory mechanisms. Diabetes Care, 34, 285-290.
doi:10.2337/dc11-s239
[17] Egan, C.G., Lavery, R., Caporali, F., et al. (2008) Genera lised reduction of putative endothelial progenitors and CXCR4 positive peripheral blood cells in type 2 diabetes. Diabetologia, 51, 1296-1305.
doi:10.1007/s00125-008-0939-6
[18] Hasegawa, G., Nakano, K., Sawada, M., et al. (1991) Possible role of tumor-necrosis-factor and interleukin-1 in the development of diabetic nephropathy. Kidney Interna- tional, 40, 1007-1012. doi:10.1038/ki.1991.308
[19] Satoh, J., Yagihashi, S. and Toyota, T., (2003) The possi- ble role of tumor necrosis factor-alpha in diabetic poly- neuropathy. Experimental Diabesity Research, 4, 65-71.
doi:10.1155/EDR.2003.65
[20] Suarez, Y., Fernandez-Hernando, C., Yu, J., et al. (2008) Dicer-dependent endothelial microRNAs are necessary for postnatal angiogenesis. Proceedings National Acad- emy of Science of the United States of America, 105, 14082-14087. doi:10.1073/pnas.0804597105