Di3A
PhD Thesis in Agricultural, Food and Environmental Science XXX Cycle
SUSTAINABLE DEVELOPMENT
OF REGIONAL BIOGAS PRODUCTION
GIS-Based Techno Economic Assessment in Southern Italy
PhD attended during 2014/2017
Dr. Eng. Francesca Valenti
Advisor: Prof. Eng. Simona M.C. Porto Co-advisor: Prof. Eng. Wei Liao Coordinator: Prof. Cherubino Leonardi
Acknowledgements
Through the following words, I want to thank many people and institutions for the support I have received in the professional, personal and economic fields, in a direct way or indirectly. First of all, I would like to express my sincere thanks to my advisor, prof. Simona MC Porto, for her continuous involvement in my research activities and for her precious advices and suggestions, always from a very constructive point of view. A special mention deserves prof. Giovanni Cascone, for his essential scientific guide as well as for the confidence he has placed in me during the last few years. Basically, he made possible my PhD period, which was very important for my professional growth and my life in general. I would also like to thank all the research team within the section “Building and land engineering” of the Department Di3A of Catania University for helping me in their domains of expertise and for the past three years spent together.
Moreover, it is a real pleasure for me to express my gratitude to prof. Wei Liao, co-advisor of my PhD thesis, and to all the researchers and staff of the Department of Biosystems and Agricultural Engineering of the Michigan State University (MSU) for the help, the suggestions, the enthusiasm, and the hospitality given to me during my 6-month period in Lansing, MI, USA. Prof. Liao and his group were fundamental to plan, execute and finalize my research work. Moreover, a special thank goes to prof. Bruce E. Dale, who gave me the opportunity to meet prof. Liao, and for his initial advices on the bioenergy sector.
During these three years of PhD I travelled a lot and visited other research groups in Italy, so now I would also say thank to prof. David Bolzonella for hosting me in his Department of Biotechnology at the University of Verona. My sincere gratitude
goes also to the professors Attilio Toscano and Giovanni Molari, together with the research team at the Department of Agricultural and Food Sciences of the University of Bologna, for the opportunity to work with them when the prof. Liao was in Bologna and for the great hospitality offered to me.
Finally, I would like to thank the president of the Italian Association of Agricultural Engineering (AIIA), prof. Giacomo Scarascia Mugnozza, and the entire Association, that gave me the honor to receive the award for the best PhD thesis in Agricultural Engineering, cycle XXX, during the 11th AIIA Conference – Biosystems Engineering Addressing the Human Challenges of the 21st Century.
At last but not least, I would like to say THANKS to all my loved ones, especially to my family, my mother, father and sister for their precious and constant encouragement and support, for the patience and trust that they have always showed to me. Above all, I would like to thank and dedicate this thesis to my grandfather Vincenzo. I know he would be proud of me, the end of this PhD was addressed with and for him… always you will be wherever I will be…
“…Le persone più felici non sono necessariamente coloro che hanno il meglio di tutto, ma coloro che traggono il meglio da ciò che hanno. La vita non è una questione di come sopravvivere alla tempesta, ma di come danzare nella pioggia..” Kahlil Gibran
Table of contents
Sommario Abstract 8 Riassunto 10 1 Introduction 12 1.1 Preface 121.2 State of the art 16
1.2.1 Biogas sector in Europe and Biogas plants in Italy 16
1.2.2 Improving the biogas sector in Sicily 18
1.3 Objectives of the thesis work 36
1.4 Work organization 37
2 Materials and methods 38
2.1 The selected study area 38
2.2 Estimation of citrus pulp and olive pomace availability
for biogas production 38
2.2.1 The GIS-based model 38
2.2.2 Suitable zones where locating biogas plants 43
2.2.3 Base maps and database 43
2.3 Selection and quantification of the other feedstocks for
biogas production 47
2.3.1 Whey 47
2.3.2 Cattle and poultry manure 47
2.3.3 Silage 48
2.4 Characterization of feedstocks 49
2.4.1 Total solid (TS) and Volatile solid (VS) analyses 50
2.4.2 Chemical Oxygen Demand (COD) analysis 51
2.4.3 Total nitrogen (TN) analysis 51
2.4.4 Total phosphorous (TP analysis) 52
2.4.5 Fibre composition analysis (Cellulose, Xylan and
Lignin content) 55
2.5 BMP test and semi-continuous anaerobic digestion to
maximize biogas production 59
2.5.1 Design of the experiment for BMP analysis 60
2.5.2 BMP analysis 60
2.5.3 Anaerobic digestion 63
2.5.4 BMP test and semi-continuous anaerobic digestion
analytical and statistical method 66
2.5.5 BMP test and semi-continuous anaerobic digestion
mass and energy balance 66
2.6 Localisation of biogas plants in the study area 68
2.6.1 GIS-based analysis for biogas plants site selection 69
2.6.2 Technical and economic assessment 72
3 Results 80
3.1 Citrus pulp potential availability 80
3.2 Olive pomace availability 85
3.3 Suitable areas for the development of new biogas plants
89
3.4 Quantification of other feedstocks for biogas production
98
3.5 Characterization of feedstocks 102
3.6 Maximizing biogas production by BMP and
semi-continuous anaerobic digestion 103
3.6.1 Biochemical Methane Potential of mixed feedstocks
103
3.6.2 Selected FMs for semi-continuous anaerobic digestion
107
3.6.3 Mass and energy balance 112
3.7 Development of biogas plants in Sicily 114
3.7.1 Selected sites for biogas plants 114
3.7.2 Technical and economic feasibility 126
4 Discussion 141
4.1 Feedstock’s availability 141
4.2 Multiple feedstocks co-digestion performance 142
4.3 Feasibility of a regional power generation system 143
5 Conclusions 146
References 149
6 Supplemental materials 167
6.1 Statistical analysis 167
8
Abstract
Renewable energies have attracted increasing attention in the past decades due to the need to reduce consumption of energy from fossil fuels and GHG emissions. In this respect, energy production from agri-food biomass has been researched and developed regarding both processes and biomass feedstocks (food crops, non-food crops, and by-products and residues). Recently, an innovative system based on both intensification of crop rotation and use of by-products was derived from BIOGASDONERIGHT concept, which aims to sustainably make more biogas. Therefore, the main objective of this thesis was to apply advanced GIS modeling and biomethane potential test to investigate availability of byproducts and wastes, and conclude suitable biogas production system in the region of Sicily.
A hypothetical regional biogas power generation system based on multiple biomass feedstocks for the Catania province in Sicily was developed using GIS modeling tools, and evaluated by techno-economic assessment and economic sensitivity analysis. The analysis of availability and distribution of the multiple biomass feedstocks identified the best locations of four biogas plants in terms of optimization of biomass logistics. The size and location of four biogas plants in the system were determined by buffer zone and road network analyses. Moreover, the effects of mixing six feedstocks (citrus pulp, olive pomace, cattle manure, poultry
9
litter, whey, and corn silage) on anaerobic digestion of biogas production have been investigated by this study using a combined biomethane potential (BMP) and semi-continuous anaerobic digestion –(AD) testing approach, in order to maximise the biogas production. The system demonstrates excellent economic performance with a payback period of less than three years for all four biogas plants. The economic sensitivity analysis clearly presents that, after establishment of the regional biogas plants according to feedstock availability and transportation, some customized adjustments on operations at local level could be carried out to further improve the economic performance of individual biogas plants. The system offers a sustainable solution for renewable electricity generation and soil amendment production from agricultural residues and food wastes in the region of Sicily.
10
Riassunto
Negli ultimi 20 anni il settore della produzione di biogas mediante digestione anaerobica ha avuto un forte incremento. Nella maggior parte delle regioni italiane, specialmente nell'Italia settentrionale, il biogas è prodotto da colture energetiche dedicate che implicano la nascita di problemi economici, sociali e soprattutto ambientali, legati alla competizione dei prodotti food-no food. Di recente è stato sviluppato un nuovo concetto per la produzione di biogas, noto nell’ambito della letteratura di settore con il nome di BIOGASDONERIGHT. Tale sistema si basa sullo sviluppo del doppio raccolto, riduzione dei concimi chimici necessari alla coltivazione ed utilizzo di sottoprodotti agro-industriali come biomasse alternative. Per incoraggiare la crescita di impianti a biogas secondo tale concetto, la quantificazione e la relativa localizzazione delle biomasse presenti in un determinato territorio risulta essere cruciale. L’obiettivo generale della presente tesi è stato quello di contribuire allo sviluppo sostenibile degli impianti di biogas in aree in cui il settore è ancora in via di sviluppo.
La Sicilia è tra le regioni del sud-Italia in cui il settore del biogas tarda a svilupparsi. Considerando la rilevante attività
agricola e il settore agro-alimentare/industriale
annualmente vengono prodotti circa 3,9 milioni di tonnellate di residui di biomasse. A tale scopo è stato sviluppato, per la provincia di Catania, un sistema di produzione di biogas basato su più fonti di biomasse, utilizzando strumenti di modellazione GIS. L'analisi della disponibilità e della distribuzione delle biomasse considerate ha contribuito a individuare la posizione migliore, per quattro nuovi impianti a biogas, in termini di ottimizzazione della fase logistica
11
durante l’approvvigionamento delle biomasse. La dimensione e l'ubicazione dei quattro impianti di biogas sono state determinate tenendo in considerazione i dati sulle biomasse individuate ed applicando un’analisi della rete stradale per la creazione di bacini di approvvigionamento. Inoltre, sono stati studiati gli effetti dei mix delle sei biomasse selezionate (pastazzo, sansa, deiezioni avicole, deiezioni bovine, siero di latte e insilato di mais) sulla produzione di biogas utilizzando un’analisi combinata di potenziale di biometano (BMP) e digestione anaerobica (AD) semi-continua, al fine di massimizzare la produzione di biogas. Il sistema dimostra eccellenti prestazioni economiche con un periodo di ritorno inferiore a tre anni per tutti e quattro gli impianti di biogas. L'analisi della sensitività economica dimostra chiaramente che, dopo la creazione degli impianti di biogas, in base alla disponibilità e al trasporto di materie
prime, potrebbero essere effettuati adeguamenti
personalizzati per migliorare ulteriormente la performance economica di singoli impianti di biogas. Questo studio offre una soluzione sostenibile sia per la produzione di energia da fonti rinnovabili che per la produzione di fertilizzanti naturali ottenuti dalla valorizzazione di residui agricoli e sottoprodotti agro-industriali della Sicilia.
12
1 Introduction
1.1 Preface
Rapid growth of the population, along with accelerating
industrialization and expanding urbanization, has
dramatically changed our world. Signs of climate change rise concerns for the future of the planet (Ragauskas et al., 2006). Emissions of carbon dioxide have increased by more than 80% since the early 70’s, mainly due to the increase in consumption of fossil fuels (IPCC, 2007) and changes in land use (Allen et al., 2013; Kucharik et al., 2001). The 2015 United Nations Climate Change Conference (officially known as Conference of the Parties COP 21) concluded the Paris Agreement (United Nations, 2015), a global agreement on the reduction of climate change, in which global warming is set at the increase of less than 2 degrees Celsius (°C)
compared to pre-industrial levels and the CO2 emissions
reduction of 50% by year 2050. 85% of current energy consumption is based on fossil fuels, which is the most responsible source for greenhouse gas (GHG) emissions. According to the estimate of world energy requirement, demand would increase approximately 36% between 2008 and 2035 (Ruiz-Arias et al., 2012). To sustain- ably satisfy this demand, renewable energy technologies must be implemented to balance and reduce fossil energy use.
The renewable energy sources represent a suitable alternative to conventional fossil fuels, due to both the advantages in terms of environmental impact reduction according to the Kyoto protocol (Lanfranchi et al., 2014; Schneider et al., 2007). The issues related to reduction of environmental impact have been widely analysed and discussed by Rösch
13
and Kaltschmitt (1999) who recognised “the environmental advantages which are associated with the energy use of biomass instead of fossil fuels”. In fact, it is well known that the consumption of fossil fuels causes major environmental challenges such as global climate change, acid rain, and atmo-spheric ozone layer depletion. Renewable energy
generation could significantly facilitate the reduction of CO2
and other GHG emissions (Rösch and Kaltschmitt, 1999). Many renewable energy alternatives (i.e., solar, wind, hydro, geothermal, and biomass) have been intensively studied and developed in past decades. Considering cost effectiveness, practicability, scalability, positive externalities and energy density, bioenergy often offers a versatile and realistic solution, particularly for rural communities where massive quantities of agricultural biomass and residues are produced (Perlack et al., 2011). It has been estimated that, with implementation of advanced bioenergy technologies, land-based biomass (excluding biomass for food production) has an annual energy potential of between 200 and 500 Exajoule, which can make a major contribution to satisfying the world primary energy demand (500 Exajoule in 2008 and predicted 600 - 1000 Exajoule by 2050) (Council WE, 2013),
Biomass resources, which are widely available and allow the production of bioenergy at reasonable prices, have been acquiring particular interest in recent years because of the progressive exhaustion of conventional fossil fuels. The biomass utilization can trigger environmental and socio-economic improvement such as crop diversification, greenhouse emission reduction and creation of new jobs (Rösch and Kaltschmitt, 1999; Testa et al., 2014).
14
in using anaerobic digestion (AD) technology to treat agricultural wastes and biomass for biogas production (Edwards et al., 2015; Smith et al., 2015). Anaerobic digestion is a biological process in which a consortium of anaerobic microbes (bacteria and archaea) synergistically work together to generate biogas (approximately 60% methane and 40% carbon dioxide with smaller amounts of other gases), contain nutrients (primarily phosphorus and nitrogen), and control odor. Many studies have been conducted to improve digestion efficiency and enhance its economic performance. These include the design of new reactor configurations to better digest different feedstocks (Ward et al., 2008), running co-digestion (by using multiple feedstocks to balance nutrient conditions) to improve biogas production (Mata-Alvarez et al., 2014), and upgrading raw biogas to high-quality fuels such as vehicle fuel and pipeline-quality biomethane as a replacement for fossil natural gas (Sun et al., 2015).
Besides development of digestion technologies, feedstock supply and logistics have also been studied to provide decision support information and facilitate establish biogas production systems at local, regional, and national levels (Balaman and Selim, 2014; Galvez et al., 2015). With advancements in geographical information system (GIS) tools, GIS has been intensively used to carry out in-depth analyses of feedstock supply and logistics for biogas production around the world. In this context, the assessment of biomass resources for feeding and locating biogas plants could be carried out by acquiring and managing a wide variety of geographical data within Geographical Information Systems (GIS). The GIS tool has been considered as an
15
appropriate platform for spatially-related issues and have been applied for assessing the potential biomasses for biogas production (Batzias et al., 2005; Höhn et al., 2014; Noon and Daly, 1996) and for site-location analysis (Fiorese et al., 2005; Kurka et al., 2012; Sliz-Szkliniarz and Vogt, 2012; Sultana and Kumar, 2012; Zhang et al., 2011; Zubaryeva et al., 2012). Franco et al. applied a fuzzy weighted overlap dominance procedure to integrate GIS data and multiple social, technical, and environmental criteria to identify the most suitable biogas production locations (Franco et al., 2015). Brahma et al. used a GIS-based planning approach to identify an optimized agricultural residues supply network for a specified biogas plant location in India (Brahma et al., 2016). Zubaryeva et al. applied GIS to assess local biomass availability for distributed biogas production in Lecce, Italy (Zubaryeva et al., 2012). Sliz-Szkliniarz and Vogt took a GIS-based approach to determine suitable locations for biogas production from livestock manure and crops at regional scale (Sliz-Szkliniarz and Vogt, 2012). Batzias et al. developed a GIS-based model to estimate biogas production potential from livestock manure (Batzias et al., 2005). Höhn et al. (2014) used GIS data to analyse the spatial distribution and amount of potential biomass feedstock for biomethane production and optimal locations, and also the size and number of biogas plants in southern Finland (Höhn et al., 2014).
Since there is evidence of a scarce or even a lack of presence and development of biogas plants in Southern Italy, it appears valuable to evaluate the biomass availability in those territories, and lead to a correct planning action of new biogas plants.
16
Thus, in the following Sections an extensive analysis of literature is carried out (Section 1.2) to investigate the state of the art, which constitutes the knowledge base of this thesis work, and subsequently the objectives of the thesis work (Section 1.3) are described with reference to the highlighted issues in the field.
1.2 State of the art
1.2.1 Biogas sector in Europe and Biogas plants in Italy The sector of biogas production has been developed for more than 20 years with great success in Europe and mainly in Germany where about 8,000 plants were installed at the end of 2012. It is four times the number of plants present in the U.S. territory (Lopolito et al., 2011). By analysing the current and potential biogas production in U.S. territory, recent studies showed that there is a possibility of reaching 11,000 plants in relation to the actual sources of available biomasses and the methane potential production for three different biomass categories, such as landfills, wastewater, and livestock manure. Anaerobic digestion of livestock manure has been adopted by the State of California as an eligible project type for the generation of offsets under its statewide cap-and-trade program (Caputo et al., 2005).
While the spread of biogas plants has earlier and continuously increased in Europe, it is more recent in Italy: the sector started growing since the beginning of the new century, registered a very high development after 2009, when the TO (omni-comprehensive tariff) including a high energy price and a financial incentive came into force. The number of biogas plan quickly increased to 989 in three years with an overall installed power of approximately 770 megawatts at
17
the end of 2012. In the TO period (2008-2012), biogas plants have mostly spread in the livestock farms of Northern Italy, with the objective of obtaining methane from animal wastes for energy purposes. Afterwards, co-digestion with other by-products, waste products or specifically cultivated crops, has been developed due to their good contribution to biogas production. Several biogas plants are currently designed by taking into account that a relevant part of the daily organic load comes from dedicated energy crops and/or by-products of agri-food industry. Their use actually makes it possible to achieve higher electricity production than the digestion only using livestock wastes.
BIOGASDONERIGHT
In most Italian regions, especially in North-Central Italy, the biogas is produced using dedicated energy crops (e.g., beetroot, sugar cane, sorghum, and corn and wheat), which arises environmental, social and economic concerns related to food vs. fuel competition (Boscaro et al., 2015). As a consequence, there is the necessity to analyse the possibility of using alternative biomass sources (non-food sources) for the production of methane by anaerobic digestion (Thompson and Meyer, 2013). Therefore, a new concept to produce biogas, integrating sustainable intensification of crop rotation and the use of agro-industrial wastes, was developed (Dale et al., 2016). The basis of the double-cropping system is that row crops such as corn only occupy the land for a few months of the year, often less than half of the photosynthetically active period for plants. During the rest of the year, the land is essentially inactive. The sun is shining, but no photosynthesis is occurring because nothing is planted and growing. Double crops are often cool-season grasses whose
18
most highly active photosynthetic periods are before or after the productive growth periods of food crops such as maize (corn). Typically, the double crops are planted after corn or soybeans are harvested in the fall. They grow in the fall and over winter, grow rapidly in the spring, and then are harvested before the corn/soybean crop is planted in the early summer (Dale et al., 2016; Feyereisen et al., 2013). The adoption of this new system of production would reduce the environmental, economic and social impacts related with the cultivation of dedicated energy crops and the presence of waste generated by agro-industrial activities (Dell’Antonia et al., 2013). To date, the development of biogas plants in Sicily is still very limited, despite the importance of the agricultural sector for the island. It is urgently needed to develop a strategic plan to realize such development in Sicily in near future.
1.2.2 Improving the biogas sector in Sicily
Sicily, a Region of the Southern Italy, is subdivided into 9 provinces (Figure 1) and is bounded by three seas, the Tyrrhenian Sea to the North, the Ionian Sea to the East, and the Mediterranean on the remaining coasts. It covers 25,707
km2 and, apart from being the largest island in the
Mediterranean, is the largest Italian Region. The surface of the island has a complex and irregular morphology. Almost two-thirds (61.4%) of the island is hilly and a quarter (24.5%) is mountainous. A small portion of the land is plains and all along the coast.
The mountainous area has six main elevations, the highest being Mount Etna (3323 m a.s.l.), the most active volcano in the Europe, which overlooks an important and extensive plain in Sicily with fertile soils made by volcanic deposits: the
19
Catania plain. It covers 430 km2 amounting to a fifth of the
total plains of the island. The other important plains are Gela plain and ‘Conca D’Oro’ (Golden Basin).
The weather conditions are certainly not favourable for agriculture: precipitation is meagre, i.e., on the coastal and internal plains (about 500 mm/year). And, irrigation system is only used to produce high-value crops (e.g., fruit tree cultivation and vegetable crops).
In Sicily, as well as in the rest of Southern Italy, employment in agriculture is much higher than the national average but with the lowest wages. According to official statistics, Sicily has a high proportion of agricultural employment with 220,000 agricultural and livestock farms (Istat, 2013), despite having fallen by 37% since 2000, and with an 8% increase in agricultural land to 1.4M hectares. This increase runs counter-wise to the trend observed for the other regions of Italy where the countryside is being abandoned and over the last ten years has increasingly been put to other uses.
The data also indicate Sicily as the region with the greatest extension of agricultural land. Agriculture has been one of the major economic resources of Sicily due to the quality and wide variety of products. By considering the surface area dedicated to agriculture, Sicily leads in cereal production and orange production (52% of the entire national production). The unique climate pattern (mild/wet winter and hot/dry summer) and a large agricultural land area (citrus, olive, grape, wheat, cattle and sheep) make Sicily a region with a great potential for renewable energy production.
Renewable energy (4,709 GWh/year) provided
approximately 25% of total power generation in Sicily in 2013 (Agency IT, 2014). Wind (2,976 GWh) and solar (1,492
20
GWh from photovoltaics) power were the dominant renewable energy sources. Bioenergy provided only around 70 GWh (less than 0.5% of total power generation in Sicily). By considering the extensive and intensive farming and food processing operations in Sicily, it is evident that biomass is underutilised for renewable energy production.
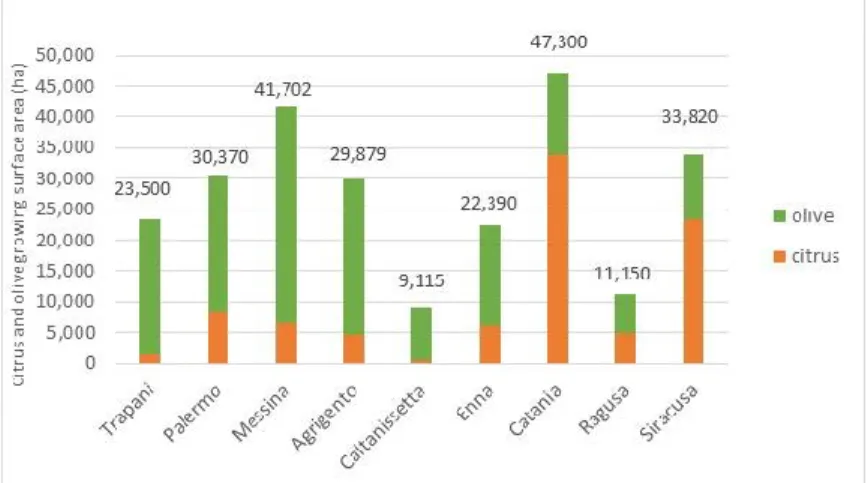
ISTAT (Italian Institute of Statistics) data indicate that Sicily is one of the regions in Italy with highest concentration of growing areas, which equals about 231 thousand hectares. Furthermore, just considering the Sicilian agricultural sector, the main plants are olive and citrus cultivation, which represent 90% of the total cultivations in Sicily.
Figure 1. Geographical position of Sicily (Italy).
1.2.2.1 Main by-products available in Sicily and the related environmental concerns
21
are produced annually by Sicilian agriculture, representing a large untapped resource. The biomass includes wastes from agro-food processing (i.e., citrus pulp, olive pomace, and whey), livestock wastes (mainly from cattle), crop residues, some energy crops, and agricultural residues (waste fruit and vegetables) (Chinnici et al., 2015). Among them, wastes from agro-food processing and livestock production account for more than 60% of the total biomass produced (Comparetti et al., 2012). Food wastes and animal manures are very good feedstocks for anaerobic digestion to produce biogas and liquid/solid fertilizers (Aguilar Alvarez et al., 2016; Azevedo, 2015; Valenti et al., 2017a, 2017b, 2016).
As regard the management of agro-industrial by-products, citrus pulp and olive pomace, is a challenge issue for the processing facilities from both economic and environmental perspectives.
In olive oil sector, several studies have proven the negative effects of these wastes on soil microbial populations (Rana et al., 2003), on aquatic ecosystems, and even in air medium (Casa et al., 2003).
An excess amount of water is consumed during olive oil extraction, with an annual wastewater generation being
estimated at around 30 million m3 (Azbar et al., 2009; Rincón
et al., 2009). Olive oil is produced with either a two- or three-phase extraction method; olive mills (OM), however, are mostly operated under a two-phase method due to their low water consumption and less generation of waste streams (Legislative Decree no. 574, 1996; Milanese et al., 2014). In addition to olive mill wastewater (OMWW), olive mill effluents contain a highly polluted solid residue as well (Legislative Decree no. 574, 1996). Olive mill solid residue
22
(OMSR) – also known as pomace – contains a considerable amount of humidity. Indeed, one ton of processed olives generates around 800 kg of OMSR under a two-phase extraction system (Milanese et al., 2014).
For these reasons, the amount of olive mill effluent that can be applied to agricultural soil is limited and regulated by national laws (Caputo et al., 2003). In this context, the valorisation of these by-products for energy production could be beneficial to solve problems related to their disposal (Ramachandran et al., 2007).
Several studies have been conducted during the last two decades with the aim to examine the thermochemical characteristics and performance of solid olive wastes. Various methods and technologies have been investigated (Ghimire et al., 2015; Kassaveti, 2008), and the potential exploitation of solid olive wastes for energy purpose was evaluated by isolating the yeast strains with the potential to utilize xylose and produce ethanol (Abu Tayeh et al., 2014) or also by adopting biogasification (olive pomace and water) (Tekin and Dalgiç, 2000).
With regard to citrus pulp, in Italy the managing and the possible re-use of this by-product have been influenced by a norm that was unable to constructively deal with the problems connected. In fact, the extensive interpretation of 'waste' and a lack of clarity in the law (Legislative Decree no.152/2006, 2006; Legislative Decree no.4/2008, 2008; Legislative Decree no. 22/1997, 1997) have limited the management of citrus pulp and generated a meddling interest of the waste disposal industry due to the high profit.
As a result, the 'waste' has emerged to include various agro-industrial by-products and among them citrus pulp. In 2010,
23
a later Legislative Decree (Legislative Decree no.205/2010, 2010) clarified the concept of by-product making it wholly distinguishable from the concept of 'waste', which refers to whatever substance or object the holder intends to or is obliged to get rid of. Only, recently, in Sicily there has been greater clarity after the document Prot. 14843 of 01/03/2012, issued by the Regional Department of Agri-food Resources on the ‘Use of the by-products of the Sicilian citrus processing industry’ which clarified that citrus pulp is defined as a by-product instead of a waste. In the past years, norms have been enacted to solve the debate on waste/by-product including alternative uses of citrus pulp other than landfilling, which produces high transport costs and environmental pollution.
Broadening citrus pulp uses, in fact, allows more adequate valorisation of this by-product. For instance, the use as livestock feed would be chosen if there are cattle and/or sheep farms nearby, otherwise the agronomical use would be preferable.
Therefore, the environmental burden due to citrus pulp and olive pomace disposal could be limited by reusing them as a renewable energy resource. In fact, the resulted biogas can be used for multiple purposes, i.e., to produce electricity, energy, heat, and biomethane.
24 T able 1. An aly sis o f gr owin g ar ea s per s pec ies in I tal y. P ro vi nc e Ap pl e Pe ar Pe ac h Ap ri co t Ci tr us f ru it Ta bl e gr ape s Ol iv e Ac ti ni dia Ch er ry To ta l Or an ge Le m on Sm al l ci tr us fru it To ta l ci tr us fru it P ie dm ont 4793. 6 1198. 3 5954. 2 852. 5 6. 8 3. 4 1. 7 11. 9 253. 0 1019. 8 5921. 9 345. 8 20351. 0 A os ta V al le y 187. 8 5. 5 3. 5 1. 6 1. 2 0. 0 0. 0 1. 2 0. 1 45. 2 0. 6 0. 7 246. 2 L om ba rd y 1764. 5 10 20. 1 589. 4 67. 0 21. 8 0. 9 5. 9 28. 6 95. 8 1963. 2 585. 4 127. 0 6241. 0 L ig ur ia 67. 2 28. 0 123. 5 71. 4 14. 0 23. 8 14. 1 51. 9 27. 4 11108. 1 8. 4 35. 7 11521. 7 T re nt ino -S out h T yr ol 29338. 0 94. 9 21. 0 75. 5 7. 5 0. 0 5. 0 12. 5 19. 0 393. 8 102. 9 315. 4 30372. 9 V ene to 5957. 1 382 4. 9 4069. 2 402. 8 17. 7 0. 1 8. 8 26. 6 161. 8 5180. 0 4072. 2 2567. 3 26261. 7 F ri ul i-V ene zi a G iul ia 1543. 5 198. 5 216. 9 14. 6 0. 4 0. 4 0. 3 1. 1 82. 3 425. 3 714. 0 39. 6 3235. 7 E m ili a-R om agna 4514. 9 22128. 2 19247. 1 5021. 8 - - - 0. 0 117. 2 3813. 9 4357. 8 2668. 9 61869. 6 Tu sc any 932. 3 513. 0 1016. 2 315. 3 44. 6 12. 6 9. 3 66. 5 116. 0 91907. 3 92. 8 313. 9 95273. 3 U m br ia 263. 1 57. 7 175. 5 92. 3 1. 2 0. 1 1. 4 2. 7 12. 3 30387. 3 1. 8 138. 9 31131. 5 M arc he s 394. 5 161. 2 912. 9 291. 6 29. 7 2. 9 9. 3 41. 9 93. 0 13514. 7 51. 8 294. 6 15756. 2 L azi o 423. 8 242. 6 1432. 9 289. 0 348. 8 54. 9 187. 6 591. 3 397. 0 67438. 0 7292. 6 845. 5 78952. 6 A br uz zo 248. 3 69. 1 1195. 1 133. 3 24. 9 0. 7 6. 7 32. 3 306. 8 42983. 0 153. 5 341. 0 45462. 4 M ol is e 164. 9 41. 7 348. 1 151. 9 16. 9 0. 5 2. 8 20. 2 23. 3 15043. 6 11. 9 76. 4 15882. 1 Ca m pa ni a 2299 .6 509. 3 12691. 6 2904. 9 630. 5 703. 7 513. 6 1847. 9 72. 0 72623. 3 741. 4 1754. 6 95444. 6 A pul ia 191. 9 197. 1 4607. 1 736. 7 3934. 3 137. 0 5250. 8 9322. 1 24427. 4 373285. 0 112. 2 12301. 7 425181. 3 Ba si li ca ta 359. 3 205. 5 3414. 0 3766. 5 4320. 0 44. 7 2074. 6 6439. 4 686. 6 280 02. 3 406. 2 197. 0 43476. 8 Ca la br ia 469. 3 272. 7 3396. 7 633. 4 16257. 7 619. 7 18307. 9 35185. 3 193. 2 185914. 7 1058. 0 444. 4 227567. 6 S ar di ni a 251. 6 293. 5 1065. 2 149. 5 2554. 9 148. 0 1401. 7 4104. 6 441. 0 36471. 7 1. 7 171. 3 42950. 1 Si ci ly 565. 8 1479. 5 5474. 7 853. 6 51318. 0 13671. 0 6144. 1 71133. 1 9779. 4 141809. 8 14. 0 648. 9 231758. 9 It al y 54731. 1 32541. 4 65954. 7 16825. 1 79551. 0 15424. 5 33945. 6 128921. 1 37304. 5 1123329. 7 25700. 9 23628. 6 1508937. 0
25
1.2.2.2 Citrus cultivation, citrus processing industries and the related by-products
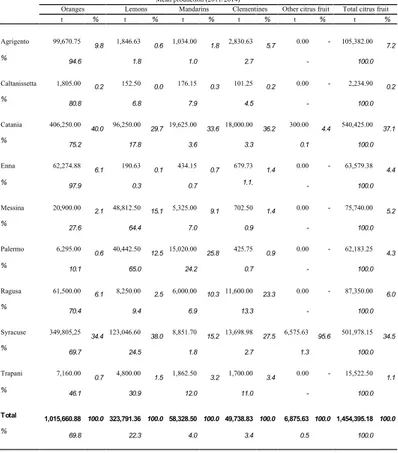
In Italy, citrus production is relevant since it covers an area of 142,011 ha with a production of 2.7 million tons, according to the most recent official statistical data. The southern regions include 99.5% of cultivated area and 99.9% of total harvested production: Sicily contributes to the national production with 56.6% of the total national production with a cultivation area of 52.3%, followed by the Calabria region with 26.4% of the cultivation area and 28.9% of the production. The remaining regions have very low percentages of the total national production (Istat, 2015). The citrus production data (Table 2) highlighted that the average production in the last four-year period (Istat, 2015) (years 2011–2014) was 1,454 million tons per year and was composed of oranges (about 70%), lemons (about 22%), and other species altogether (about 7.9%).
Sicilian citrus production is mainly located in Eastern Sicily, especially in the provinces of Catania and Syracuse, even though it is also a traditional and typical cultivation in Western Sicily and particularly in the Palermo territory (mainly lemon and mandarin).
Citrus orchards are generally located in irrigated areas within coastal areas, valley floors, or flatlands; however, some of them are on steep slopes with land terracing where mechanization and cultivation are difficult.
Figure 2 shows the dynamics of Sicilian citrus growing areas over the period 2011 to 2014. The citrus growing area fell from 87,720 ha in 2011 to 80,445 ha in 2014 (about 10%). The surface area losses are mainly for mandarin (7%) and clementine (14%) compared to orange and lemon.
26
Citrus cultivation has a strategic role for employment and revenue of the local Sicilian society. In fact, 47% of Italian citrus fruit farms are located in Sicily. In 2013, Gross Saleable Production (GSP) for the sector reached about €694 million (official statistics), 58% of national production, down Table 2. The dynamics of Sicilian citrus production per province and
species. (*)
Table 1 - The dynamics of Sicilian citrus production per province and species (*)
Mean production (2011/2014)
Oranges Lemons Mandarins Clementines Other citrus fruit Total citrus fruit
t % t % t % t % t % t % Agrigento 99,670.75 9.8 1,846.63 0.6 1,034.00 1.8 2,830.63 5.7 0.00 - 105,382.00 7.2 % 94.6 1.8 1.0 2.7 - 100.0 Caltanissetta 1,805.00 0.2 152.50 0.0 176.15 0.3 101.25 0.2 0.00 - 2,234.90 0.2 % 80.8 6.8 7.9 4.5 - 100.0 Catania 406,250.00 40.0 96,250.00 29.7 19,625.00 33.6 18,000.00 36.2 300.00 4.4 540,425.00 37.1 % 75.2 17.8 3.6 3.3 0.1 100.0 Enna 62,274.88 6.1 190.63 0.1 434.15 0.7 679.73 1.4 0.00 - 63,579.38 4.4 % 97.9 0.3 0.7 1.1. - 100.0 Messina 20,900.00 2.1 48,812.50 15.1 5,325.00 9.1 702.50 1.4 0.00 - 75,740.00 5.2 % 27.6 64.4 7.0 0.9 - 100.0 Palermo 6,295.00 0.6 40,442.50 12.5 15,020.00 25.8 425.75 0.9 0.00 - 62,183.25 4.3 % 10.1 65.0 24.2 0.7 - 100.0 Ragusa 61,500.00 6.1 8,250.00 2.5 6,000.00 10.3 11,600.00 23.3 0.00 - 87,350.00 6.0 % 70.4 9.4 6.9 13.3 - 100.0 Syracuse 349,805,25 34.4 123,046.60 38.0 8,851.70 15.2 13,698.98 27.5 6,575.63 95.6 501,978.15 34.5 % 69.7 24.5 1.8 2.7 1.3 100.0 Trapani 7,160.00 0.7 4,800.00 1.5 1,862.50 3.2 1,700.00 3.4 0.00 - 15,522.50 1.1 % 46.1 30.9 12.0 11.0 - 100.0 Total 1,015,660.88 100.0 323,791.36 100.0 58,328.50 100.0 49,738.83 100.0 6,875.63 100.0 1,454,395.18 100.0 % 69.8 22.3 4.0 3.4 0.5 100.0 (*) Source: ISTAT.
27
by 10% over ten years. This sector contributes to 15.7% of the Regional GSP (Inea, 2014a, 2014b).
Sicilian citrus cultivation focuses on the following species: oranges and lemons together representing 90.7% of the cultivation area and 92.1% of harvested production. Other species like mandarin and clementine are important only in certain areas where soil and climatic conditions can guarantee optimum crop production.
Data from the 2010 Agricultural Census highlight that approximately half (46%) of citrus farms are located in Sicily whereas the other Regions have no more than 8%, except for Calabria at 26% (Table 3).
There are 79,589 citrus farms in Italy (Table 4), which are mostly located in Sicily and Calabria (72%). Sicily has the highest number of orange, lemon, and mandarin farms, and Calabria has a significant number of farms producing clementine and minor citrus fruits (grapefruit, citron, and bergamot) in Italy (Istat, 2015).
Oranges together with lemons, are the most utilised among citrus fruits in the citrus processing industry. Table 4 lists the numbers of orange farms in different region in Italy. The citrus fruit produced is utilized for fresh consumption or for juice production. Seventy percent of the transformed product supply is represented by orange juice, while slightly more than 20% is represented by lemon juice. Orange juice is one of the most widely consumed beverages today.
Consequently, the orange cultivation has become a major industry and an important economic sector in the United States and most Mediterranean countries. A high percentage of orange production (70%) is used to manufacture derivative products and approximately 50–60% of the processed fruit is
28
transformed into citrus waste (peel, seeds and membrane residues) (Martín et al., 2010; Wilkins et al., 2007).
Figure 2. The dynamics of the citrus areas in Sicily per species. (*) The main by-product of citrus processing industries is the citrus pulp, which is commonly known as “pastazzo” in Italy. It is essentially composed of insoluble carbohydrates, sugars, acids (mainly citric acid and malic acid), lipids, mineral elements (principally nitrogen, calcium, and potassium), volatile components (e.g. alcohols, aldehydes, ketones, esters, and hydrocarbon), flavonoids, essential oils (d-limonene at 95%), enzymes, pigments, and vitamins (Bampidis and Robinson, 2006).
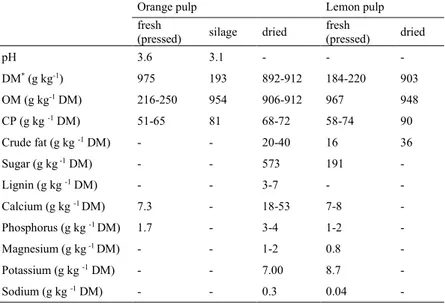
This citrus pulp is characterized by high acidity, with a pH ranging from 3.5 to 5.8 (Bampidis and Robinson, 2006). A general chemical characterization, which distinguishes between citrus pulp obtained from oranges and that from
29
lemons (i.e., the two citrus fruit having the most important production worldwide), is reported in Table 5.
This information is useful for biogas producers because they could use the data to calculate carbon:nitrogen ratios in their feed and decide the amount of citrus pulp that they can feed their digesters.
Table 3. Number of citrus farms per region and species in Italy. (*) Table 1 - Number of citrus farms per region and species in Italy (*)
Farms
Oranges Lemons Mandarins Clementines Other citrus fruit Total citrus fruit
No. % No. % No. % No. % No. % No. %
Liguria 350 0.6 470 2.4 136 0.9 41 0.3 142 2.7 678 0.9 % 51.6 69.3 20.1 6.0 20.9 100.0 Lazio 1,035 1.8 349 1.8 314 2.1 219 1.7 96 1.8 1,205 1.5 % 85.9 29.0 26.1 18.2 8.0 100.0 Campania 2,921 5.1 3 13.8 1,631 10.8 569 4.4 429 8.0 4,679 5.9 % 62.4 57.0 34.9 12.2 9.2 100.0 Apulia 4,344 7.5 1,055 5.5 1,467 9.7 2,107 16.2 433 8.1 6,038 7.6 % 71.9 17.5 24.3 34.9 7.2 100.0 Basilicata 3,036 5.3 135 0.7 712 4.7 849 6.5 138 2.6 3,508 4.4 % 86.5 3.8 20.3 24.2 3.9 100.0 Calabria 14,148 24.5 1,354 7.0 3,823 25.3 6,002 46.2 2,158 40.7 20,974 26.3 % 67.4 6.5 18.2 28.6 10.3 100.0 Sicily 27,020 46.8 12,362 63.8 5,112 34.0 1,821 14.0 1,415 26.7 36,981 46.5 % 73.1 33.4 13.8 4.9 3.8 100.0 Sardinia 4,467 7.7 781 4.0 1,782 11.8 1,341 10.3 407 7.7 4,946 6.2 % 90.3 15.8 36.0 27.1 8.2 100.0 Other regions 413 0.7 216 1.0 106 0.7 47 0.4 90 1.7 580 0.7 % 71.2 37.2 18.3 8.1 15.5 100.0 Total 57,724 100.0 19,389 100.0 15,083 100.0 12,996 100.0 5,308 100.0 79,589 100.0 % 72.5 24.4 19.0 16.3 6.7 100.0 (*) Source: ISTAT 2010
30
Citrus pulp has been utilised as the feedstock for production of animal feed simply burnt (due to its high calorific power:
4,545 kcal kg-1 dry matter), fertilizer, essential oils, pectin,
ethanol, industrial enzymes, single cell proteins, pollutant absorbents and paper pulp supplement. However, these processes generate a large quantity of polluted wastewater, giving the fact that the pressing stage requires the addition of quicklime. Other factors that limited the reuse, exploitation, and valorisation of citrus pulp were the lack of official data related to the quantities, in terms of volumes, and the spatial localisation of the actual quantities of this by-product. Therefore, feasibility studies of citrus pulp valorisation were
Table 4. Orange-producing farms in Italy. (*)
Farms
Oranges Total citrus
N. % N. % Liguria 350 0.6 678 0.9 % 51.6 100.0 Lazio 1,035 1.8 1,205 1.5 % 85.9 100.0 Campania 2,921 5.1 4,679 5.9 % 62.4 100.0 Puglia 4,344 7.5 6,038 7.6 % 71.9 100.0 Basilicata 3,036 5.3 3,508 4.4 % 86.5 100.0 Calabria 14,148 24.5 20,974 26.4 % 67.5 100.0 Sicilia 27,020 46.8 36,981 46.5 % 73.1 100.0 Sardegna 4,467 7.7 4,946 6.2 % 90.3 100.0 Other regions 4,467 7.7 4,946 6.2 % 90.3 100.0 Total 57,724 100.0 79,589 100.0 % 72.5 100.0 (*) Source: Istat.
31
scarcely conducted by scientific communities.
Table 5. Chemical composition of citrus pulp (re-elaborated from
Bampidis and Robinson, 2006).
Orange pulp Lemon pulp
fresh (pressed) silage dried fresh (pressed) dried
pH 3.6 3.1 - - - DM* (g kg-1) 975 193 892-912 184-220 903 OM (g kg-1 DM) 216-250 954 906-912 967 948 CP (g kg -1 DM) 51-65 81 68-72 58-74 90 Crude fat (g kg -1 DM) - - 20-40 16 36 Sugar (g kg -1 DM) - - 573 191 - Lignin (g kg -1 DM) - - 3-7 - - Calcium (g kg -1 DM) 7.3 - 18-53 7-8 - Phosphorus (g kg -1 DM) 1.7 - 3-4 1-2 - Magnesium (g kg -1 DM) - - 1-2 0.8 - Potassium (g kg -1 DM) - - 7.00 8.7 - Sodium (g kg -1 DM) - - 0.3 0.04 -
(*) DM: dry matter; OM: organic matter; CP: crude protein.
1.2.2.3 Olive oil cultivation, processing industries and the related by-products
In the Mediterranean region olive farming and olive oil industry are of both economic and social importance, and more than 98% of the world’s olive oil is produced from the region with an estimated value of 2.5 million metric tons/year) (FAOSTAT, 2009; IOCC, 2010). The leading olive oil producing countries are Spain, Italy, Greece and Portugal. Olive oil has excellent nutritional properties, and its consumption, traditionally restricted to the Mediterranean
32
area (77% of the worldwide input), is increasing worldwide, prompting countries such as Argentina, the United States and South Africa to emerge as producers. In the last decade, olive oil production has increased by approximately 40% worldwide.
Looking more closely at the situation in Italy, olive oil industry is not only the second largest producer (27% and 20% of European and world production, respectively), but also the biggest consumer (followed by Spain and the USA), the biggest importer (followed by the USA and France), and the second most important exporting country (after Spain) (FAOSTAT, 2009; UNCTAD, 2015). There are about 150 million olive trees growing in 18 of the 20 regions in Italy. Olive cultivation is largely concentrated in the southern regions, divided among an extremely high number of growers (about 1,200,000) and characterized by a wide and complex differentiation of cultivars, which vary considerably from one location to another. No other olive oil producing countries have such a great variety, as the less variable environmental conditions that they have compared to Italy (Salomone and Ioppolo, 2012; Unaprol, 2009).
Based on the ISTAT data, the Italian olive production is reported in Table 6. The olive farms (olive oil firms and table-olive firms) are mostly located in the southern regions of Italy, which have the highest percentage of cultivated surface. Sicily, as a whole, comes behind Apulia and Calabria for the number of olive farms and olive growing areas, but ahead for table-olive cultivation. The VI Agriculture General Census 2010 (Istat, 2013) showed that in Italy the olive farms are 907,197, 98.7% of these farms are composed of olive oil firms, whereas 1.3% are related to table-olive firms. As for
33
the olive growing area, the Census recorded 1,077,467.10 ha of cultivation land, 98.8% of the land are olive oil producing areas whereas the remaining land is for table-olive cultivation.
Table 6. Olive farm number and surface area per region and species
in Italy. (*)
Table olives Olive oil Total Table olives Olive oil Total
No. % No. % No. % Ha % Ha % Ha %
Toscana 369 3.3 50,017 5.6 50,386 5.6 377.06 2.9 78,975.53 7.4 79,352.59 7.4 % 0.7 99.3 100.0 0.5 99.5 100.0 Umbria 84 0.7 24,122 2.7 24,206 2.7 89.40 0.7 29,541 2.8 29,630 2.7 % 0.3 99.7 100.0 0.3 99.7 100.0 Marche 419 3.7 25,261 2.8 25,680 2.8 145.29 1.1 10,941.65 1.0 11,086.94 1.0 % 1.6 98.4 100.0 1.3 98.7 100.0 Lazio 1,637 14.4 67,399 7.5 69,036 7.6 1,476.35 11.3 64,335.92 6.0 65,812.27 6.1 % 2.4 97.6 100.0 2.2 97.8 100.0 Abruzzo 448 3.9 54,559 6.1 55,007 6.1 286.71 2.2 42,294.18 4.0 42,580.89 4.0 % 0.8 99.2 100.0 0.7 99.3 100.0 Campania 638 5.6 85,369 9.5 86,007 9.5 370.82 2.8 71,067.43 6.7 71,438.25 6.6 % 0.7 99.3 100.0 0.5 99.5 100.0 Apulia 2,027 17.9 226,229 25.3 228,256 25.2 2,878.85 22.0 352,567.54 33.1 355,446.39 33.0 % 0.9 99.1 100.0 0.8 99.2 100.0 Basilicata 213 1.9 32,617 3.6 32,830 3.6 218.38 1.7 27,403.30 2.6 27,621.68 2.6 % 0.6 99.4 100.0 0.8 99.2 100.0 Calabria 1,337 11.8 113,159 12.6 114,496 12.6 1,555.82 11.9 183,040.55 17.2 184,596.37 17.1 % 1.2 98.8 100.0 0.8 99.2 100.0 Sicily 2,361 20.8 138,751 15.5 141,112 15.6 4,249.40 32.5 134,838.98 12.7 139,088.38 12.9 % 1.7 98.3 100.0 3.1 96.9 100.0 Sardegna 1,206 10.6 30,763 3.4 31,969 3.5 1,063.84 8.1 33,750.33 3.2 34,814.17 3.2 % 3.8 96.2 100.0 3.1 96.9 100.0 Other regions 608 5.4 47,604 5.3 48,212 5.3 359 2.8 35,639 3.3 35,999 3.3 % 1.3 98.7 100.0 1.0 99.0 100.0 Total 11,347 100.0 895,850 100.0 907,197 100.0 13,071.40 100.0 1,064,395.70 100.0 1,077,467.10 100.0 % 1.3 98.7 100.0 1.2 98.8 100.0 (*) Source: ISTAT.
34
Apulia has over 228,000 olive farms and an olive growing area of 355,446.39 ha, moreover it has the highest investments in this sector, being ahead of Calabria and Sicilia, followed by the other Italian regions. The olive oil production in Italy reaches 452,000 t (average 2011-2014 value), 38% of the production is in Apulia (170,000 t), 28% in Calabria (126,000 t), and 10% in Sicily (45,000 t).
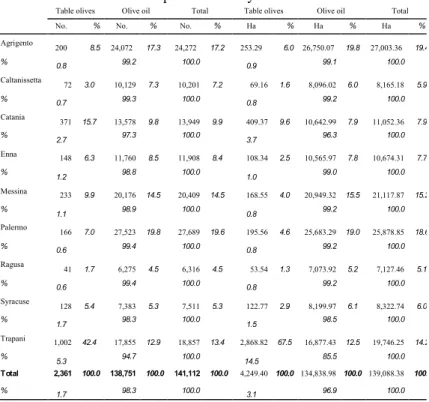
From this analysis, Sicily is the third olive oil producing region in Italy (approximately 8% of the Italian production) after Puglia and Calabria (DellaGreca et al., 2001; Paredes et al., 1986; Salomone and Ioppolo, 2012). There are over 141,000 olive farms in Sicily, which occupy 139,088.00 ha of land (Table 7). Olive oil production in Sicily was 32,216.4 t in 2014 from 199,000 growers and 692 mills (Salomone and Ioppolo, 2012; Unaprol, 2009).
The largest olive cultivation in Sicily is Messina followed by Agrigento and Trapani, while Agrigento is the province with the highest production followed by Catania and Palermo (Salomone and Ioppolo, 2012; Unaprol, 2009).The Sicilian olive oil production is concentrated in Palermo with 10,775 t (average 2011-2014 value), followed by 7,450 t in Catania, 6,604 t in Agrigento, 5,729 t in Trapani, and 3,209 t in Messina.
35
Table 7. Olive farm number and surface area per province and
species in Sicily.
Table olives Olive oil Total Table olives Olive oil Total
No. % No. % No. % Ha % Ha % Ha %
Agrigento 200 8.5 24,072 17.3 24,272 17.2 253.29 6.0 26,750.07 19.8 27,003.36 19.4 % 0.8 99.2 100.0 0.9 99.1 100.0 Caltanissetta 72 3.0 10,129 7.3 10,201 7.2 69.16 1.6 8,096.02 6.0 8,165.18 5.9 % 0.7 99.3 100.0 0.8 99.2 100.0 Catania 371 15.7 13,578 9.8 13,949 9.9 409.37 9.6 10,642.99 7.9 11,052.36 7.9 % 2.7 97.3 100.0 3.7 96.3 100.0 Enna 148 6.3 11,760 8.5 11,908 8.4 108.34 2.5 10,565.97 7.8 10,674.31 7.7 % 1.2 98.8 100.0 1.0 99.0 100.0 Messina 233 9.9 20,176 14.5 20,409 14.5 168.55 4.0 20,949.32 15.5 21,117.87 15.2 % 1.1 98.9 100.0 0.8 99.2 100.0 Palermo 166 7.0 27,523 19.8 27,689 19.6 195.56 4.6 25,683.29 19.0 25,878.85 18.6 % 0.6 99.4 100.0 0.8 99.2 100.0 Ragusa 41 1.7 6,275 4.5 6,316 4.5 53.54 1.3 7,073.92 5.2 7,127.46 5.1 % 0.6 99.4 100.0 0.8 99.2 100.0 Syracuse 128 5.4 7,383 5.3 7,511 5.3 122.77 2.9 8,199.97 6.1 8,322.74 6.0 % 1.7 98.3 100.0 1.5 98.5 100.0 Trapani 1,002 42.4 17,855 12.9 18,857 13.4 2,868.82 67.5 16,877.43 12.5 19,746.25 14.2 % 5.3 94.7 100.0 14.5 85.5 100.0 Total 2,361 100.0 138,751 100.0 141,112 100.0 4,249.40 100.0 134,838.98 100.0 139,088.38 100.0 % 1.7 98.3 100.0 3.1 96.9 100.0 (*) Source: ISTAT.