UNIVERSITY OF CATANIA
FACULTY OF MATHEMATICAL, PHYSICAL AND NATURAL SCIENCES DEPARTMENT OF CHEMICAL SCIENCES
INTERNATIONAL Ph.D. IN CHEMICAL SCIENCES -XXIV cycle
S
S
A
A
L
L
V
V
A
A
T
T
O
O
R
R
E
E
B
B
A
A
T
T
T
T
I
I
A
A
T
T
O
O
STUDIES OF NEW POLYMERIC MATERIALS
PRODUCED BY REACTIVE BLENDING
Ph.D. THESIS
ACADEMIC YEARS 2008-2011 Tutors:
Prof. ALBERTO BALLISTRERI
Prof. FILIPPO SAMPERI Coordinator:
i
TABLE OF CONTENTS
1.- INTRODUCTION 1
1.1 – Preface 1
1.2 – Reactive melt blending 4
1.3 - Aim of the work 7
1.4 - References 8
2. – CHARACTERIZATION TECHNIQUES 9
2.1 – Nuclear Magnetic Resonance (1H and 13C - NMR) 9
2.2 – Differential Scanning Calorimetry (DSC) 14
2.3 – Thermogravimetry (TGA) 17
2.4 – MALDI-TOF mass spectrometry 19
2.5 – FTIR spectroscopy 24
2.6 – Viscosimetry 26
2.7 – Gel Permeation Chromatography (GPC) 29
2.8 – Rereferences 32
PART I
CHARACTERIZATION OF COPOLYESTEREAMIDES FROM REACTIVE BLENDING OF PET AND MXD6 IN THE MOLTEN STATE
3.1 – Introduction 34
3.2 – Materials 38
3.3 – Poly(ethylene terephthalate) - PET 39
3.4 – Poly(m-xylene adipamide) - MXD6 41
3.5 – Reactive blending procedure 42
3.6 – Synthesis of poly(m-xylene terephthalamide) - MXDT 43
3.7 – Characterization of Samples 44
3.8 – Results and discussion 45
3.9 – Studies on PET and MXD6 Samples 48
3.10 – Characterization of PET-MXD6 melt-mixed blends 57
3.11 – MALDI-TOF ms characterization 72
3.12 – DSC analysis 75
3.13 – Thermogravimetric analysis (TGA) 80
ii
3.15 – References 83
PART II
REACTIVE MELT MIXING OF PC-PEN BLENDS:
STRUCTURAL CHARACTERIZATION OF REACTION
PRODUCTS
4.1 – Introduction 86
4.2 – Poly (bisphenolA carbonate) - PC 89
4.3 – Poly(ethylene naphthalate) - PEN 91
4.4 – Reactive blending procedure 93
4.5 – Synthesis of polymer models 94
4.6 – Synthesis of poly(bisphenolA naphthalate) 96
4.7 – Synthesis of copoly(bisphenolA carbonate)-alt-(ethylene carbonate) 98 4.8 – Synthesis of poly(ethoxy-bisphenolA naphthalate)-co-
(diethoxy-bisphenolA naphthalate) 100
4.9 – Synthesis o poly(diethoxy bisphenolA naphthalate) 102
4.10 – Characterization of models polymers 104
4.11 – Characterization of PC and PEN 110
4.12 – Characterization of poly(bisphenolA naphthalate) 118
4.13 – Characterization of copoly(bisphenolA carbonate)-alt-
(ethylene carbonate) 121
4.14 – Characterization of poly(ethoxy-bisphenolA naphthalate)-co-
(diethoxy-bisphenolA naphthalate) 123
4.15 – Characterization of poly(diethoxy-bisphenolA naphthalate) 127
4.16 – Characterizations of PC-PEN melt blended materials 129
4.17 - Solvent Extractions 130
4.18 – 1H and 13C NMR analysis of PC-PEN melt blended materials 132
4.19 – Thermogravimetric analysis of PC-PEN melt blended materials 143
4.20 – DSC analysis of melt mixed PC-PEN materials 146
4.21 – FTIR analysis of PC-PEN Blends 151
4.22 – Viscosimetric analysis of PC-PEN Blends 153
4.23 – GPC analysis of melt mixed PC-PEN materials 154
4.24 - MALDI-TOF measurements of PC-PEN Blends 157
4.25 – Conclusions 163
iii
List of figures
Figure 1.1.Copolymer action as compatibilizer.
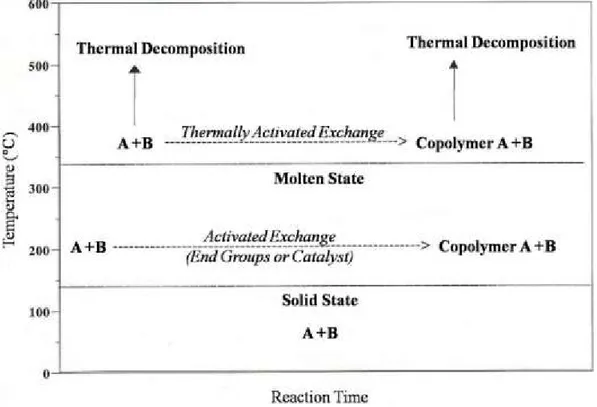
Figure 1.2. Schematic representation of the exchange reactions which can occur in polymer blends containing reactive functional groups as a function of temperature.
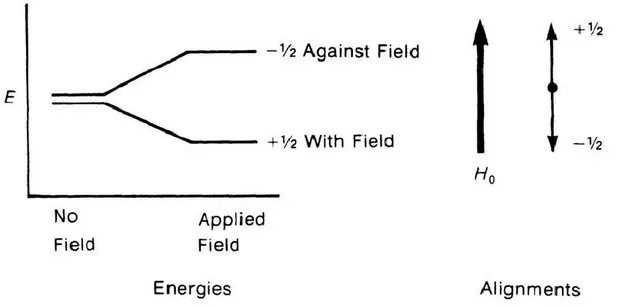
Figure 2.1. The spin states of a proton both in the absence and in the presence of applied magnetic field.
Figure 2.2. Schematic representation of a typical DSC sample cell showing the sample (S) and reference (R) pans, as well as the heating and temperature sensing elements.
Figure 2.3. Typical DSC curve, using convention that endothermic peak goes down. ∆ indicates the differential signal of temperature between reference and sample.
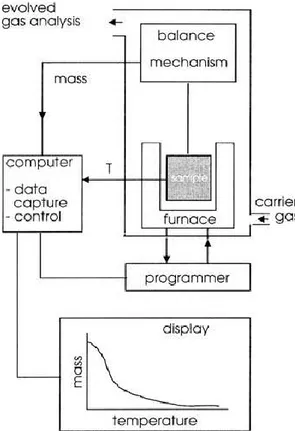
Figure 2.4. A schematic thermobalance.
Figure 2.5. Schematic of a MALDI-TOF Mass Spectrometer. Figure 2.6. MALDI-TOF MS Sample Ionization.
Figure 2.7. Conversion from TOF spectra to Conventional Spectra.
Figure 2.8. Schematic plots of sp/c and inh vs. concentrations of
polymer solution.
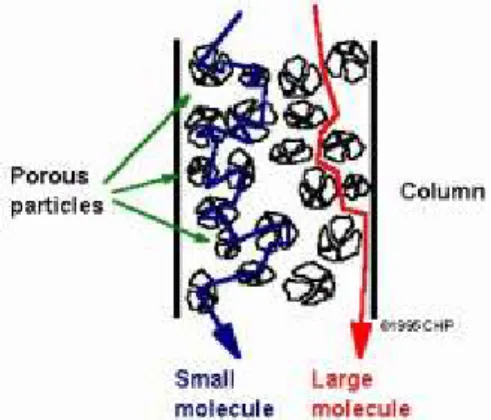
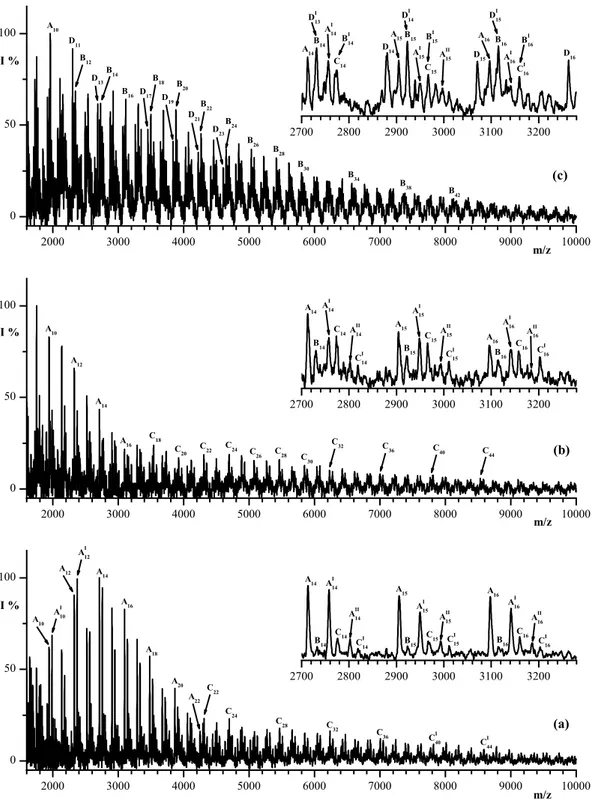
Figure 2.9. Schematic of a Gel Permeation Chromatography column. Figure 3.1. MALDI-TOF mass spectra of PET heated at 285 °C for (a) o min, (b) 5 min, and (c) 5 min in the presence of TA (1 wt%).
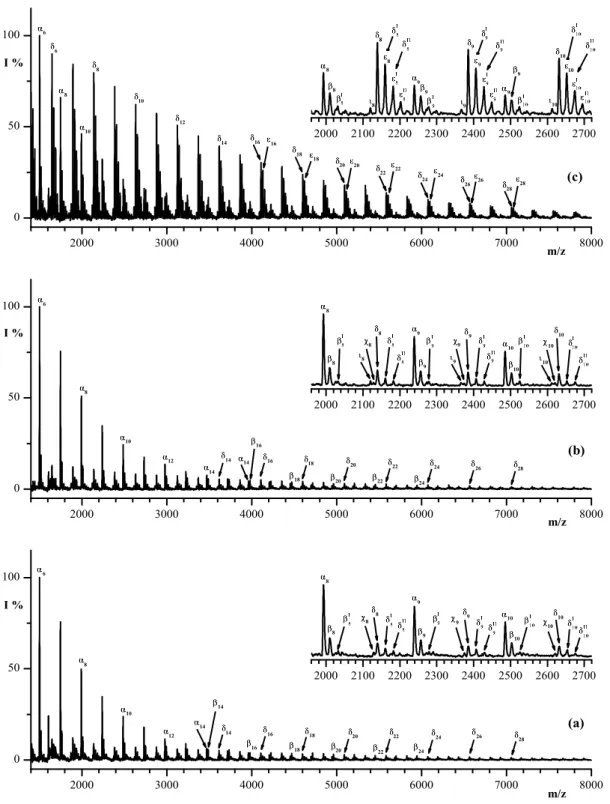
Figure 3.2. MALDI-TOF mass spectra of MXD6 heated at 285 °C for (a) o min, (b) 5 min, and (c) 5 min in the presence of TA (1 wt%).
Figure 3.3. Sections of the 1H-NMR spectra of (a) an equimolar mixture
(with respect of the repeat units) of the polymer models (PET, MXD6, MXDT, and PEA) and of PET-MEXD6-(1 wt%)TA melt-mixed blends at 285 °C for: (b) 30 min, (c) 45 min, (d) 75 min, and (e) 120 min.
iv
Figure 3.4. Sections of the 13C-NMR spectra of (a) an equimolar mixture
(with respect of the repeat units) of the polymer models (PET, MXD6, MXDT, and PEA) and of PET-MEXD6-(1 wt%)TA melt-mixed blends at 285 °C for: (b) 20 min, (c) 30 min, (d) 60 min, (e) 75 min, (f) 90 min, and (e) 120 min.
Figure 3.5. (a) Theoretical and (b) experimental MALDI-TOF mass spectra of PET-MXD6 (120 min) random copolymer, in the mass range 1100–2200 Da.
Figure 4.1. 1H NMR spectra of polymer models: (a) PC, (b) PEN, (c) pBAN, (d) p(BPAC)-alt-(EtC), (e) p(BPAEtN)-co-(EtBPAEtN), and (f) pEtBPAEtN.
Figura 4.2. 13C-NMR spectra of polymer models: (a) PC, (b) PEN, (c) pBAN, (d) p(BPAC)-alt-(EtC), (e) p(BPAEtN)-co-(EtBPAEtN), and (f) pEtBPAEtN.
Figure 4.3. FTIR Spectra of polymer models (a) PC, (b) PEN, (c) pBAN, (d) p(BPAC)-alt-(EtC), (e) p(BPAEtN)-co-(EtBPAEtN), and (f) pEtBPAEtN.
Figure 4.4. DSC thermograms of polymer models (a) PC, (b) PEN, (c) pBAN, (d) p(BPAC)-alt-(EtC), (e) p(BPAEtN)-co-(EtBPAEtN), and (f) pEtBPAEtN.
Figure 4.5. MALDI TOF spectrum (in positive mode) of the homopolymer PC.
Figure 4.6a. MALDI TOF spectrum (in positive mode) of the homopolymer PEN.
Figure 4.6b. MALDI TOF spectrum (in positive mode) of the homopolymer PEN.
Figure 4.7. MALDI TOF spectrum of poly(bisphenolA- naphthalate) - pBPAN.
Figure 4.8. MALDI-TOF spectrum of copoly(bisphenolA carbonate)-alt-(ethylene carbonate) – p(BPAC)-alt-(EtC).
v
Figure 4.9. MALDI-TOF mass spectrum (in positive mode) of poly(ethoxy-bisphenolA naphthlate)-co-(diethoxy-bisphenolA naphthlate) - p(BPAEtN)-co-(EtBPAEtN).
Figure 4.10. MALDI TOF mass spectrum (in positive mode) of poly(diethoxy-bisphenolA naphthlate) pEtBPAEtN.
Figure 4.11. block diagram of solvent extractions.
Figure 4.12. 1H NMR spectra of equimolar PC-PEN mixture melt-mixed
at 280°C for 0, 2, 5, 20, 45, and 60 min in the presence of Ti(OBut)4 as catalyst. (EtC = adsorbed molecules of ethylene carbonate; * = solvent signal – CDCl3/d-TFA – 80/20 v:v).
Figure 4.13. 13C NMR spectra of equimolar PC-PEN mixture melt-mixed
at 280 °C for 0, 2, 5, 20, 45, and 60 min in the presence of Ti(OBut)4 as catalyst. The carbon assignments are given in Table 1. (EtC = adsorbed molecules of Ethylene Carbonate).
Figure 4.14. Evolution of the molar composition of the sequences A, B, C, D, E and F into PC-PEN copolymers as a functions of reactions time: (A) carbonate, (B) ethylene-naphthalate, (C) bisphenolA-naphthalate, (D) ethylene-carbonate, (E) ethoxy-bisphenolA-bisphenolA-naphthalate, (F) diethoxy-bisphenolA-naphthalate.
Figure 4.15. Thermogravimetric curves obtained by TGA of the PC-PEN copolymers produced by reactive blending of PC and PEN in the molten state.
Figure 4.16. Loss weight derivative curves (DTGA) obtained by TGA of the PC-PEN copolymers produced by reactive blending of PC and PEN in the molten state.
Figure 4.17. DSC thermograms of PC-PEN equimolar mixtures (50/50 in mole) melt blended at 280 °C in nitrogen flow at different mixing times.
Figure 4.18. FTIR spectra in the range 1630 – 1870 cm-1of the materials
obtained by reactive melt mixing of PC and PEN to 0, 10, 20, 30, 45 and 60 min.
vi
Figure 4.19. Comparison of GPC curves of the initial PC homopolymer with that of THF soluble PC-PEN copolymers (20, 30, 45 and 60 min). Figure 4.20. MALDI-TOF spectra of PC-PEN copolymers obtained after 60 min of reactive melt blending at 280°C of equimolar PC-PEN blend. Figure 4.21. MALDI-TOF spectra of THF soluble PC-PEN copolymers (20, 30, 45 and 60 min) obtained by reactive melt blending at 280 °C of equimolar mixture PC-PEN (respect to the repeat unit) in the presence of Ti(OBut)4 (0,2% w) as catalyst.
vii
List of tables
Table 2.1. Nuclei used in Polymer NMR.
Table 3.1. Some properties of polymer models and of heated PET and MXD6 samples with and without TA at 285 °C.
Table 3.2. Mass Assignments of peak present in the MALDI spectra of unprocessed and processed PET and MXD6 samples, reported in Figures 3.1 and 3.2.
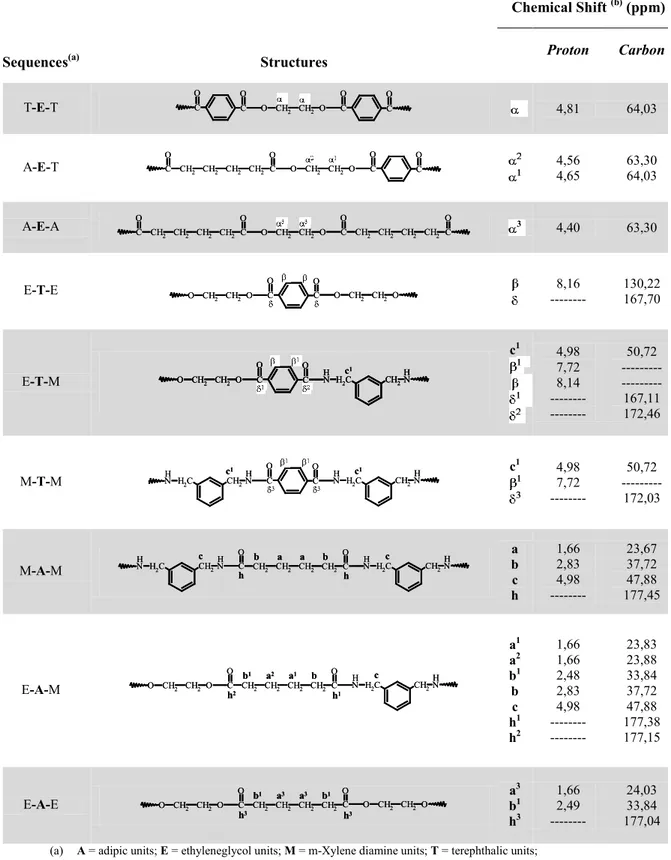
Table 3.3. Assignments of Chemical Shift due to the Protons and Carbons belonging to sequences centered in the Ethylene Glycol, Terephthalate, Adipate structural units along the PET-MXD6 copolymer chains, as observed in their NMR spectra portrayed in figures 3.3, and 3.4.
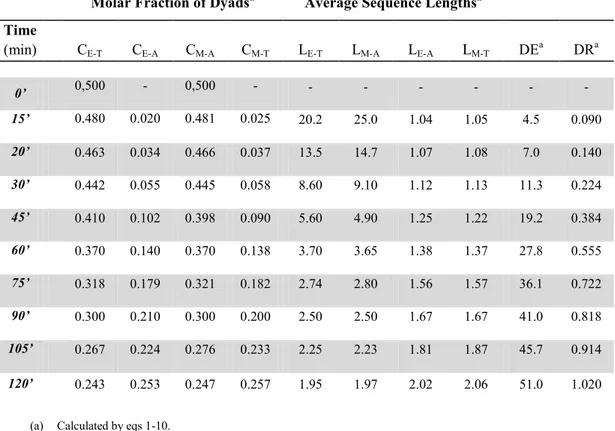
Table 3.4. Material Balance, Molar fraction of Dyads, Average Sequences Lenghts, Degree of Exchange (DE) and Degree of Randomness (DR)
calculated from 1H-NMR spectra of equimolar PET-MXD6-(1 wt%)TA
blends Melt Mixed at 285 °C for different time.
Table 3.5. Molar fraction of Dyads and Triads, Average Sequences Lenghts, Degree of Exchange (DE) and Degree of Randomness (DR)
calculated from 13C NMR spectra of equimolar PET-MXD6-(1 wt%)TA
blends Melt Mixed at 285 °C for different time.
Table 3.6. Mass Assignments of peaks present in the experimental an calculated MALDI Mass Spectra of the PET-MXD6 (120 min) Random Copolymers reported in Figure 3.5.
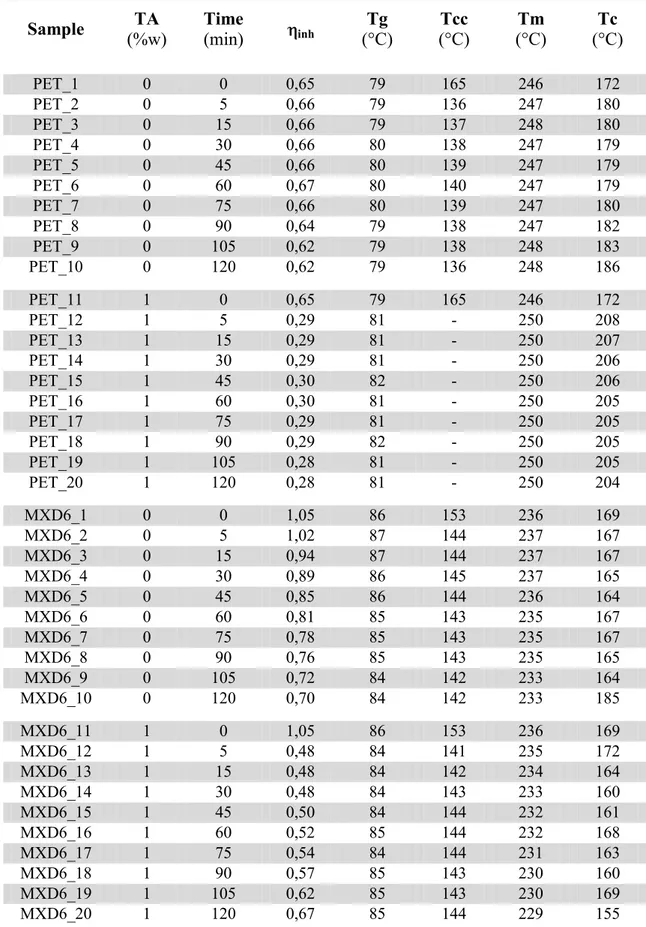
Table 3.7. Viscosity ( inh), thermal properties (Tg, Tcc, Tc and Tm) and
TGA data (PDT) of PET-MXD6-(1%w)TA blend melt mixed at 285 °C for different times. Thermal properties were determined by DSC analysis. Table 4.1.Thermal and viscosimetric characteristic of polymer models. Table 4.2. m/z values of the chemical species detected on the MALDI-TOF spectrum of the PC.
viii
Table 4.3. m/z values of the chemical species detected on the MALDI-TOF spectrum of the PEN.
Table 4.4. Assignments of oligomers families observed in the MALDI TOF spectrum of pBPAN in the region 1660-2300 Da.
Table 4.5. m/z values of the chemical species detected on the MALDI-TOF mass spectrum of the p(BPAEtN)-co-(EtBPAEtN).
Table 4.6. Carbon signal assignments of structural units in the PC-PEN
copolymers as observed in their 13C-NMR spectra.
Table 4.7. Molar ratio of ethylenic to naphthalate units (Et/N) and normalized molar composition (%mol) of the sequences A, B, C, D, E and
F in the PC-PEN copolymers calculated by 1H and 13C NMR analysis.
Table 4.8. Average sequence lenghts (LA, LB, LC, LD, LE and LF), Degree of Exchange (DE), and Degree of Randomness (DR) in the PC-PEN
copolymers calculated by 1H and 13C NMR analysis.
Table 4.9. % Mol and % weight of eliminated ethylene carbonate (EtC)
and CO2, as a function of reaction time, during reactive melt blending at
280 °C of equimolar PC-PEN blends in the presence of Ti(OBut)4 (0,2%
w) as catalyst. The following data are calculated by (1H and 13C) NMR and compared to %loss weight by Themogravimetric Analysis (TGA) of
the same initial mixture at 280 °C and in N2 flow.
Table 4.10. Thermal Properties of PC-PEN copolymer by DSC analysis.
Table 4.11. % weight of the component sequences (WA, WB, WC, WD, WE
and WF), calculated Tg by eq. 19, and experimental Tg, of the equimolar
PC-PEN blends.
Table 4.12. Viscosity data ( inh) and GPC data (Mw, Mn and PD) of the
material obtained by reactive melt blending of equimolar PC-PEN blends. Table 4.13. Assignments of the mass peaks observed in the MALDI-TOF spectra of PC-PEN copolymers obtained after 60 min of reactive melt blending at 280 °C of equimolar PC-PEN blends in the presence of Ti(OBut)4 (0,2% w) as catalyst.
ix
Table 4.14. Assignments of the mass peaks observed in the MALDI-TOF spectra of THF soluble PC-PEN copolymers (20, 30, 45 and 60 min) obtained by reactive melt blending at 280 °C of equimolar PC-PEN
x
List of schemes
Scheme 3.1. Exchange reactions that might occur during the melt mixing of PET-MXD6 blends.
Scheme 3.2. Outer-outer transamidation reaction;
Scheme 3.3. Reactions occurring during the treatment of PET or MXD6 with TA at 285°C.
Scheme 3.4. Formation of cyclopentanone end groups during the melt mixing of MXD6.
Scheme 3.5. Outer-inner exchange reaction: acidolysis of PET. Scheme 4.1. Formation reaction of polycarbonate (PC).
Scheme4.2. Chemical structures of PEN and PET.
Scheme 4.3. Catalyzed Exchange Reactions and consecutive elimination
of CO2 and ethylene carbonate (EtC) in the Melt Mixing of PC with PEN
at 280 °C.
Scheme 4.4. Formation of diethoxy-bisphenolA sequences (F). Scheme 4.5. Synthesis reactions of poly(bisphenolA naphthalate).
Scheme 4.6. Synthesis reactions of copoly(bisphenolA carbonate)-alt-(ethylene carbonate).
Schema 4.7. Synthesis reactions of BPAEt and EtBPAEt co-monomers. Scheme4.8. Reactions synthesis of the monomers diethoxy-bisphenolA. Scheme 4.9. Synthesis reactions of poli(diethoxy-bisphenolA naphtalate).
xi
Abbreviations
TA terephthalic acid.
HFIP hexafluoroisopropanol.
THF tetrahydrofuran.
HABA 2-(4'-Hydroxybenzeneazo)benzoic acid (matrix)
DHB 2,4-dyhydroxy benzoic acid ( matrix)
-Ciano 4- hidroxycinamic acid (matrix)
MALDI-TOF ms Matrix Assisted Laser Desorption
Ionizaztion-Time of Flight mass spectrometry
PET poly(ethylene terephthalate).
MXD6 poly(m-Xylene adipamide).
MXDT poly(m-Xylene terephthalamide.
PEA poly(ethylene adipate).
PC poly(bisphenolA carbonate).
PEN poly(ethylene naphthalate).
pBPAN poly(bisphenolA naphthalate).
p(BPAC)-alt-(EtC) copoly(bisphenolA carbonate)-alt-(ethylene carbonate)
p(BPAEtN)-co-(EtBPAEtN) poly(ethoxy-bisphenolA naphthalate)-co-(di-ethoxy-bisphenolA naphthalate).
1
1. INTRODUCTION
1.1 - Preface
The modern technology require to macromolecular chemistry the availability of materials able to respond always better to the differen features behavioural demands by designers. The tendency is to obtain materials with innovative properties apparently incompatible: high elastic module together with good impact resistance, ease of fabrication combined with a high resistance to temperature, high permeability and selectivity to gases (membranes for separation of gas mixtures), low
permeability to atmospheric gases (O2 and CO2) and good
biodegradability (food packaging) etc. In this respect, macromolecular chemists have directed their research in the synthesis of new materials, starting by mixtures of preexisting homopolymers. So arise the field of the “polymeric blends” which today is probably the most effective and
convenient method to get innovative and versatile materials having
properties which often correspond to the merge of the best characteristics of the starting polymers.
The preparation of polymeric compounds can be performed
according to different methods 1, 2:
- Physical mixing; - Casting by solvent;
- Solution / precipitation by solvent in no-solvent; - Melt Blending.
The melt blending of polymers is certainly the most interesting technical to develop materials with new properties or improve some already on the source homopolymers. Furthermore, the mixing processes allow you to recycle polymeric materials after use.
2
The formation of a monophase blends, where the size of the domains is comparable with the size of individual macromolecules (total miscibility) or a biphasic materials, with total or partial segregation of the components in the two phases (total or partial miscibility), depends of the interactions between different polymer chains.
According to the theory of Flory-Huggins 1, 2, the miscibility of
polymer blends in the molten is dictated by energetic considerations
( Gmix = Hmix –T Smix). The change of entropy during the mixing of
polymers has a very low value, and gradually becomes negligible with increasing of polymerization degree (molecular weight). The driving factor that indicates the miscibility between two polymers in the molten
state is therefore the enthalpy change during the blending1, 2.
Negative Hmix indicate complete miscibility at the molecular level,
with small homopolymer clusters randomly dispersed in the blend (monophase blends). These blends, generally, exhibit very good mechanical properties, in general corresponding to the linear sum of those of the individual components. For biphasic blends, however, the high surface tension does not allow the homogenization of the material, with no interfacial adhesion. Immiscible or partially miscible polymer blends usually show a behavior highly "elastic", which often causes serious problems during processing, such as swelling of the extruded and fracturing under stress. The swelling of the extruded is caused by the shape recovery of the dispersed particles. In general, these problems of the processability can be reduced or completely eliminated by compatibilization. The best compatibilizers agents are block and/or graft copolymers, which usually are added in small percentages to the initial mixture of polymers. As shown in Figure 1.1, these copolymers migrate to the interface of the polymer phases and, by acting as emulsifiers, reducing the repulsive energy between the different domains.
3
In the grafting and block copolymers is maintained the individuality of the various components, which correspond to segments of polymer of
limited length, each characterized by its glass transition temperature (Tg).
In the block copolymers, the greater the length of the blocks, better are the compatibilizers properties of the copolymer itself. The compatibilization
blends, show a single value of Tg, intermediate between those of the two
homopolymers that compose the mixture, in agreement with the classic Fox equation 1, 2.
were W1, W2 and Tg1, Tg2 are the weight fractions and the thermal glass
transition (in Kelvin) respectively of initial homopolymers. Figure 1.1. Copolymer action as compatibilizer.
4
1.2 - Reactive melt blending
Mixtures of polycondensation polymers such as polyesters, polyamides and polycarbonates and, in general, of all polymers containing reactive functional groups within the chain and as terminals, may result in
chemical exchange reactions, when mixed in the molten state 1-4. At these
temperatures (200-300°C), may occur chemical interchange reactions induced by catalysts, utilized in the synthesis, and/or by terminal groups
(-OH, -NH2, -COOH ecc.) present in the polymers or generated by
degradation or hydrolytic reactions. In this way can be formed, block, statistical or grafting copolymers, which can act as compatibilizers agents of the initial mixture, sometimes with improving of the mechanical, physical, and chemistry properties. Therefore, the study of the mechanisms and kinetics of exchange and degradation reactions that occur in the molten state, and compositional analysis of materials obtained, it is a necessary step to prepare polymer blends with known and reproducible properties.
Scheme 1: Exchange reactions with inner-inner and outer-inner
5
Among the possible processes, we can distinguish reactions between functional groups in the chain (inner-inner, scheme 1, A-B) and reactions that involving terminal groups and those on the chain (outer-inner, scheme 1, C-D).
In figure 2 is shown a schematic representation of the exchange reactions (primary) and degradation (secondary) that may occur in the system consisting of two homopolymers A and B, containing reactive functional groups, depending on the temperature.
When the mixture is treated in a temperature range 200-300°C, it forms a copolymer AB as a result of intermolecular reactions induced by the presence of functional groups or traces of catalysts1, 2 3, whereas at temperatures higher than 300°C, the exchange reactions are thermally activated, with possibility of simultaneous processes of thermal degradation5, 6.
The type of mechanism that allow the chemical exchange reactions depends on the structure of the polymer chains, and therefore by the
Figure 1.2. Schematic representation of the exchange reactions which can occur in
6
presence of reactive functional groups (such as -OH,-COOH and-NH2)
located within the chain or as terminal groups.
In an equimolar mixture of two homopolymers, A and B, containing reactive functional groups inside, assuming that the reactivity of these groups is the same, every species has equally likely to react with a mechanism like inner-inner, because the concentration of functional groups is the same for both polymers. Therefore, the composition of copolymer AB format must be equal to the initial composition of feed (1:1), regardless of the degree of progress of the reactions, which should proceed until the complete transformation of the two homopolymers.
More complex is the case of reactions that proceed with a mechanism of outer-inner type, because in a equimolar mixture of two homopolymers A and B, both can contain reactive end groups having different reactivity. In any case, the speed of the outer-inner reactions is a function of molecular weight of the homopolymers containing reactive end groups, and therefore of their concentration in the molten.
If only one of the two initial homopolymers possess reactive end groups (ie, the other has a very high molar mass), the reaction rate will depend solely by concentration of these terminals, and the AB copolymer initially formed will contain an excess of units in the reactive polymer.
Therefore, the determination of the nature and composition of the produced copolymer by reactive mixing of two initial homopolymers, may be regarded as a key to understanding the type of reaction occurred.
7
1.3 – Aim of the work
The scientific and industrial literature shows an increase of new studies concerning to polymer blends between polyesters, polyamides and polycarbonates, three important classes of thermoplastic homopolymers, that are immiscible each with other. The compatibilization of the starting polymers, obtained directly during processing (extrusion) or by chemical exchange reactions between the polymer chains, or by adding small amounts of block and or graft copolymers, is certainly one of the key aspects that suggests a macromolecular chemists to study these systems with increasing interest, also because the development of a compatibilized system drastically reduces the costs associated to the production and to the processing of the new materials.
Within of this research topic, the PhD work has been focused on the synthesis and characterization of the following binary blends:
o Polyesters PET (polyethylene terephthalate) with polyamide MXD6 (polymeta-xylene adipamide), at 285 °C, in nitrogen flow and in presence of terephthalic acid;
o Polyesters PEN (polyethylene naphthalate) with polycarbonate PC (polybisphenolA carbonate), at 280 °C, in nitrogen flow and in
presence of titanium tetra butoxide [Ti(ButO)4] as
transesterification catalyst.
The aim of research was to have a comprehensive characterization of the interchange reactions that can occur during the reactive blending of PET-MXD6 and PC-PEN blends, in order to establish the possible types of copolymers that can be obtained (blocks, miltiblocks, random) on the base of reaction conditions (temperature, time of processing, type of additive, type of mechanical mixer, etc.).
8
1.4 - References:
1. G. Montaudo, C. Pulgisi, and S. Samperi, Transreactions in
Condensation Polymers – Fakirov S, Ed. Wiley-VCH: New York, Chapt.4;
2. AIM “Macromolecole, Scienza e Tecnolocgia” Vol.1;
3. G. Montaudo, C. Puglisi, F. Samperi, and F.La Mantia, J Polym Sci, Part A; Polym Chem Ed - 1996, 34, 1283;
4. G. Montaudo, C. Puglisi, and F. Samperi, Macromolecules – 1998, 31, 650;
5. B. Plage, H.R. Schulten, J Anal Appl Pyrolysis - 1989, 15, 197; 6. C. C.Huang, F.C. Chang, Polymer - 1997, 38 (9, 179), 2135.
9
2. CHARACTERIZATIONS TECHNIQUES
2.1 – Nuclear Magnetic Resonance
Nuclear magnetic resonance (NMR) spectroscopy 1-5 is a very
powerful technique for polymer characterisation. It can be used to determine tacticity, branching and structural defects such as the occurrence of head-to-head placement of monomers in vinyl polymers, the sequence of comonomer units in a copolymer chain, and chemical changes such as oxidation states which can be detected at levels as low as
one site per 500 repeat units. Although 13C NMR is commonly used in
polymer characterisation, NMR measurements employing other
NMR-active nuclei such as 1H, 15N, 17O and 19F having magnetic moments may
have an advantage in the study of some polymers. For example, 29Si NMR
may be used in the characterisation of polysiloxanes, 19F NMR for
fluoropolymers, 15N NMR for polyamides, and 31P NMR for
polyphosphazenes. A complete listing of important NMR-active nuclei
and their natural abundance is given in Table 1 5.
Many atomic nuclei behave as if they were spinning. In fact, any atomic nucleus, which possesses either odd mass or odd atomic number, or both, has a quantised spin angular momentum and a magnetic moment.
Table 1. Nuclei used in Polymer NMR.
Nuclei Spin Natural
Abundance (%) Shift Range (ppm) 1H 1/2 99.985 15 2H 1 0.0156 15 13C 1/2 1.108 220 14N 1 99.634 900 15N 1/2 0.365 900 17O 5/2 0.037 800 19F 1/2 100 800 29Si 1/2 4.70 250 31P 1/2 100 700
10
Among the more common nuclei which possess "spin" one may include 1H, 2H, 13C, 14N, 17O, and 19F. Notice that the nuclei of the ordinary (most
abundant) isotopes of carbon and oxygen 12C and 16O are not included
among those with the spin property. However, the nucleus of the ordinary hydrogen atom, the proton, does have spin. For each of the nuclei with spin, the number of allowed spin states which it may adopt is quantised and is determined by its nuclear spin quantum number, I. This number is a physical constant for each nucleus. For a nucleus of spin quantum number I, there are 2I + 1 allowed spin states which range with integral differences from +I to -I. For spin ½ nuclei the possible magnetic quantum numbers are +½ and -½. When placed in a magnetic field, nuclei having spin undergo precession about the field direction. The frequency of this so-called Larmor precession is designated as ωo in radians per second or υo in Hertz (Hz), cycles per second (ωo = 2πυo). The nuclei can be made to flip over, i.e. reverse the direction of the spin axis, by applying a
second magnetic field (Figure 2.1), designated as H1, at right angles to Ho.
The Larmor precession frequency or resonance frequency is given by:
Figure 2.1. The spin states of a proton both in the absence and in the presence of applied magnetic field.
11
where γ is the magnetogyric ratio. The two quantities that determine the observation frequency for NMR signals are the magnetogyric ratio γ and the magnetic field strength Ho. The sensitivity depends both on the magnetogyric ratio and on the natural abundance of the NMR active nuclei. Protons have the highest sensitivity because they have the highest magnetogyric ratio and natural abundance (Table 1).
The NMR spectrum is usually observed by applying a radio frequency pulse near the resonance frequency and observing a free induction decay (FID). The NMR spectrum, a plot of intensity vs. frequency, is obtained by Fourier transformation of the observed signal. The signal frequency (or chemical shift) is reported relative to some reference compound. The integrated signal intensity is proportional to the number of nuclei. This property is important because it allows us to use NMR as a quantitative tool.
Solution NMR is extremely useful for polymer characterisation because the chemical shifts and relaxation times are sensitive to polymer microstructure. High-resolution spectra are observed because the linewidths are less than the chemical shift variations due to the polymer chain chemical structure and microstructure. The chemical shift resolution results from variations in nuclear shielding arising from variations in electron density that are affected by the presence of nearby electron withdrawing or donating groups. The chemical shift changes can be related to through-bond inductive effects and through-space interactions. The largest effects on the chemical shifts are the chemical type, and the resonances from methyl, methine, methylene and aromatic groups are often well separated in the NMR spectrum. Carbon NMR has been extensively used for the solution characterisation of polymers because it is one of the most common elements in polymers. Carbon has a low natural
abundance (1% 13C) but most polymers are sufficiently soluble that it is
12
M). The carbon spectra are often more highly resolved than the proton spectra because the carbon chemical shifts are spread over 200 ppm, rather than the 10 ppm commonly observed for protons.
1H and 13C NMR analyses were performed with a Bruker ACF200
spectrometer at room temperature with deuterated solvent and tetramethylsilane as an internal standard. Two different mixture of deuterated solvent was used:
o CDCl3/(CF3CO)2O/CF3COOD (70:17:13 v/v) for homopolymer
models PET, MXD6, PEA, and MXDT, and all the PET-MXD6 melt-mixed blends;
o CDCL3/d-TFA 20/20 v:v for all PC-PEN melt-mixed blends and
also for the model polymers PC, PEN, pBPAN. p(BPAC)-alt-(EtC), p(BPAEtN)-co-(EtBPAEtN), pEtBPAEtN.
13C NMR spectra were recorded at 50 MHz using the following
acquisition parameters: sweep width, 10,204 Hz and 32.768 data points, giving
a digital resolution of 0.623 Hz per point and an acquisition time of 1.6 s. A pulse width of 3.5 ls and delay of 23 s were used for about 20,000 accumulations. These being the optimized parameters at which peak intensities of carbonyl and methylene carbons most closely match the feed ratio. The acquisition parameters were optimized by the analysis of equimolar PET-MXD6 and PC-PEN physical blends. The data were elaborated with 1D Win-NMR software applying the Lorentz–Gauss enhance function using appropriate line broadening and Gaussian broadening parameters to improve the peaks resolution. The chemical shift resonances were accurately assigned to the specific protons and carbons on the basis of the chemical shifts observed in the spectra for the various model polymers (PET, MXD6, PEA, and MXDT, PC, PEN, pBPAN. p(BPAC)-alt-(EtC), p(BPAEtN)-co-(EtBPAEtN), pEtBPAEtN).
13
Quantification of the 13C NMR signals was performed by integration of
14
2.2 – Differential Scanning Calorimeter (DSC)
One o the most widely used techniques to measure Tg and Tm is
Differential Scanning Calorimetry (DSC) 6 -7. The signal in a DSC
experiment is related to the difference between the “thermal response” of a small (5 to 10 mg) polymer sample and reference cell (empty) in two separate alluminium pans. The two are heated and cooled at the same rate or maintained at a constant temperature, as illustrated in Figure 2.2.
Thermocouple junctions just underneath each position monitor both the temperature of the sample side Ts, and the difference between the temperature of sample side Ts and the temperature of the reference side Tr, ∆T = Tr – Ts. If the cell is empty and thermally symmetric, the temperature of the reference side will always be the same as the temperature of the sample side irrespective of heating and cooling. The values of specific heat Cp, may be obtained from the recorded heat-flow rate by calibration with a pure compound such as sapphire for which Cp is known precisely at different temperatures from Calorimetry measurements.
Figure 2.2. Schematic representation of a typical DSC sample
cell showing the sample (S) and reference (R) pans, as well as the heating and temperature sensing elements.
15
As illustrated in Figure 2.3, a discontinuity in Cp (i.e., ∆Cp = Cpl –
Cpg), characteristic of a second order transition, is observed at the
polymer Tg that is often identified as the temperature at the midpoint it the step change in Cp (i.e., at ∆Cp/2).
For many amorphous polymers, Tg (K) and ∆Cp (J g-1 K-1)are
related by the approximate relationship that ∆Cp * Tg = 115 J g-1 (27.5
cal g-1) 7. During heating of a semicrystalline, additional crystallization may occur at temperatures between Tg and Tm, as illustrated by the crystallization exotherm in Figure 2.3. At Tm, which may be defined as the extrapolated temperature of the initial slope of the melt endotherm, crystallites begin to melt over a wide range of temperatures. The breadth of the endotherm is much larger than typically observed for pure low-molecular-weight compounds as a consequence of the lower order of perfection of polymer crystallites. By calibration with a low-molecular-weight standard such as benzoic acid, the heat of fusion (∆Q) of a
Figure 2.3. Typical DSC curve, using convention that endothermic peak goes down. ∆ indicates the differential signal of temperature between reference and sample.
16
semicrystalline polymer can be determined from measurement of the area under the melt endotherm recorded by DSC.
The thermal behaviors of the all samples (model polymers and of all PET-MXD6 and PC-PEN melt-mixed materials) were investigated in nitrogen atmosphere by TA Instrument Q100 differential scanning Calorimetry (DSC), calibrated with melt purity indium standard (156.6 °C and 28.45 J/g). Samples with a mass of 5 l.1 mg are used. Before any experiment, the baseline is recorded using empty aluminum pan (reference and sample). Each sample was analyzed following the same runs: (i) heating at 10 °C/min from 0 °C to 280 °C; (ii) quenching at 100 °C/ min from 280 °C to 60 °C; (iii) heating at 10 °C/min from 60 °C to 280 °C; and (iv) cooling at 10 °C/min from 280 °C to 60 °C. Three repeated scans were performed to verify the reproducibility of thermal transitions. The Tg values were measured in the second heating and were computed by midpoint method; the melting point temperatures (Tm), the cold crystallization (Tcc), and the crystallization temperatures (Tc) were taken as the maximum of the specific endothermic and exothermic peaks.
17
2.3 – Termogravimetry (TGA)
Measurements of changes in sample mass with temperature are made using a thermobalance (sometimes referred to as a thermogravimetric analyzer). A thermobalance is a combination of a suitable electronic microbalance with a furnace, a temperature programmer and computer for control, that allows the sample to be simultaneously weighed and heated or cooled in a controlled manner, and the mass, time, temperature data to be captured. The balance should be in a suitably enclosed system so that the nature and pressure of the atmosphere surrounding the sample can be controlled (see Figure 2.4). Care is usually taken to ensure that the balance mechanism is maintained at, or close to, ambient temperature, in an inert atmosphere.
Thermogravimetric analysis (TGA) was used to assess thermal stability of all samples (the model polymers, PET-MXD6 and PC-PEN melt-mixed blends) with a TGA-500 V6.7 instrument (TA-INSTRUMENT) coupled with a
TA-Instrument Explorer
operating software. The analyses were performed under dynamic heating conditions, from 50 °C to 800 °C under nitrogen flow (60 mL min-1), at a heating rate of 10 °C min-1, using about 2 mg of sample. The weight and
temperature of the
thermobalance were calibrated using four high-purity magnetic
standards (alumel, nickel, Ni0.83Co0.17 alloy, and Ni0.63 Co0.37 alloy) for
18
the Curie temperature (152.6, 358.2, 554.4, and 746.4 °C, respectively) following both calibration procedure through the instrument control software. Data recorded show the thermal behavior of all samples in terms of weight loss percentage at the increasing of temperature. The slope of degradation curve depends on kind and amount of specific mechanism of degradation during temperature scanning.
19
2.4 – MALDI-TOF mass spectrometry
MALDI-TOF mass spectrometry is an emerging technique offering promise for the fast and accurate determination of a number of polymer characteristics. The MALDI technique is based upon an ultraviolet
absorbing matrix pioneered by Hillenkamp and Karas 9. The matrix and
polymer are mixed at a molecular level in an appropriate solvent with a
~104 molar excess of the matrix. The solvent prevents aggregation of the
polymer. The sample/matrix mixture is placed onto a sample probe tip. Under vacuum conditions the solvent is removed, leaving co-crystallized polymer molecules homogeneously dispersed within matrix molecules. When the pulsed laser beam is tuned to the appropriate frequency, the energy is transferred to the matrix which is partially vaporized, carrying intact polymer into the vapor phase and charging the polymer chains (see figure 2.5)9.
Multiple laser shots are used to improve the signal-to-noise ratio and the peak shapes, which increases the accuracy of the molar mass
determination10. In the linear TOF analyzer (drift region), the distribution
20
of molecules emanating from a sample are imparted identical translational kinetic energies after (Figure 2.6) being subjected to the same electrical potential energy difference.
These ions will then traverse the same distance down an evacuated field-free drift tube; the smaller ions arrive at the detector in a shorter amount of time than the more massive ions. Separated ion fractions arriving at the end of the drift tube are detected by an appropriate recorder that produces a signal upon impact of each ion group. The digitized data generated from successive laser shots are summed yielding a TOF mass spectrum. The TOF mass spectrum is a recording of the detector signal as a function of time. The time of flight for a molecule of mass m and charge z to travel this distance is proportional to (m/z)1/2. This relationship, t ~ (m/z)1/2, can be used to calculate the ions mass. Through calculation of the ions mass, conversion of the TOF mass spectrum to a conventional mass spectrum of mass-to-charge axis can be achieved (See Figure 2.7).
MALDI is a „soft‟ ionization technique in which the energy from the laser is spent in volatilizing the matrix rather than in degrading the polymer. Preparation of an appropriate polymer/matrix mixture is one of the critical limiting factors for the universal application of MALDI to
21
synthetic polymers. With the advent of MALDI in 1992, the challenge has been to discover appropriate matrix materials for use with synthetic polymers, since previous efforts were centered around biopolymers. Synthetic water-soluble polymers have been shown to be capable of analysis using similar conditions to those of biopolymers. Synthetic, organic-soluble polymers, however, have exhibited analysis complications due to their seeming incompatibility with the matrix materials. Because of this fact, only structurally simplistic synthetic water-soluble and organic-soluble polymers have been investigated to date using MALDI analysis.
The purpose of the matrix material, as alluded to previously, is two-fold: (1) absorption of energy from the laser light, thus preventing polymer decomposition, and (2) isolation of the polymer molecules from
one another 10,11,12. Matrices for biopolymers have traditionally utilized
just the biopolymer and the matrix material. Synthetic polymers, particularly organic-soluble polymers, have differing solubilities in the common solvents and often do not have a large concentration of ionized species. Most of the commonly used matrices are 2,5-dihydroxybenzoic acid derivatives, sinapinic acid derivatives, and indoleacrylic acid derivatives. Few compounds are useful as matrix materials due to the numerous stipulations involved: common solubility in a given solvent
22
(water, acetonitrile, ethanol, etc.), absorption, reactivity, and volatility are conditions that must be considered before an appropriate matrix might be
found for a particular synthetic polymer10,11 In addition to the matrix
material, a cationizing species is often added to increase the concentration
of ionized species13. Some linear homopolymers and condensation
polymers have been shown to yield adequate spectra for analysis without a cationizing species but often alkaline salts (LiCl, NaCl, KCl) or silver trifluoroacetate have been included as the cationizing agent to increase the yield of cationized species and allow a more homogeneous cationization.
Surfactants are being investigated14 for use with organic-soluble polymers
where homogenization is not always possible or reproducible. Enhancement of spectra is expected where the surfactant can potentially play a dual role as both a matrix emulsifier and cationization agent.
MALDI-TOF mass spectra were recorded in linear and in reflectron mode with Voyager DE-STR (Perseptive Biosystem) mass spectrometry instrument equipped with nitrogen laser emitting at 337 nm, with a 3 ns pulse width and working in positive mode. The accelerating voltage was 20 kV, and the grid voltage and delay time were optimized for each sample to achieve better resolution. The irradiance was maintained slightly above the threshold. HABA solution 0.5 M in hexafluoro-2-propanol (HFIP or THF) solvent was used as matrices. The concentration of all samples was 5 mg/mL in HFIP (PET, PEN, MXD6, and PET-MXD6 blends) or THF (PC, pBPAN, p(BPAC)-alt-(EtC), p(BPAEtN)-co-(EtBPAEtN), pEtBPAEtN, and PC-PEN blends at 20, 30, 45 and 60 min). Appropriate volume of polymer solution and matrix solution was mixed to obtain a 1:1, 1:2, and 1:3 v/v ratio. About 1 L of each sample/matrix mixture was spotted on the MALDI-TOF sample holder and slowly dried to allow matrix crystallization. Spectra of PET samples were also recorded using DHB (2,4-dyhydroxy benzoic acid) as a matrix (0.5 M in
23
THF) but better spectra were recorded using HABA as the matrix. Indeed the better spectra for PC-PEN blends 20, 30, 45 and 60 min were recorded in reflectron mode using -ciano (4- hidroxycinamic acid) as matrix (0.5 M in THF).
24
2.5 – FTIR Spectroscopy
As with other types of energy absorption, molecules are excited to a
higher energy state when they absorb infrared radiation15-17. The
absorption of infrared radiation is, like other absorption processes, a quantised process. Only selected frequencies (energies) of infrared radiation will be absorbed by a molecule. The absorption of infrared radiation corresponds to energy changes on the order of from 2 to 10 kcal/mole. Radiation in this energy range corresponds to the range encompassing the stretching and bending vibrational frequencies of the bonds in most covalent molecules. In the absorption process, those frequencies of infrared radiation, which match the natural vibrational frequencies of the molecule in question, will be absorbed, and the energy absorbed will serve to increase the amplitude of the vibrational motions of the bonds in the molecule. It should be noted, however, that not all bonds in a molecule are capable of absorbing infrared energy, even if the frequency of the radiation exactly matches that of the bond motion. Only those bonds that have a dipole moment are capable of absorbing infrared radiation. , will not absorb infrared radiation. Symmetric bonds, like those
of H2, or Cl2. A bond must present an electrical dipole, which is changing
at the same frequency as the incoming radiation in order for energy to be transferred. The changing electrical dipole of the bond can then couple with the sinusoidally changing electromagnetic field of the incoming radiation. Thus, symmetric bonds which are symmetrically substituted will not absorb in the infrared. Since every different type of bond has a different natural frequency of vibration, and since the same type of bond in two different compounds is in a slightly different environment, no two molecules of different structures will have exactly the same infrared absorption pattern or infrared spectrum. Although some of the frequencies absorbed in the two cases might be the same, in no case of two different
25
molecules will their infrared spectra (the patterns of absorption) be identical. Thus, the infrared spectrum can be used for molecules much as a fingerprint can be used for humans. By comparing the infrared spectra of two substances thought to be identical, one can establish whether or not they in fact are identical. If their infrared spectra coincide peak for peak (absorption for absorption), in most cases the two substances will be identical.
In the following are listed all samples analyzed with FTIR: - PC-PEN copolymers; - PC; - PEN; - pBPAN; - p(BPAC)-alt-(EtC); - p(BPAEtN)-co-(EtBPAEtN); - pEtBPAEtN.
FT-IR spectra of all samples, were recorded on a Perkin-Elmer Instruments, Spectrum One FT-IR Spectrometer. KBr pellets with a sample concentration of 0.5% w/w were prepared by a mechanical press operating at 10 atm
26
2.6 – Viscosimetry
Viscosity of a polymer solution depends on concentration and size (i.e., molecular weight) of the dissolved polymer. By measuring the solution viscosity we should be able to get an idea about molecular weight. Viscosity techniques are very popular because they are experimentally simple. They are, however less accurate and the determined molecular weight, the viscosity average molecular weight, is less precise. For example, Mv depends on a parameter which depends on the solvent used to measure the viscosity. Therefore the measured molecular weight depends on the solvent used. Despite these drawbacks, viscosity techniques are very valuable.
Several methods exist for characterizing the solution viscosity, or more specifically, the capacity of the solute to increase the viscosity of the solution. That capacity is quantified by using one of several different measures of solution viscosity. The most common solution viscosity terms are:
Relative viscosity;
Specific viscosity;
Inherent viscosity;
Intrinsic viscosity;
where η0 is the viscosity of the pure solvent and η is the viscosity of
a solution using that solvent. The extrapolated value of sp/c or inh at zero
concentration is known as the intrinsic viscosity [ ] (see Figure 2.8). For
dilute polymer solutions, typically 0.5g/dL, Inherent viscosity ( inh) is
27
Intrinsic viscosity is proportional to average molecular weight of the respective polymer:
Mark-Houwink-Sakurada
where K and are a function of type of polymer, solvent and temperature.
The most useful kind of viscometer for determining intrinsic viscosity is the "suspended level" or Ubbelohde viscometer, sketched below:
The viscometer is called "suspended level" because the liquid initially drawn into the small upper bulb is not connected to the reservoir as it flows down the capillary during measurement. The capillary is suspended above the reservoir. In conjunction with the pressure-equalization tube, this ensures that the only pressure difference between the top of the bulb and the bottom of the capillary is that due to the hydrostatic pressure--i.e., the weight of the liquid.
Capillary viscometry is conceptually simple: the time it takes a volume of polymer solution to flow through a thin capillary is compared to the time for a solvent flow. It turns out that the flow time for either is proportional to the viscosity, and inversely proportional to the density.
Figure 2.8. Schematic plots of sp/c and inh vs.
28
For most polymer solutions at the concentrations of interest, solution
solvent.
Thus, to a very good approximation, the relative viscosity is a simple time ratio:
The inherent viscosity ( inh= ln r/C) of all samples was measured at
30 0.1 °C with an Ubbelohde viscometer and at a concentration of 0.5 mg/dL. PET-MXD6 and PC-PEN copolymers, as well as, for PC and PEN, were dissolved in phenol/tetrachloroethane 60/40 w/w, while for the other polymer (pBPAN, PBPAN, p(BPAC)-alt-(EtC), p(BPAEtN)-co-(EtBPAEtN), and pEtBPAEtN) were used only tetrachloroethane.
29
2.7 – Gel Permeation Chromatography (GPC)
Gel-filtration or gel-permeation chromatography (GPC), uses porous particles to separate molecules of different sizes. It is generally used to separate biological molecules, to determine molecular weight distributions of polymers (Mw, Mn) and their polydispersity index (PDI). Molecules that are smaller than the pore size can enter the gel particles and therefore have a longer path and longer transist time than larger molecules that cannot enter the particles (Figure 2.9).
Molecules larger than the pore size can not enter the pores and elute together as the first peak in the chromatogram. This condition is called
total exclusion (V0). Molecules that can enter the pores will have an
average residence time in the particles that depends on the molecules size and shape. Different molecules therefore have different total transit times through the column. This portion of a chromatogram is called the selective permeation region. Molecules that are smaller than the pore size can enter all pores, and have the longest residence time on the column and
elute together as the last peak in the chromatogram (Vt).
Figure 2.9. Schematic of a gel-permeation chromatography column. GPC Chromatogram; Vo= no retention, Vt= complete retention, A and B = partial retention
30
This last peak in the chromatogram determines the total permeation limit.
It can be shown that hydrodynamic volume is proportional to the product [η]M where [η] is the intrinsic viscosity and M is the molecular
weight19. A plot of log [η]M versus elution volume (or elution time) for a
particular solvent, column, and instrument provides a universal calibration curve which can be used for any polymer in that solvent so long as the Mark-Houwink constants are known for the polymer-solvent pair. Such a calibration curve is obtained by determining the retention volumes (or times) of monodisperse polymer standards. Once the calibration is obtained, the gel permeation chromatogram of any other polymer can be obtained in the same solvent and the molecular weights (usually Mn and Mw) and the complete molecular weight distribution for the polymer can be determined. If the polymer to be analyzed is the same polymer as that used in obtaining the calibration, a plot of log M versus elution volume (or time) can be used since the Mark-Houwink constants for the sample are the same as those for the standards.
The average molar mass (Mw and Mn) values of PC and of the PC-PEN copolymers soluble in THF (20, 30, 45 and 60 min mixing) were calculated by GPC analysis using relative calibration curve derived by linear narrow polystyrene (PS) standards. In a typical analysis, 100 L of
The total volume can be considered by the following equation18, where Vg is the
volume of the polymer gel and Vt is the total volume: Vt = Vg + Vi + Vo. Analytes that are not retained are eluted with the free volume outside of the particles (Vo), while analytes that are completely retained are eluted with volume of solvent held in the pores (Vi).
31
a polymer solution in THF (2–3 mg/mL) was injected and eluted at a flow rate of 1mL/min, using THF as eluent and o-dichlorobenzene (1 L) as flow marker.
32
2.8 – References
1. D. L. Pavia, G. M. Lampman and J. George S. Kriz, "Introduction
to Spectroscopy", W.B Saunders Company, 1979, p.81.
2. E. D. Becker, "High resolution NMR: theory and chemical
applications", Academic Press, 1980, p.3.
3. C. D. Craver and J. Chares E Carraher, "Applied Polymer Science
21st Century", Elsevier, 2000, p.787.
4. W. Kemp, "NMR in chemistry: a multinuclear introduction",
Macmillan Education, 1986, p.2.
5. J. R. Fried, "Polymer Science and Technology", Prentice Hall PTR,
1995, p.66.
6. P. J. Haines, "Thermal Methods of Analysis", Blackie Academic
and Professional, 1995, p.63.
7. J. R. Fried, "Polymer Science and Technology", Prentice Hall PTR,
1995, p.153.
8. M. P. Stevens, "Polymer Chemistry", Oxford University Press,
1999, p.149.
9. Karas, M.; Hillencamp, F. Anal. Chem., 1988, 60, 2301.
10. Karas, M.; Hillencamp, F.; Beavis, R. C.; Chait, B. T. Anal. Chem., 1991, 63(24), 1193A.
11. Beavis, R. C. Org. Mass Spec., 1992, 27, 653. 12. Creel, H. S. Trends Poly. Sci., 1993, 1(11), 336.
13. Bahr, U.; Deppe, A.; Karas, M.; Hillencamp, F. Anal. Chem., 1992, 64, 2866.
14. Kassis, C. M.; Belu, A. M.; DeSimone, J. M.; Linton, R. W.; Lange, G. W.; Friedman, R. M. Poly. Prep., 1996, 37(1), 833.
15. D. L. Pavia, G. M. Lampman and J. George S. Kriz, "Introduction to Spectroscopy", W.B Saunders Company, 1979, p.13.
33
16. C. D. Craver and J. Chares E Carraher, "Applied Polymer Science 21st Century", Elsevier, 2000, p.709.
17. P. C. Painter and M. M. Coleman, "Fundamentals of polymer science", Technomic Publishing Company, Inc., 1997, p.145.
18. Skoog, D.A. Principles of Instrumental Analysis, 6th ed.; Thompson Brooks/Cole: Belmont, CA, 2006, Chapter 28.
PART (I)
CHARACTERIZATION OF COPOLYESTERAMIDES FROM
REACTIVE BLENDING OF PET AND MXD6 IN THE
34
3.1 – Introduction
Blends of condensation polymers such as polyesters, polyamides, and polymers bearing reactive functional groups in the backbone or at the chain ends may yield chemical exchange reactions when they are mixed in the molten state, leading to the formation of block, segmented, random, or
grafted copolymers, affecting the properties of the original blends.1–29 An
exchange reaction may be proceeded by the direct exchange between two functional groups located inside the polymer chains (referred to inner– inner exchange) and by the attack of reactive chain ends on inner groups
(referred to inner–outer exchange).1–7 Exchange reactions may be induced
by the presence of catalyst residues used in the polymerization or may be
caused by reactive terminal groups (i.e., OH, COOH, and NH2), originally
present in the polymers or generated in situ by thermal-and/or hydrolytic
degradation reactions.1–29 In the past 18 years, we have investigated
exchange reactions occurring in the melt-mixing processes of several condensation polymer blends with both end-capped polymer samples and
polymers possessing specific reactive chain end groups.1–7
Polyester/polyamide blends such as poly(ethylene
terephthalate)/nylon-6 (PET-Ny6), poly(butylene terephthalate)/nylon-6 (PBT-Ny6), PET-nylon-66 (PET-Ny66), and PET-poly- (m-xylene
adipamide) (PET-MXD6) have been investigated.5,6,8–22,30–35 Several
literature reports assert that exchange reactions occurring in polyester/polyamide blends can be induced with an appropriate catalyst.9,16,18,19,22,30 Some researchers16,18,19 have stated that p-toluene sulfonic acid (TsOH) is an efficient catalyst for amide–ester exchange
reactions in PET-Ny6 and PET-Ny66 blends, whereas others21 have
suggested that TsOH catalyzes the outer–inner exchange reaction of an amino end group with an inner ester group of PET. On contrary, in a previous work investigating the role of TsOH and the activity of the
35
reactive chain ends in the melt mixing of Ny6-PET blends,5 we have
found that the role of TsOH is not that of a catalyst but of a reactant; it react with PET yielding PET oligomers terminated with carboxyl
groups.5,36 Then, these oligomers quickly react with Ny6 producing
Ny6-PET copolymers. Our studies have revealed the essential role of carboxyl end groups in the exchange reaction between Ny6 and PET and allowed a detailed mechanism for this reaction, based on the structural identification of the PET-Ny6 copolymers produced in the exchange reactions. In other studies, we have also shown the essential role of active –COOH end groups in the exchange reactions occurring during the melt mixing of
PBT-Ny66 and aliphatic polyamide/polyamide blends.2,7
In this work, we extend our mechanicistic studies on the
PET-MXD6 melt-mixed blends. These blends have attracted scientific,30–35
technical,37 and commercial interest, in particular, in the area of food
packaging because of their potential for combining the low O2 and CO2
permeability of the MXD6 (and order of magnitude higher than that of PET38–39) with the good toughness, clarity, and economics of PET. However, PET and MXD6 give incompatible blends with low optical clarity and an undesirable yellow color when processed in the molten
state.40 PET-MXD6 blends have been studied to improve their
transparency when stretched,31,32 to improve gas barrier of PET,33 and to
address the mechanism of color generation.34 Compatibilized PET-MXD6
(90/10 w/w) blend was obtained through the incorporation of small
amount of sodium 5-sulfisophthalate (SIPE) in the PET matrix.35 The
authors found that the O2 permeability at 43% relative humidity was
reduced by a factor of 3, in comparison of PET, in the biaxially oriented film of the compatibilized blends. Compatibilized blends were also
obtained using ionomers.41 The goal of the studies on the PET-MXD6
blends is to achieve the improved gas barrier, while maintaining good optical clarity, inducing the interchange reaction between PET and MXD6
36
to produce in situ their copolymers and, thus to overcome their incompatibility. Xie et al. reported that the interchange reaction in PET-MXD6 blends (90/10 w/w) in the molten state (290–310 °C) occurs only
in the presence of sodium p-toluenesulfonate (p-TSONa).30 They have
characterized the melt-mixed blends by 1H-NMR in deuterated sulfuric
acid (D2SO4) to degrade selectively the PET components of reacted
blends, and applying a mathematical model have calculated the degree of randomness of PET-MXD6 copolymers. However, the researchers did not report the molar composition of the sequences (dyads and triads) in the formed copolymers, and also a systematic study of the catalytic activity of p-TSONa, especially the activity of the end chains initially present in the homopolymers or generated during their melt mixing. Moreover, the authors did not report any measure of properties as a function of reaction conditions, which correlate with the average molar masses of the melt-mixed PET-MXD6 investigated. In accordance with our previous studies
on the PET-Ny6 melt-mixed blends,5 we believe, contrary to the Xie et
al.,30 that p-TSONa and p-TSOH5 are reagents and not catalysts and that
exchange reactions between PET and MXD6 occur via the attack of reactive carboxylic acid end groups on ester and amide inner groups. Carboxylic acid end groups can be produced in situ by the reaction of p-TSONa with PET homopolymer, which has been confirmed by the preliminary studies performed in the present work.
Here, equimolar mixtures (respect to the repeat units) of PET and
MXD6 were melt mixed at 285 °C under N2 flow for different times with
and without terephthalic acid (TA; 1 wt %). All melt-mixed materials
were characterized by 13C and 1H-NMR, DSC, TGA, and viscosimetric
measurements, without any purification or removal of possible nonreacted homopolymers. The NMR analysis of the crude melt-mixed blends were
performed in a mixture of CDCl3/(CF3CO)2O/CF3COOD (70/17/13 V/V)
37
(dyads and tryads), average sequences lengths, and degree of randomness in the formed PET-MXD6 copolymers, as a function of the reaction times. These data were calculated applying an appropriate statistic model to the corresponding NMR spectra. A modified FOX equation was used to calculate the theoretical glass transition (Tg) of the four components PET-MXD6 copolymers formed by melt mixing of PET-PET-MXD6 in the presence of TA (1 wt %) at different reaction time.
38
3.2 – Materials
PET and MXD6 resin used for melt blending are commercial products useful for packaging with extended shelf life. The PET was supplied by Equipolymers with light C93 commercial grade (ISO viscosity Number ISO 1628/5, 93 mL/g), whereas the Polyamide MXD6 was supplied by Mistubishi Gas Chemical with S6007 commercial grade (M.F.R. 2.0 g/10 min—ASTM D1238 method). Poly(ethylene adipate) (PEA) with Mw 10,000 by GPC, supplied by Sigma Aldrich, was used as polymer model for NMR assignments and DSC characterization. All solvents and reagents: therephthalic acid (TA), m-xylenediamine, phenol, terephthaloyl dichloride, tetrachloroetane, triethylamine, tricaprylmethylammonium chloride (Aliquat 336), methanol, CHCl3, hexafluoroisopropanol (HFIP), anhydride trifluoroacetic (CF3CO)2O, n-hexane, CDCl3, with analytical grade used were purchased from Sigma Aldrich (Italy). Deuterated solvents CDCl3 and CF3COOD were supplied by Merck. Poly(m-xylene terephthalamide) (MXDT) polymer model was also synthesized and characterized in our laboratory.42
39
3.3 - Poly(ethylene terephthalate) - PET
The polyethylene terephthalate is certainly the best known of the
aromatic polyesters2-7. is a thermoplastic resin obtained by
polycondensation between terephthalic acid (or its dimethyl ester) and the ethylene glycol. is certainly one of the most versatile resins. Its repeat unit may be so indicated:
The wide range of products covering applications in the field of textile and technical fibers, packaging, engineering plastics. The properties of PET are determined by an appropriate arrangement of amorphous and crystalline areas. The mechanical and gas barrier characteristics are achieved through the orientation of polymer chains and their simultaneous crystallization.
PET has a glass transition temperature of about 72-74 °C and a melting temperature of about 250 °C. Depending on the greater or lesser molecular weight of PET, expressed by intrinsic viscosity, it determines its uses. This polyester is characterized by high mechanical properties and good tenacity; also has good thermal and chemical resistance, excellent
transparency and gloss and barrier properties to O2 and CO2. The main
applications of polyethylene terephthalate concern the field of packaging: PET is in fact used for the production of bottles for water and soft drinks, although during this process, the PET can undergo phenomena degradation to volatile products (as formaldehyde) that can greatly affect the organoleptic properties of drinks such as mineral not carbonated water8.
PET is also used for the production of bottles for household cleaners, trays, blister thermoforming and for support film of multilayer
C C O O O CH2 CH2 O * * n
40
materials. Moreover, it is also used like synthetic fibers (for clothing, furniture, upholstery, ropes, geotextile use, etc.), or decorative films for graphic arts, as well as radiographic and photographic plates and audio tapes and video.