70
Chapter 5 –
WHOLE-ROCK MAJOR AND TRACE ELEMENTS
GEOCHEMISTRY
5.1 Introduction
All samples were affected by extensive post-magmatic alteration, partially responsible for the relatively high LOI (i.e., loss on ignition) contents and low CaO contents in some of them. The preferential mobility of alkalies compared to aluminium during hydrothermal stages, was also likely responsible for the marked peraluminous character of many of these dykes, expressed by high values of the Aluminum Saturation Index [ASI = molar Al2O3/(CaO + K2O + Na2O)].
In consideration of the widespread alteration, geochemical classification and modelling of the studied dykes has been essentially based on immobile or less mobile elements. Tables of major, trace and rare earth elements composition of studied rocks are reported in Appendix 2, Tables 2.7 and 2.8. Analytical procedures are described in Appendix 3. 5.2 Calabrian dykes
This dyke group includes LMA-PDL, A, F, VZ and ST samples.
In all samples the effects of the hydrothermal alteration are widespread and commonly associated with high L.O.I. content (avg value of 4.84 for LMA-PDL samples, 4.29 for A samples, 4.00 for F samples, 4.43 for VZ samples and 2.56 for ST samples) and sometimes, with very high ASI values (ASI ratio ranges from 1.2 to 1.9 in A group, from 1.3 to 2.8 in F group, from 1.2 to 4.0 in LMA-PDL group, from 1.2 to 2.2 in ST group and from 2.4 to 3.5 in VZ group).
The SiO2 content of the studied rocks ranges from ~49 to ~71 wt.%.
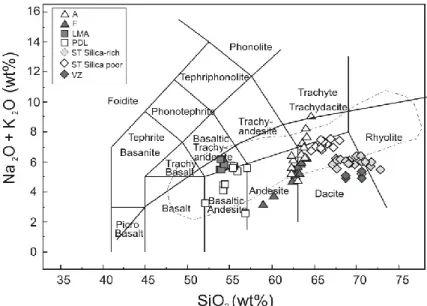
According to the TAS diagram (Le Maitre et al., 1989, Fig. 5.1), samples show a composition ranging from basaltic andesites (LMA-PDL group) to rhyolites (ST group). In particular:
- A samples classify as andesites, dacites and trachydacites; - F samples classify as andesites and dacites;
71
- ST samples classify as dacites and rhyolites; - VZ samples classify as dacites.
ST samples in the TAS diagram, display a clear separation into two different sub-groups, hereafter named as silica-poor and silica-rich ST samples. This geochemical distinction, observable in almost all diagrams showed here after, reflects that already highlighted by the petrographic investigations.
Fig. 5.1: TAS diagram (Le Maitre et al., 1989) for volcanic rocks. Dashed line includes calcalkaline post-Hercynian dykes of Sardinia-Corsica Domain (SCD) (Atzori and Traversa, 1986; Atzori et al.2000;
Traversa et al., 2003). Dividing line is after Irvine e Baragar (1971).
In consideration of the alteration effects, samples have been classified by using the SiO2 vs. Nb/Y classification diagram (Winchester and Floyd,1977; Fig. 5.2). Here minor differences appear: group LMA-PDL straddle the boundary between the sub-alkaline basalt and andesite fields; A and F and dykes classify as andesite; ST and VZ dykes mostly plot in the dacite-rhyodacite field.
72 Fig. 5.2: SiO2 (wt. %) vs. Nb/Y diagram (Winchester and Floyd, 1977). Symbols as in Fig. 5.1
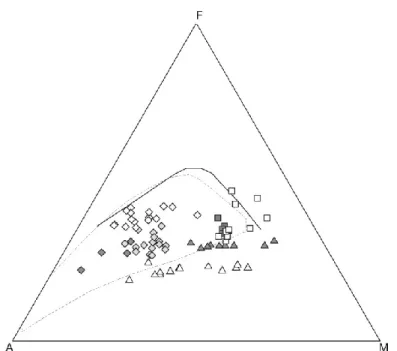
The geochemical affinity for all the investigated dykes appears calcalkaline (Fig. 5.3) with a K-content ranging from medium to high (Fig. 5.4). Only one of the PDL samples and two of the F samples straddle the line dividing the tholeiitic and the medium-K calcalkaline fields.
The composition of late- to post-Hercynian andesitic to rhyolitic calcalkaline dykes from Sardinia-Corsica Domain (SCD) is reported for comparison (Atzori and Traversa,
1986; Atzori et al., 2000; Traversa et al., 2003) in Figs 5.1, 5.3, 5.4, where a nearly
73 Fig. 5.3: Alk (Na2O+K2O) (wt. %) – FeOtot (wt. %) – MgO (wt. %) diagram. Partition line is after Irvine
and Baragar (1971). Dashed line: post-Hercynian calcalkaline dykes of the SCD (Atzori and Traversa,
1986; Atzori et al., 2000; Traversa et al., 2003). Symbols as in figure 5.1.
Fig. 5.4: K2O (wt%) vs SiO2 (wt. %) (Peccerillo and Taylor, 1976). Dashed line: post-Hercynian
calcalkaline dykes of the SCD (Atzori and Traversa, 1986; Atzori et al., 2000; Traversa et al., 2003). Symbols as in figure 5.1
74
Serre basaltic andesites (LMA-PDL samples) are characterized by SiO2 content ranging from 49.0 to 54.3 wt. %. They are on the whole evolved melts, according to their Mg#, ranging from 58 to 71, which have undergone differentiation during the ascent to the surface. However, the most primitive sample, PDL11, characterized by high Mg# (70), MgO (11.42 wt. %) and relatively high Ni (106 ppm) and Cr contents (335 ppm), could be represent a primary mantle melt composition.
Major and trace elements variation diagrams with silica (Fig. 5.5, 5.6), show a general negative correlation, better defined in the PDL samples, for Fe2O3, MgO, Al2O3, TiO2, P2O5, Ni and Cr and Nb. Conversely, no well defined trend is displayed for Na2O, K2O, CaO contents and for some of the most mobile trace elements, including the LILE Ba, Rb, Sr.
A and F andesites groups show higher Mg# than the rocks of previous group, ranging from 64 to 80 and from 66 to 76, respectively. However, Ni and Cr contents are relatively high only in F samples, with average values of Ni = 128 ppm and Cr = 250 ppm.
As a general trend, the investigated samples show a clear negative correlation with silica only for Fe2O3 and MgO, and basically positive correlation for Na2O and P2O5, whereas the rest of the elements show more complex or absent correlations (Fig. 5.5), LILE are quite scattered but F andesitic dykes show a positive correlation between LILE and SiO2, while this is only displayed for Rb among the rocks of group A that show, on the whole absent or even negative correlation. The andesites, as a whole group, are characterized by low HFSE (Nb, Hf, Zr) and high transition element contents (Ni, Cr, Sc, V, Co) (Fig. 5.6).
Data points for VZ dykes appear widely scattered and define no clear trends. However, a negative correlation with silica may be envisaged for Fe2O3 and MgO. It is to be pointed up the relatively high K2O, Rb and Al2O3 and the extremely low Na2O contents, which are very unlikely to reflect an original magmatic composition and are instead considered to reflect post-magmatic modifications responsible for the replacement of magmatic plagioclase by secondary K-feldspar and the growth of secondary white mica, in accordance with the observed petrographic features (Fig. 5.5, 5.6).
75
The ST group is characterized by higher Fe2O3 compared to the andesitic (A and F) and dacitic (VZ) sample groups for a given SiO2 content. Group SiO2-poor is characterized by lower MgO and higher Fe2O3, TiO2, P2O5, CaO and, less clearly, Na2O contents than the SiO2-rich group. No substantial differences between the SiO2-rich and SiO2-poor ST sub-groups can be observed for K2O (Fig. 5.5).
Among the trace elements (Fig. 5.6), only Rb shows a slight positive correlation with SiO2 whereas HFSE contents are negatively correlated. Besides, a significant difference in trace element abundances can be observed among the two ST sub-groups. Indeed, the SiO2-poor group is generally characterized by higher trace elements contents. Exception is only represented by Rb.
Despite scattering, the observed variation trends are on the whole compatible with the existence of genetic links between samples of the same dyke group, but speak against genetic relationships between different dyke groups.
Major and trace element compositions of the Serre dykes are compared with those available for SCD dykes (Atzori and Traversa, 1986; Atzori et al., 2000; Traversa et al.,
2003) and CPO metaluminous to strongly peraluminous granitoids (Rottura et al., 1990)
in Fig. 5.5 and 5.6.
The greatest differences are seen in the anomalously high MgO contents of the Serre dykes, that are also characterized by low to very low Ca content at any SiO2 value. The ST dacitic-rhyodacitic dykes, intruding the metaluminous to weakly peraluminous Serre granitoids, show a rough similarity with these rocks. This similarity is particularly marked for the SiO2-poor sub-group that shows comparable major element contents.
76 Fig. 5.5: Major element (wt.%) vs. SiO2 (wt%) diagrams. Symbols as in Fig. 5.1. Dashed area:
post-Hercynian calcalkaline dykes of the SCD (Atzori and Traversa, 1986; Atzori et al., 2000; Traversa et al.,
2003); grey and ruled areas: calcalkaline metaluminous and strongly peraluminous granitoids of OCP,
77 Fig. 5.6: Selected trace element contents (ppm) vs. SiO2 (wt%). Symbols as in Fig. 5.1.Dashed area:
post-Hercynian calcalkaline dykes of the SCD (Atzori and Traversa, 1986; Atzori et al., 2000; Traversa
et al., 2003); grey and ruled areas: calcalkaline metaluminous and strongly peraluminous granitoids of
78
Chondrite-normalized REE patterns for basic and intermediate dyke compositions are weakly to strongly fractionated, with LaN/YbN ratios ranging from 2.6 to 24.6 in basaltic andesites, and from 9.9 to 14.0 and 8.5 to 11.8 in A and F andesites, respectively (Fig. 5.7a, b, c,d).
Europium anomaly in the former group is negative to nearly absent (Eu/Eu* = 0.48 - 0.91), whereas ranges from slightly negative to slightly positive (Eu/Eu* = 0.82-1.21) in A and F andesites.
The VZ dacitic samples show REE fractionation similar to that of the andesites (LaN/YbN = 12.9-13.8), but with a more prominent Eu negative anomaly (Eu/Eu* ~0.53; Fig. 5.7e). Additionally, they show nearly flat HREE patterns, with HoN/LuN ratios ranging from 0.95 to 1.71.
The ST dacitic and rhyodacitic samples show much more variable REE contents and fractionation (LaN/YbN = 2.6-16.3), and Eu/Eu* varying in the range of 0.53-0.83 (Fig. 5.7f).
On the whole, HREE of all dyke groups cluster around 10-20 times CI chondrite for the basaltic andesites, 4-9 times for the andesites, 10 times for the VZ dacites and 10-20 times for the ST dacites and rhyodacites.
REE element patterns of the Serre dykes share many similarities with the post-Hercynian basic to felsic dykes from the SCD and with the late- to post-tectonic granitoids of the OCP (Fig. 5.7).
79 Fig. 5.7: Chondrite CI-normalized REE patterns for the Serre dykes. Normalization after Nakamura (1974). White area: SCD calcalkaline dykes (Atzori and Traversa, 1986; Atzori et al., 2000; Traversa et
al., 2003); grey area: OCP calcalkaline granitoid rocks (Rottura et al., 1990)
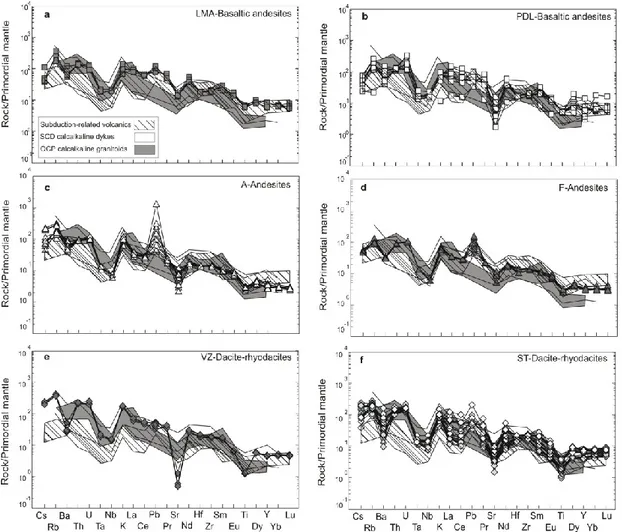
Primitive mantle-normalized incompatible element patterns (Fig. 5.8) show some common features in all the dyke groups, i.e., LILE enrichment relative to HFSE, peaks at Rb and Pb, negative anomalies at Ba, Nb-Ta, Ti and Sr. Compared to the basaltic andesites and andesitic rocks, dacitic and rhyodacitic samples show stronger Ba, Sr and Ti negative anomalies. The peak at Pb, nearly absent in basaltic andesites, is more pronounced in andesitic dykes than in more acidic rock types.
However, all the pattern are on the whole very similar to those of typical subduction-related magmas (Fig. 5.8; Shimizu and Arculus, 1975; Pearce, 1983), emitted within orogenic geodynamic contexts, strongly contrasting with the post-collisional tectonic setting envisaged for the emplacement of the dykes.
These features are also observed in the patterns of SCD calcalkaline dykes (Fig. 5.9) interpreted by Traversa et al. (2003) as the result of variable crustal contamination
80
of mantle magmas derived from subduction-modified lithospheric mantle sources. Besides, a transitional geodynamic setting, from a compressive to a pure extensive one, is also assumed for the SCD dykes emplacement (Traversa et al., 2003).
Fig. 5.8: Primitive mantle normalized trace elements patterns for Serre calcalkaline dykes. Normalization after McDonough and Sun (1995). Subduction-related volcanic rocks (Pearce, 1982), SCD calcalkaline
dykes (Atzori and Traversa, 1986; Atzori et al., 2000; Traversa et al., 2003) and OCP calcalkaline granitoid rocks (Rottura et al., 1990) are shown for comparison.
81
5.2.1 Tectono-magmatic discrimination of Calabrian dykes
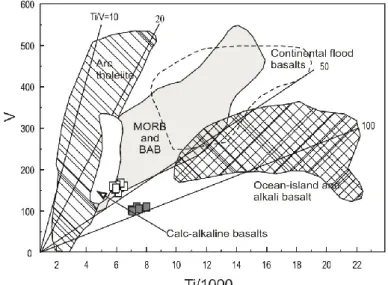
Basaltic andesites are characterized by low TiO2 contents (1.0 -1.2 wt%) and a Ti/V ratio (Shervais, 1982; Fig. 5.9) showing a very large variation range from values roughly similar to those of typical calcalkaline basalts (from 37.6 to 42.6 in the PDL group) to values greater than 50 (from 68.5 – 72.5 in the LMA group). However, the La, Y and Nb contents (Fig. 5.10) are comparable with those of typical orogenic calcalkaline basalts (Cabanis and Lecolle, 1989).
Fig. 5.9: Ti-V discrimination diagram for basalts (Shervais, 1982). The field of arc tholeiites, MORB and back-arc basalts, continental flood basalts, ocean-island and alkali basalts are recognized by their Ti/V
ratio as shown. Calcalkaline basalts plot with low Ti concentrations with a wide range of Ti/V ratios (Rollinson, 1993).
In the Th/Yb vs Ta/Yb diagram (Pearce, 1982; Fig. 5.11), trace elements ratios are used as petrogenetic indicators. Indeed, basaltic magmas deriving from an asthenospheric or lithospheric mantle plot within or close to a diagonal mantle array defined by constant, roughly 1:1, Th/Ta ratios. However, source regions metasomatized by subduction processes are characterized by enrichment of Th with respect to Ta and hence by Th/Yb ratios higher than Ta/Yb.
The same occurs through crustal contamination mechanisms, that usually increase Th/Yb ratios of magmas due to the higher abundances of Th relative to Ta in the crustal rocks. Nevertheless, it is very difficult to distinguish the effects of the two processes.
82 Fig. 5.10: La-Y-Nb discrimination diagram (Cabanis and Lecolle, 1989). 1A: calc-alkali basalts; 1C: volcanic-arc tholeiites; 1B: is an area of overlap between 1A and 1C; 2A: continental basalts; 2B:
back-arc basin basalts; 3A:alkali basalts from intercontinental rift; 3B, 3C: E-type MORB (3B enriched, 3C weakly enriched) 3D: N-type MORB.
LMA-PDL basaltic andesites group shows a significant Th/Yb enrichment. The position occupied by the samples, shifted from the mantle array, can reflect a variety of processes. The high values of both Th/Yb (avg value = 3.5) and Ta/Yb (avg value = 0.2) ratios suggest an enriched magma source, but the high value of the Th/Ta ratio (avg value = 18.4), the low TiO2 contents (~ 1.1 wt%) and the Nb-Ta negative anomaly observed in the spider diagrams, coupled with the high values of other indicative trace elements ratios (e.g., Th/Nb,La/Nb and Ce/Pb) could also imply crustal involvement in the genesis of the studied basaltic andesites (Shimizu and Arculus, 1975; Pearce, 1983;
83 Fig. 5.11: Th/Yb vs. Ta/Yb diagram (Pearce, 1982). MORB and OIB average compositions are from Sun and McDonough (1989); Continental crust: Rudnick and Fountain (1995); UC, LC, MC: upper, lower
and middle crust respectively (Rudnick and Fountain, 1995).
A new version of the Th/Yb vs. Ta/Yb discrimination diagram, modified for intermediate-felsic compositions (Gorton and Schandl, 2000; Fig. 5.12a), has been employed for the Serre intermediate and acidic dykes. Andesites (A and F samples) plot in the active continental margin field together with most of the ST silica-rich dacite-rhyodacites. The other dacite-rhyodacitic samples straddle the boundary with the volcanic arc field.
Similar considerations can be made using the Rb vs. Y+Nb discrimination diagram for felsic compositions (Pearce et al., 1984; Fig. 5.12b), where the Serre dacites and rhyodacites mainly plot in the Volcanic Arc Granites field (VAG) field, which also includes Active Continental Margin Granites, and near the triple point, as commonly observed for post-collisional granitic rocks (Pearce, 1996).
84 Fig. 5.12: a) Compositions of Serre andesites and dacites-rhyodacites in the Th/Yb vs. Ta/Yb plot (Pearce, 1983) modified by Gorton and Schandl (2000) for intermediate-felsic rock compositions. ACM:
Active Continental Margins; WPVZ: Within Plate Volcanic Zones; WPB: Within Plate Basalts. b) Rb (ppm) vs. Y+Nb (ppm) diagram (Pearce et al., 1984) for Serre dacite-rhyodacitic dykes. SYN-COLG: syn-collisional granites; WPG: within-plate granites; VAG: volcanic arc granites; ORG: ocean-ridge
85
5.3 Sicilian dykes
The studied samples, from both the Leonforte sill (VG samples) and the dykes outcropping in the Roccapalumba – Margana – Lercara area (MA and BM samples), suffered an extensive post-emplacement alteration that caused significant mineralogical changes, manifested by growth of secondary phases and, in many cases, by complete obliteration of the original magmatic paragenesis. In terms of geochemical features the alteration processes caused leaching of mobile elements (e.g., K, Rb and Cs) and increase of LOI values, that in some cases are higher than 10 wt%. Furthermore, addition of varying amounts of CaO testified by widespread secondary calcite, has also to be taken into account. Geochemical data have therefore to be treated with caution and classification, as well as geochemical modeling, needs to be mostly based on ratios of immobile, or less mobile, elements.
In this view the Zr/TiO2 vs. Nb/Y classification diagram (Winchester & Floyd,
1977; Fig. 5.14) has been used; VG samples classify as alkali basalts whereas the BM
and MA samples mainly plot in the sub-alkaline andesite/basalt field.
Fig. 5.14: Zr/TiO2 vs. Nb/Y diagram (Winchester & Floyd, 1977). Triangles: BM sample; filled
86
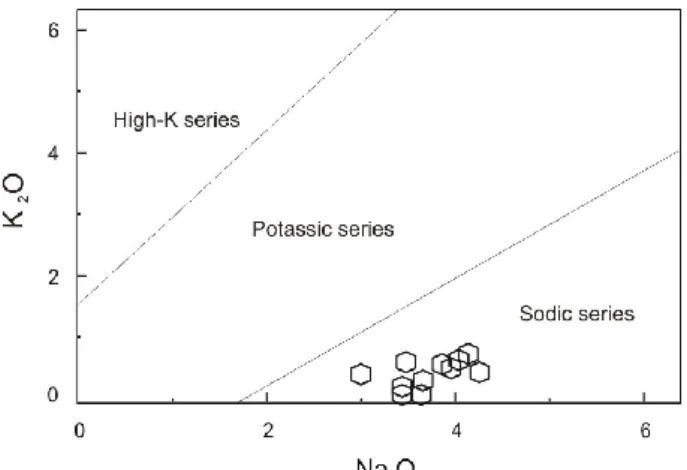
Based on the K2O/Na2O ratios, lower than 0.17, VG alkali basalts show a marked sodic affinity that, nevertheless, could be partly linked to element mobility (Fig. 5.15); the Lercara area sub-alkaline intrusions classify, based on their Nb/Y and Zr/P2O5 ratios values (Floyd & Whinchester, 1975; Fig. 5.16), as tholeiitic basaltic rocks.
Fig. 5.15: K2O vs. Na2O diagram (Le Bas et al., 1986; Le Maitre et al., 2002)
Symbols as in Fig. 5.13.
Fig. 5.16: Nb/Y vs. Zr/(104 * P
87
5.3.1 Alkaline intrusion
VG alkali basalts are characterized by high Fe2O3tot and variable MgO contents (11.30 – 13.87 wt% and 5.41 – 10.14 wt%, respectively), Mg# ranging between 47 and 60, and Cr and Ni showing wide variation ranges (51 – 200 ppm and 48 – 136 ppm, respectively). They do not show compositions that can be considered representative of primary magmas in equilibrium with peridotite mantle that conversely have typically a Mg# of 68 – 72, and Ni and Cr concentrations in the range of 300 – 500 ppm and higher than 1000 ppm, respectively (Frey et al., 1978; Wilson, 1989). However, sample VG1 could be indicated as the most primitive alkali basalt sample, with a Mg# of 60 and Ni and Cr contents of about 136 and 200 ppm, respectively.
Selected major and trace elements variation diagrams for the alkaline volcanic rocks are reported in Figs. 5.17 and 5.18 with MgO as abscissa. TiO2, Fe2O3, Cr (not shown) and Ni contents show a positive correlation reflecting the fractionation of mafic phases. Negative correlations are instead observed for SiO2, Al2O3, P2O5, Na2O and K2O. CaO and Sr have a more scattered distribution but on the whole, both define a slight negative correlation.
LILE and REE also show a scattered distribution. On the other hand, Y, Nb and Zr.show a slightly negative correlation.
Leonforte dyke samples are strongly enriched in highly incompatible elements (e.g. LaN = 61 – 76). REE are fractionated showing steep chondrite-normalized patterns (LaN/YbN = 7.43 – 8.76; Fig. 5.19a), suggesting the possible presence of residual garnet in the source.
Eu anomaly is slightly positive (Eu/Eu* = 1.06 - 1.13), suggestive of a minor role of plagioclase fractionation, or, even considering the predominant immobile character of REE elements, the effects of post-magmatic modifications.
88 Fig. 5.17: Major element contents (wt.%) vs. MgO (wt%) diagrams. Symbols as in Fig. 5.13.
89 Fig. 5.18: Selected trace element contents (ppm) vs. MgO (wt%). Symbols as in Fig. 5.13.
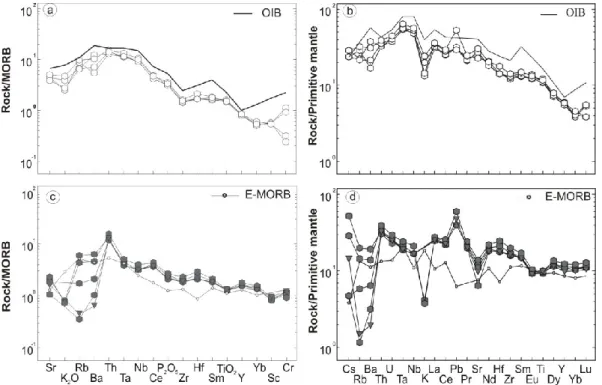
In MORB-normalized diagram (Pearce et al., 1983; Fig. 5.20a) alkali basalts show an OIB-like humped pattern, characterized by high and moderate enrichments in LILE and HFSE, respectively, and negative anomalies at K2O and Zr.
The tight similarity between studied alkali basalts and OIB magmas can be also observed in the primitive mantle-normalized patterns (McDonough & Sun, 1995; Fig. 5.20b): high LILE and HFSE concentrations are here associated with an evident positive
90
Nb–Ta and negative K anomalies, that supports an anorogenic nature of the original magmas (Frey et al., 1978; Clague and Frey, 1982; Hoernle and Schmincke, 1993;
Villaseca et al., 2004), and suggests that crustal contamination did not exert a
significant influence on their composition.
Additionally, the enrichment in HFSE and LREE suggests that the enriched character of the mantle source is likely not related to subduction components.
Fig. 5.19: REE patterns normalized to chondritic values (Nakamura, 1974) for a) alkaline and b) tholeiitic intrusions.
Fig. 5.20: Multi-element patters normalized to MORB composition (Pearce et al, 1983) and to the primitive mantle composition (McDonough & Sun, 1995), for a-b) alkaline and c-d) tholeiitic intrusions.
91
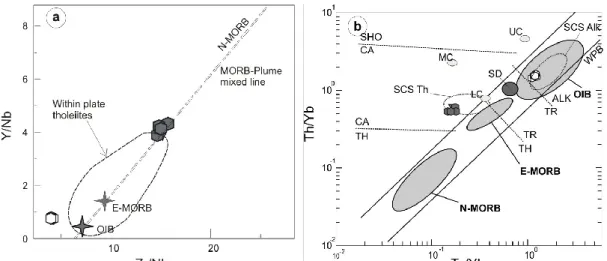
Incompatible elements ratios, such as Y/Nb, Zr/Nb, Th/Yb and Th/Ta (Fig. 5.21a,b), suggest for VG alkaline basalts a derivation from a mantle source enriched in incompatible elements and confirm a minor crustal involvement, since they plot near to the OIB source area (Sun and McDonough, 1989) and within the mantle array, overlapping the field of late Permian Spanish Central System (SCS) alkaline suite (Villaseca et al., 2004; Orejana et al., 2008) and plotting close to the compositional field of the Triassic San Donato alkaline dykes (Barca et al., 2010) for which enriched mantle sources have been invoked.
Fig. 5.21: a) Y/Nb vs. Zr/Nb diagram. N-MORB, E-MORB and OIB average composition from Sun and McDonough (1989); Within-plate tholeiites field from Fodor et al. (1985). b) Th/Yb vs. Ta/Yb diagram
(Pearce, 1982). N-MORB, E-MORB and OIB after Sun and McDonough (1989); UC, LC, MC: upper, lower and middle crust respectively (Rudnick and Fountain, 1995); SCS Th and SCA Alk: Tholeiitic and
alkaline suites of Spanish Central System (Villaseca et al., 2004; Orejana et al., 2008); SD: San Donato alkaline dykes (Barca et al., 2010).
92
5.3.2 Tholeiitic intrusions
BM and MA tholeiitic basaltic samples, although never approaching compositions of mantle primary magmas, show higher Mg# values than alkaline basalts, reaching the maximum in MA11 sample (Mg# = 64), that also has the highest Ni and Cr contents (106 and 323 ppm, respectively).
In the variation diagrams (Fig. 5.17, 5.18) although some possible correlations with MgO are detectable, BM samples mostly show a scattered distribution, argely influenced by post-magmatic alteration. MA samples are also scattered but display, on the whole, negative correlations with MgO for SiO2, TiO2, Al2O3, Na2O and positive, or slightly positive, correlations for Fe2O3, Ni and Cr as well as for Zr, Y, Pb and REE. Rb and K2O show no correlations and have concentrations close to zero in both BM and MA samples. It is interesting to notice that the rocks from the three Sicilian areas show distinctive compositions and trends in the P2O5, Y, Nb and Zr vs. MgO diagrams.
Tholeiitic intrusions are less enriched in highly incompatible elements than alkaline rocks (LaN = 48.9 – 53.2) and show a flat REE patterns (LaN/YbN = 2.27 – 2.48) with a marked Eu negative anomaly (Eu/Eu* = 0.69; Fig. 5.19b).
In MORB-normalized diagram (Pearce et al., 1983; Fig. 5.20c), samples show smooth patterns except for varying amounts of LILE (K2O, Rb and Ba) and positive Th, Ce and Hf anomalies. In primitive mantle-normalized diagram (McDonough and Sun,
1995; Fig. 5.20d) the patterns are more spiked and characterized by remarkable negative
anomalies at Rb, Ba, K, Sr, Eu and Ti, as well as by a prominent Pb peak, reflecting typical features of magmatic suites related to subduction processes or affected by crustal contamination.
Comparison with E-MORB pattern composition (Humpris et al., 1985; Fig. 5.20c, d) shows close similarities, except for the higher Pb, Th, Ce and Hf abundances and the strong LILE depletion in some of the samples, that could be related to the alteration processes.
The same tight association with E-MORB results from fig. 5.21a, where tholeiitic rocks perfectly plot along the mantle array, close to the E-MORB source composition (Sun
and McDonough, 1989) and the within plate tholeiites field (Fodor et al., 1985). In the
Th/Yb vs. Ta/Yb diagram (Fig. 5.21b) the samples occupy a shifted position respect to the mantle array, suggestive of a possible lower crustal contribution in their
93
petrogenesis, and overlap the compositional field of the late Triassic SCS tholeiitic suite (Villaseca et al., 2004) for which two main hypotheses have been proposed: 1) the interaction between an enriched mantle source-derived magma and lower crustal rocks (Cebriá et al., 2003) and 2) the direct introduction of recycled crustal material in the mantle source (Villaseca et al., 2004, and reference therein).
5.3.3 Tectono-magmatic discrimination of the Sicilian dykes
Based on the observed geochemical features, an anorogenic context is clearly indicated for both groups of western and central Sicilian dykes.
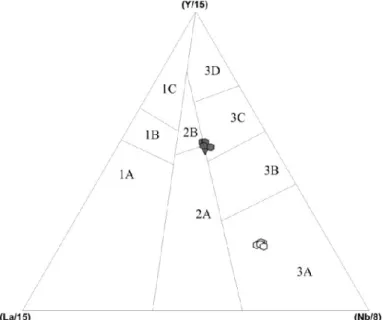
In the La-Y-Nb (Cabanis and Lecolle, 1989; Fig. 5.22) discrimination diagram, alkaline rocks clearly plot in the fields of basalts from intercontinental rift and a within-plate tectonic setting is also suggested by the Ti/V and Nb/Y ratios (Fig. 5.23; 5.24).
On the contrary, tholeiitic rocks from western Sicily show affinity with weakly enriched MORB, compatible with different rift-related settings. However, the Ti/V ratio clearly indicate a within-plate geodynamic context that could imply the involvement of an enriched sub-continental lithospheric mantle source.
Fig. 5.22: La-Y-Nb discrimination diagram (Cabanis and Lecolle, 1989). 1A: calc-alkali basalts; 1C: volcanic-arc tholeiites; 1B: is an area of overlap between 1A and 1C; 2A: continental basalts; 2B:
back-arc basin basalts; 3A:alkali basalts from intercontinental rift; 3B, 3C: E-type MORB (3B enriched, 3C weakly enriched) 3D: N-type MORB.
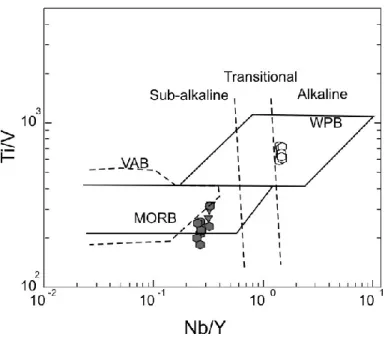
94 Fig. 5.23: Ti/Y vs. Nb/Y diagram (Pearce, 1982). WPB, within plate basalts; MORB, mid-ocean ridge
basalts; VAB, volcanic arc basalts.
Fig. 5.24: Ti-V diagram (Shervais, 1982). E-MORB: enriched MORB; MORB/IAT: mid-oceanic ridge basalt/island arc tholeiite; N-MORB: normal MORB; WPB: within-plate basalts.