Seismicity supports the theory of incipient
rifting in the western Ionian sea,
central Mediterranean
Debora Presti
Department of Mathematics, Computer Sciences, Physics, and Earth Sciences, University of Messina, Italy
Article history: received October 23, 2019; accepted December 6, 2019
Abstract
The present work focuses on earthquake locations and seismogenic stress in the eastern offshore of Sicily, a sector of the central Mediterranean region where geophysical information available is not good enough, yet, for proper geodynamic modeling. I have applied to an updated seismic database of the study area a Bayesian non-linear hypocenter location method already proven to be more effective than linear methods when the recording network geometry is poor, like in the present case. Then, I have selected from literature and official catalogs the local earthquake focal mechanisms computed by waveform inversion, and inverted them for stress tensor orientations. The results confirm the main finding of the previous investigations, i.e. that NW-trending convergence between Africa and Eurasia is a main source of tectonic stress in this area, however they also furnish evidence of additional tectonic factors locally acting together with convergence. In particular, extensional dynamics are detected inside the convergence-related compressional domain: these are characterized by a minimum compressive stress oriented SW-NE (perpendicular to convergence) and can be related to the rifting process (opening SW-NE) detected by previous investigators at the southwestern edge of the Ionian subduction slab. The findings of the present study may also concur to answer several open questions left by previous investigators.
Keywords: Earthquake source and dynamics; Stress; Geodynamics; Inverse methods.
1.
Introduction
The western Ionian sea (Figure 1) is one of the sectors of the Italian region where geophysical network monitoring is poorest because of the absence of islands and the nearly total lack of sea bottom equipment. Previous seismological and geodetic investigations [D’Agostino et al., 2011; Presti et al, 2013; Totaro et al., 2016] have evidenced the limitations of information available in this area with respect to the nearby on-shore areas of Sicily and Calabria. These limitations contribute to leave open several questions concerning the geometry, kinematics and dynamics of plates/microplates in the south-central Mediterranean region. As explained in the next Section, different views still exist concerning lithosphere fragmentation and kinematics in this portion of the Africa-Eurasia convergent margin (Figure 1). In the present study, I use an updated set of earthquake data and proper methods of analysis with the purpose of deepening the knowledge available on seismic strain and seismogenic stress distributions in the western Ionian: this sector is of crucial relevance for the solution of some still existing uncertainties in the regional geodynamics [see, e.g., Serpelloni et al., 2007; D’Agostino et al., 2008; Palano et al., 2012; Nocquet, 2012; Neri et al., 2018].
Figure 1. (a) Simplified map of the Africa-Eurasia plate boundary. Black arrows indicate the present-day sense of motion of Africa with respect to Eurasia according to Palano et al. (2015a). Abbreviations: AP=Apennines, CA=Calabrian Arc, MA=Magrhebides. The dashed rectangle including southern Italy and relative off-shore sectors indicates the tectonic map area (plot c). (b) Sketch map of the portion of the Apennines-Maghrebides subduction system of southern Italy. The solid curve with the sawtooth pattern indicates the present location of the Calabrian Arc subducting system. The sawtooth points in the direction of subduction. According to Neri et al. (2009), black sawteeth indicate continuous subducting slab, white sawteeth indicate the plate boundary segments where slab detachment has already occurred. Thick grey segments indicate the STEP fault zones (SFZ) according to Neri et al. [2012]. The white arrow shows the sense of the subducting slab rollback. Dashed lines are depth contour lines of the Wadati-Benioff zone (Faccenna et al., 2011). (c) Tectonic map of southern Italy and relative off-shore areas (redrawn from Palano et al., 2012, with integration of data in the Ionian Sea according to Polonia et al., [2011]. TFS stands for Tindari Fault System.
2.
Geodynamic frame of the study region
The westernmost Ionian sea is a peculiar zone of the Africa-Eurasia plate margin where plate convergence coexists with very slow trench retreat of the residual subduction slab of Calabrian Arc (Figure 1a). After a long period between Late Paleogene and Neogene of Africa NW-ward subduction beneath Eurasia, subduction has almost ceased [Billi et al., 2011] and today only a narrow remnant of the former subducting slab seems to be still active beneath the Calabrian Arc (Figure 1b) [Neri et al., 2009; 2012; Minelli and Faccenna, 2010; Orecchio et al., 2015; Chiarabba and Palano, 2017].
To the east of the seismically active Tindari Fault System in northeastern Sicily (TFS in Figure 1c), both earthquakes and GPS data provide evidence for extensional tectonics possibly connected with residual subduction and related back-arc extension alano et al., 2015b). West of the Tindari Fault System (Figure 1c), contractional earthquakes recorded in the last decades in the west-east belt between Ustica and the Aeolian islands [Pondrelli et al., 2004; Billi et al., 2007; Presti et al., 2013; Palano et al., 2015b; Orecchio et al., 2017] mark accommodation of the plate convergence process at the longitude of central and western Sicily.
A quite recent analysis of different geophysical data (gravity anomalies, seismotomographic structure and seismicity of crust and uppermost mantle) has led Neri et al. [2012] to propose that the subducting slab is still continuous over depth only beneath the central part of Calabrian Arc (southern Calabria; Figure 1b). According to the same authors, detachment of the deepest portion of the old subducting lithosphere has already occurred beneath the Arc edges, i.e. beneath Northern Calabria and Northeastern Sicily. The sinking oceanic lithosphere, narrowed after slab breakoff on either side of the Arc, promoted the initiation of lateral tears [or Subduction-Transform Edge Propagator (STEP) faults, Govers and Wortel, 2005]. In northern Calabria (Figure 1b), a present-day STEP fault activity at the northern slab edge has been inferred by seismic data [Orecchio et al., 2015; Milia et al., 2017]. The southern edge of the slab (Figure 1b) falls in the western Ionian Sea in correspondence with a NW-striking deformation belt [Argnani, 2009, Polonia et al, 2011, Gallais et al. 2013; Palano et al., 2015b].
The western Ionian offshore Sicily is a crucial zone to observe transition between the western convergent domain where subduction ceased and the Calabrian Arc residual subduction zone. Present-day strain distributions in the western Ionian are not still fully understood. D’Agostino et al. (2008) interpreted their GPS and earthquake slip data assuming the existence of a microplate including the Apulia promontory, the Ionian sea and the Hyblean plateau in southern Sicily (light gray in Figure 2a). According to these authors, the hypothesis of Hyblean area belonging to such a microplate would be supported by apparently low GPS-derived deformation in the western Ionian. In any case the authors admit that lack of data in the Ionian offshore of Sicily does not allow decisive checking of their hypothesis. By analysis of a relatively long period of 18 years of GPS observations, Palano et al. (2012) advanced the hypothesis of an Hyblean block independent with respect to Africa and Apulia (Figure 2b-c). They discussed the role played by the Ionian domain and suggested two possible scenarios, one assuming that the Ionian is rigidly connected with the Hyblean block (Figure 2b), the other assuming that the Ionian domain diverges from the Hyblean block (Figure 2c). They concluded that the lack of islands (i.e. of data) in the Ionian does not allow to make a choice among these scenarios. Palano et al. [2012] work further supports the doubts advanced in the early work of Serpelloni et al. [2007]: these authors (i) imputed to the lack of GPS data and poor seismic network geometry in the Ionian the difficulty of detecting microplate contours in this region and (ii) left open the question “where strain locates between Hyblean and Apulia domains?”. Concerning tectonic stress distributions in the western Ionian, the most advanced studies are based on analysis of earthquake P and T axes [Montone et al., 2012, Montone and Mariucci 2016] and stress inversion of focal mechanisms [Totaro et al., 2016]: these studies converge on the thesis of a western Ionian compressional domain under NNW-trending convergence between Africa and Eurasia plates.
By integration of multibeam, seismic reflection, magnetic and gravity data collected in the western Ionian, Polonia et al. [2016, 2017] concluded that: (i) tearing at the southwestern edge of the SEward-retreating Ionian subduction slab may be the deep source of shallow deformation detected in correspondence of the transtensional Ionian Fault System in the Ionian basin (Figure 1c); (ii) the NW-SE trending belt comprised between the Ionian and the Alfeo-Etna Fault Systems (Figure 1c) hosts a rifting zone opening SW-NE where serpentinite diapirs can be identified. On their hand, Gutscher et al. [2017], by analysis of multi-beam bathymetric data and seismic profiles, proposed the Alfeo-Etna Fault System as shallow tectonic expression of the retreating slab tear or STEP fault. Another major fault system marking transition between the Ionian basin and the Hyblean plateau, e.g. the Malta Escarpment (Figure 1c), shows not to be currently active along most of its length, highlighting recent faulting only in its northernmost segment [see, e.g., Argnani, 2009; Gutscher et al., 2016].
Figure 2. Tectonic units and their presumed kinematics in the study area according to previous investigators: (a) Adria and Apulia-Ionian-Hyblean blocks according to D’Agostino et al. [2008]. (b-c) The two alternative scenarios proposed by Palano et al. [2012]: (b) the Ionian domain is rigidly connected with the Sicilian-Hyblean-Malta block; (c) the Ionian domain diverges from the Sicilian-Hyblean-Malta block and moves together with the Calabrian block.
3.
data, methods of analysis and results
3.1
Earthquake space distributions
The Figure 3a shows the earthquakes of local magnitude over 2.5 occurring between 1985 and 2018 at depths less than 70 km in the calabro-sicilian region, according to the Italian national seismic database (http://istituto.ingv.it/l-ingv/archivi-e-banche-dati/). Hypocenter locations of the used database are estimated with a 1-D velocity structure of all Italy, which is a reasonable approach for bulletin activity. I use these locations here (i) to furnish an introductory overall view of seismicity in the study region and (ii) as starting data for more accurate locations to be performed in the sector of our greatest interest in the present study (shadowed internal rectangle).
I have focused my attention on the western Ionian because, as explained in the previous Sections, the geophysical knowledge in this offshore sector is still relatively poor and its exploration can be decisive for answering several open geodynamic questions in the region. I have relocated the hypocenters of earthquakes of the shadowed sector of Figure 3a, after integration of P- and S-wave readings of the Italian database with those available from databases of local seismic networks operating in Sicily and Calabria during 1985-2001 [Orecchio et al., 2011]. For hypocenter relocations, I have selected the events for which a minimum of 12 P+S arrival times were available, and used the Bayesian non-linear location algorithm named Bayloc [Presti et al., 2004, 2008]. As well known from the literature [Lomax et al. 1998, 2000; Lomax and Michelini, 2001; Husen and Smith, 2004; Presti et al. 2004, 2008; Lippitsch et al., 2005; among others], the non-linear probabilistic location methods furnish more accurate estimates of hypocenter locations and relative errors compared to linearized methods when the network geometry is not optimal: this is the situation of our offshore study sector (Figure 3b). Starting from seismic phase arrival times at the recording stations, Bayloc computes for an individual earthquake a probability cloud marking the hypocenter location uncertainty. Then, Bayloc estimates the spatial distribution of probability relative to a set of earthquakes by summing the probability densities of the individual events. This method has been shown to help detection of seismogenic structures through better hypocenter location and more accurate estimation of location errors compared to linearized methods [Presti et al., 2008].
Figure 3. Section (a) displays the epicentral map of earthquakes of magnitude over 2.5 that occurred between 1985 and 2018 at depths less than 70 km in the area 12°-19°E 36°-40°N, according to the Italian national seismic database (http://istituto.ingv.it/l-ingv/archivi-e-banche-dati/). Circles are proportional to the earthquake magnitude (see legend). The gray rectangle indicates the main area of interest in the present study. Section (b) displays the map of seismic stations used for hypocenter locations in the present study.
Bayloc’s locations have been performed in a 3D velocity structure estimated for the study region by Orecchio et al. (paper in preparation) who applied the method used by Orecchio et al. [2011] and previously proposed by Waldhauser et al. [1998, 2002]. This method is based on: (i) integration of different types of velocity data available from the literature (seismic profiles, earthquake tomography, surface wave inversion, Moho depth maps, etc.); (ii) LET inversion where this is allowed by the available P- and S-wave arrival data. Velocity data from literature were taken from Kennet et al. [1995], Tesauro et al. [2008], Orecchio et al. [2011, and references therein], Neri et al. [2012], Scarfì et al. [2018]. The 3D velocity structure used here for hypocenter locations covers the depth range 0-300 km in the whole area concerned by seismic rays travelling from hypocenters of the study sector to recording stations (Figure 3b).
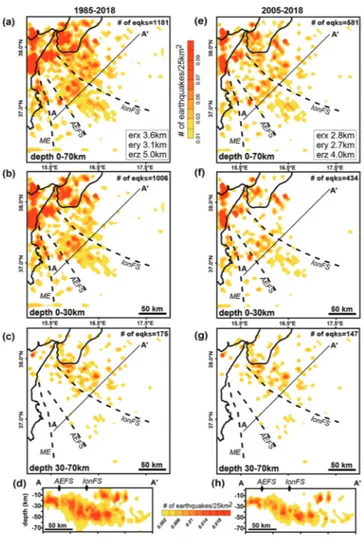
Epicenter distributions relative to different hypocentral depth ranges and a SW-NE vertical section of hypocenters computed by Bayloc for earthquakes occurring during 1985-2018 in the study area are displayed in Figure 4 (a-d). Epicenter and hypocenter errors of the order of 3 km and 5 km, respectively, have been estimated. The Figure 4 (e-h) displays the epicenter and hypocenter locations obtained for the sub-set of earthquakes occurring between 2005 and 2018. In this case, slightly lower average values of epicenter and hypocenter errors (of the order of 3 and 4 km, respectively) are estimated.
Figure 4. Epicentral maps and vertical sections obtained by the Bayloc probabilistic location method for the earthquakes occurring in the western Ionian during 1985–2018 (plots a to d) and 2005-2018 (plots e to f). The depth range investigated and the number of earthquakes located are reported in the lower-left corner and in the upper-right corner of each map, respectively. The earthquake location uncertainty is reported in the lower-right corner of plots (a) and (e). Main fault systems are traced by dashed segments (ME= Malta Escarpment, AEFS=Alfeo-Etna Fault System, IonFS= Ionian Fault System). Plots (d) and (h) show the hypocentral vertical sections along the AA′ profile indicated in the maps, +- 70 km around the profile.
3.2
Seismogenic stress inversion
With the purpose of analyzing seismic faulting styles and related tectonic stress in the area of interest of the present study, I have collected from literature and international catalogs the waveform-inversion focal mechanisms of the earthquakes occurring in the area of Figure 4. I have limited the selection to seismic events of magnitude over 2.5 occurring in the period 1977-2018 at depths less than 70 km. The map of these focal mechanisms is shown in Figure 5, the list of their parameters is furnished in Table 1.
Data (yyyymmdd) O.T. Lon (°N) Lat (°E) Depth (km) Strike (°) Dip (°) Rake (°) M Source 19780311 19:20:49 16.03 38.1 15 270 41 -72 5.2 Italian CMT 19870813 07:22:10 15.06 37.9 35.9 352 42 -10 4.8 Italian CMT 19970325 00:46:14 16.03 36.93 33 104 78 179 4.5 Italian CMT 19990214 11:45:54 15.06 38.17 33 18 39 -108 4.7 Italian CMT 20010422 13:56:36 15.1 37.72 10 316 56 27 4.2 Italian CMT 20010526 06:02:20 16.34 37.46 33 71 54 134 4.5 Italian CMT 20021027 02:50:26 15.16 37.79 10 320 60 171 4.9 Italian CMT 20021027 07:32:09 15.18 37.92 10 67 54 19 4.5 Italian CMT 20021029 10:02:22 15.27 37.67 10 316 61 -173 4.7 Italian CMT 20021029 16:39:48 15.56 37.69 10 207 54 -28 4.2 Italian CMT 20041011 07:31:41 15.48 37.88 6.6 89 90 -45 3.6 D’Amico&al.(2010) 20041022 21:10:13 15.32 38.08 10.7 78 61 -37 3.4 D’Amico&al.(2010) 20050419 22:36:23 15.66 38.14 7.1 220 42 -10 3.1 D’Amico&al.(2010) 20050423 19:10:48 15.82 38.43 13.6 120 50 -64 2.8 D’Amico&al.(2010) 20050818 22:02:27 15.12 37.8 6.7 82 50 -18 3.1 D’Amico&al.(2010) 20051030 19:09:47 15.93 38.53 22 241 66 -84 3.4 Li&al.(2007) 20060227 04:34:01 15.2 38.15 9 62 50 -71 4.1 D’Amico&al.(2010) 20060227 09:11:59 15.18 38.14 10.5 39 48 -90 3.1 D’Amico&al.(2010) 20060227 14:16:06 15.18 38.14 9.1 76 48 -58 3.1 D’Amico&al.(2010) 20060423 14:42:38 15.02 37.04 24 100 88 147 3.9 TDMT 20060530 11:30:40 16.52 37.63 46 347 85 0 4.5 RCMT 20060702 17:52:00 15.1 38.13 10 70 59 -49 2.6 D’Amico&al.(2010) 20060718 07:42:40 15.17 38.12 9.1 90 41 -48 3.1 D’Amico&al.(2010) 20060730 09:53:36 16.31 37.99 6 292 64 -7 2.7 Orecchio&al.(2014) 20060830 22:45:03 15.72 37.32 30 190 64 -23 3.1 Orecchio&al.(2014) 20061006 21:16:23 15.57 38.1 9.6 18 52 -90 3.2 D’Amico&al.(2010) 20061104 05:59:22 15.01 38.03 10.6 59 49 -36 3 D’Amico&al.(2010) 20061124 04:37:40 15.76 36.26 11 188 82 0 4.4 Italian CMT 20070615 22:56:01 15.29 36.97 18 12 87 20 3.6 TDMT 20070617 12:11:58 15.79 38.37 10 262 38 -43 2.9 D’Amico&al.(2010) 20070818 14:04:07 15.17 38.22 12 44 50 -23 3.9 D’Amico&al.(2010) 20070818 14:21:11 15.12 38.19 10 26 69 18 3.4 D’Amico&al.(2010) 20070913 15:19:52 15.16 38.25 8 246 82 -60 2.9 Totaro&al.(2016) 20080209 07:46:36 15.56 37.84 6.9 40 90 -10 3 D’Amico&al.(2010) 20080221 05:00:09 17.97 37.82 30 333 27 134 4.7 Italian CMT
Data (yyyymmdd) O.T. Lon (°N) Lat (°E) Depth (km) Strike (°) Dip (°) Rake (°) M Source 20080413 13:06:57 15.7 38.25 14.3 6 47 -36 2.8 Orecchio&al.(2014) 20080501 21:05:49 15.07 37.8 2 97 76 -2 2.8 D’Amico&al.(2010) 20080513 21:28:30 15.06 37.8 12 76 46 -20 3.5 D’Amico&al.(2010) 20080705 17:04:36 15.87 38.2 2 311 59 2 2.6 D’Amico&al.(2010) 20080813 13:39:30 16.42 37.48 34 181 71 11 3.2 Orecchio&al.(2014) 20080901 14:45:40 15.06 37.97 8.1 70 31 -80 3.1 D’Amico&al.(2010) 20080902 09:16:45 15.06 37.99 10.3 279 64 -44 3.3 D’Amico&al.(2010) 20080902 21:57:20 15.69 38.25 34 351 72 -65 3.1 Orecchio&al.(2014) 20081024 18:47:54 16.47 38.59 28 323 38 -24 3.4 Orecchio&al.(2014) 20081027 10:55:55 15.13 38.11 2 50 28 -71 3.5 D’Amico&al.(2010) 20081102 06:46:44 16.49 37.64 40 141 67 -79 3.6 Orecchio&al.(2014) 20090205 14:50:14 16.03 37.39 28 167 78 18 3.3 Orecchio&al.(2014) 20090316 00:28:06 15.96 37.67 28 34 60 -24 3 Orecchio&al.(2014) 20090427 09:42:16 15.08 38.07 30 69 78 -19 3.6 Presti&al.(2013) 20090701 17:58:54 15.01 38.34 2 40 90 19 3.1 Presti&al.(2013) 20090727 22:15:14 15.69 37.12 30 353 48 -13 3.2 Orecchio&al.(2014) 20090804 16:17:16 15.71 37.12 18 22 73 -13 3.6 Orecchio&al.(2014) 20090829 06:55:17 15.47 37.92 8 56 80 -47 2.9 Orecchio&al.(2014) 20091012 20:07:49 15.96 37.23 30 204 82 12 3.4 Orecchio&al.(2014) 20091125 06:20:07 16.45 38.05 16 341 62 -43 3.2 Orecchio&al.(2014) 20091219 09:01:19 15.09 37.76 40 112 44 176 4.4 Italian CMT 20100402 20:04:47 15.11 37.76 2 274 55 10 4.2 Italian CMT 20100606 16:49:53 15.11 38.27 10 237 82 -34 3.5 Presti&al.(2013) 20100910 19:19:48 16.21 38.54 26 198 53 -60 3.3 Orecchio&al.(2014) 20100910 21:39:20 15.82 38.2 28 204 69 -70 3.2 Orecchio&al.(2014) 20101008 17:26:58 16.33 36.91 38 190 79 17 3.6 Orecchio&al.(2014) 20101127 08:45:49 15.64 38.08 38 332 22 -12 3.7 Orecchio&al.(2014) 20110426 21:02:30 15.16 38.15 2 33 40 -90 3.2 Totaro&al.(2016) 20110503 22:24:52 16.68 37.78 36 323 49 -41 3.6 Orecchio&al.(2014) 20120226 16:17:23 16.01 37.31 36 338 70 -40 3.7 Polonia&al.(2016) 20120324 20:34:59 15.88 37.59 32 158 84 -9 3.1 Polonia&al.(2016) 20120412 13:20:28 15.62 37.89 10 319 90 81 3.1 Polonia&al.(2016) 20120615 06:27:25 16.29 37.45 38 190 80 7 3.8 Polonia&al.(2016) 20120625 10:52:51 15.05 37.01 18 164 77 -16 3.2 Totaro&al.(2016) 20120627 01:14:20 15.03 37 4 182 90 3 3.5 Totaro&al.(2016) 20120627 01:20:59 15.03 36.99 4 10 81 -3 2.9 Totaro&al.(2016) 20120627 02:48:02 15.03 37 4 172 90 -6 2.9 Totaro&al.(2016) 20120704 11:12:12 16.87 37.69 40 186 74 3 4.6 RCMT 20120726 14:20:03 16.34 37.9 16 134 83 -19 3.1 Polonia&al.(2016) 20120828 23:12:15 15.71 38.25 45.4 130 10 -18 4.6 present work 20130303 23:39:13 15.83 38.13 8 237 57 -82 3.3 Totaro&al.(2016) 20130324 15:47:22 16.5 37.76 30 257 87 178 4.6 RCMT 20130402 01:10:52 15.59 37.79 12 219 85 -10 2.9 Totaro&al.(2016) 20131007 04:44:05 15.08 38.13 6 84 63 -29 2.8 Totaro&al.(2016)
Table 1. Database of earthquake focal mechanisms of western Ionian Sea and surroundings reported in Figure 5a. O.T., Lon, Lat, Depth are the GMT origin time, the longitude, the latitude and the focal depth of the earthquake, respectively. Strike, dip, and rake are the fault parameters of the focal solution. M is the earthquake magnitude. Source is the bibliographic source of the solution (Italian CMT = http://rcmt2.bo.ingv.it/Italydataset.html, CMT = http://www.globalcmt.org/, RCMT= http://rcmt2.bo.ingv.it/, TDMT = http://cnt.rm.ingv.it/tdmt; the other sources are reported in the reference list at the end of the article).
Data (yyyymmdd) O.T. Lon (°N) Lat (°E) Depth (km) Strike (°) Dip (°) Rake (°) M Source 20131009 08:14:49 15.09 37.61 4 33 81 8 2.9 Totaro&al.(2016) 20131009 08:33:22 15.07 37.61 10 258 90 1 3.2 Totaro&al.(2016) 20131223 04:20:39 15.57 38.22 2 31 61 -60 3.5 Neri&al.(2014) 20131223 16:17:11 15.04 38.18 16 113 63 -33 3.1 Totaro&al.(2016) 20140102 06:13:18 15.04 38.18 12 103 38 8 3 Totaro&al.(2016) 20140219 06:58:05 15.11 38.17 8 34 62 17 3 Totaro&al.(2016) 20140323 18:31:52 16.48 37.47 38 177 61 21 3.6 Totaro&al.(2016) 20140417 21:52:26 15.21 38.23 2 12 90 2 2.8 Totaro&al.(2016) 20140517 22:38:44 15.61 37.41 30 191 78 -38 3.1 Totaro&al.(2016) 20140607 15:00:49 15.1 38.09 10 285 73 7 3.7 Neri&al.(2014) 20140607 15:13:20 15.1 38.08 10 238 39 -49 2.6 Totaro&al.(2016) 20140724 01:12:51 15.02 38.09 30 100 90 -16 3.2 Totaro&al.(2016) 20140926 23:38:11 16.5 36.78 40 267 75 170 4.2 RCMT 20141010 16:16:18 15.14 38.09 34 60 90 -76 3.1 Totaro&al.(2016) 20141010 16:27:13 15.14 38.09 30 349 72 -31 2.8 Totaro&al.(2016) 20141025 20:09:48 15.95 38.17 15 275 68 -79 3.3 TDMT 20141116 12:38:42 15.08 38.24 6 276 84 1 2.8 Totaro&al.(2016) 20150120 07:17:22 15.57 38.11 18 199 38 32 3.3 Totaro&al.(2016) 20150208 19:39:22 15.22 37.35 22 87 52 -50 3.1 Totaro&al.(2016) 20150312 15:29:04 16.23 38.43 2 230 59 -78 3.3 Totaro&al.(2016) 20150328 22:07:51 16.21 38.09 20 233 79 79 3.1 Totaro&al.(2016) 20150329 10:48:46 16.21 38.09 12 52 76 -83 3.5 Totaro&al.(2016) 20150420 01:07:43 15.12 37.8 3 178 83 -164 3.5 TDMT 20150430 05:35:21 15.39 37.86 26 160 61 44 2.9 Totaro&al.(2016) 20150511 08:26:32 16.8 37.33 40 184 62 20 4.5 RCMT 20150511 08:26:30 16.79 37.18 44 187 69 -9 4.2 present work 20150524 06:00:00 16.03 37.96 62 23 62 -3 4.1 present work 20150715 16:29:49 15.05 37.62 10 214 90 -11 3 Totaro&al.(2016) 20150801 02:46:51 15.86 37.64 42 195 90 9 3.4 Totaro&al.(2016) 20150803 13:52:37 16.14 37.39 38 205 59 1 3.6 Totaro&al.(2016) 20150806 01:59:43 15.19 38.24 8 214 76 -61 3.1 Totaro&al.(2016) 20150920 22:27:58 15.61 37.16 30 226 58 -2 3.8 Totaro&al.(2016) 20160306 08:12:36 16.74 38.2 39 248 75 158 4 TDMT 20170921 04:28:10 15.12 38.28 21 139 88 167 3.2 TDMT 20181002 02:16:17 15.76 38.22 17 38 63 -42 3.7 TDMT 20180602 07:40:54 15.15 37.71 8 247 86 168 3.4 TDMT 20180928 05:24:31 15.73 38.39 11 45 53 -112 4 TDMT 20181224 12:08:55 15.04 37.72 2 194 86 14 3.8 TDMT 20181226 02:19:14 15.12 37.64 0 306 88 4.9 TDMT
In the dataset of Figure 5 and Table 1, the focal mechanisms computed by the CAP method [Li et al., 2007; D’Amico et al., 2010; 2011; Presti et al., 2013; Orecchio et al., 2014; Polonia et al., 2016; Totaro et al., 2016] are affected by errors of the order of 8-10 degrees. The literature and the bibliographic sources of the other focal mechanisms of Figure 5 and Table 1 indicate that these are typically characterized by fault parameter errors of the order of 10-15 degrees [see, e.g., Helffrich, 1997; Frohlich and Davis, 1999; Pondrelli et al., 2006; Hjörleifsdóttir and Ekstrom, 2010]. Then, the fault parameter errors of the solutions displayed in Figure 5 are, in general, smaller than those of focal mechanisms computed by inversion of P-onset polarities in areas of critical network geometry like ours [D’Amico et al., 2011; Presti et al., 2013; Scarfì et al., 2013; Musumeci et al., 2014]. The overall level of uncertainty of focal mechanisms of the dataset of Figure 5 makes it suitable for application of the method by Gephart and Forsyth [1984] for calculating seismogenic stress directions in the study region (Figure 5a-d). This method searches for the stress tensor showing the best agreement with the available focal mechanisms (FMs). Four stress parameters are calculated: three of them define the orientations of the main stress axes; the other is a measure of relative stress magnitudes, R = (𝜎2-𝜎1)/(𝜎3-𝜎1), where 𝜎1, 𝜎2 and 𝜎3 are the values of the maximum, intermediate and minimum compressive stresses, respectively. In order
to define discrepancies between the stress tensor and observations (FMs), a misfit variable is introduced: for a given stress model, the misfit of a single focal mechanism is defined as the minimum rotation about any arbitrary axis that brings one of the nodal planes, and its slip direction and sense of slip, into an orientation that is consistent with the stress model. Searching through all orientations in space by a grid technique operating in the whole space of stress parameters, the minimum sum of the misfits of all FMs available is found. The confidence limits of the solution are computed by a statistical procedure described in the papers by Parker and Mc Nutt [1980] and Gephart and Forsyth [1984]. The size of the average misfit corresponding to the best stress model provides a guide as to how well the assumption of stress homogeneity is fulfilled [Michael, 1987]. In the light of results from a series of tests carried out by Wyss et al. [1992] and Gillard et al. [1996] to identify the relationship between FM uncertainties and average misfit in the case of uniform stress, I will make the following assumptions. I assume that the condition of homogeneous stress distribution is fulfilled if the misfit, F, is smaller than 6°, and that it is not fulfilled if F>9°. In the range 6°<F<9°, the solution is considered as acceptable, but may reflect some heterogeneity.
The advantage of using Gephart and Forsyth’s [1984] method instead of other more recent stress inversion methods [such as, for example, Arnold and Townend, 2007; Vavrycuk, 2014; Karagianni et al., 2015] is that the former is more conservative concerning the relative orientation of seismogenic stress and seismic dislocation surface. In this connection, caution is appropriate in the present study because I do not make any assumption here concerning the date of formation of the faults which generated the earthquakes of the dataset. The tectonic stress orientation may have changed since the date of formation of the fault producing the study earthquake, therefore I must consider a relatively wide range of possible angles between the today-acting stress and the fault surface. This more conservative approach is better represented by the method of Gephart and Forsyth [1984]. The effectiveness of this method in several conditions, also compared to more recent methods, is well documented in the literature [see Hardebeck and Hauksson, 2001; Maury et al., 2013; Karagianni et al., 2015; among others].
I report in Figure 6 a synthetic test showing the different results obtained by application of the methods by Gephart and Forsyth [1984], Vavrikuk [2014] and Arnold and Townend [2007]. The Figure 6a shows the basic focal mechanisms used for the test. The section (b) of the figure shows a synthetic dataset obtained from the focal mechanisms of section (a), based on generation of 20 strike-slip, 5 reverse and 15 normal faulting mechanisms by random perturbation of the basic mechanisms of (a). The sections (c) to (e) of the same figure display the stress inversion results obtained for the dataset of section (b) by the above mentioned methods. The solution obtained by Gephart and Forsyth (1984) exhibits quite large confidence limits of stress orientations (Figure 6c), well representing the coexistence of compressive and extensional actions in the dataset of Figure 6b. The confidence limits are quite smaller in the case of inversion made by Vavrikuk [2014] (Figure 6d): this method tends to highlight the prevailing stress tensor (compressional) even if it is only slightly prevailing (25 mechanisms out of 40). The Arnold and Townend [2007] method furnishes average stress orientations (Figure 6e) with small confidence areas contrasting with the high misfit value of 10.8°. As discussed later on in this paper, the test of Figure 6 helps also finding a key of lecture of the results obtained by inversion of real earthquake focal mechanisms, displayed in Figure 5 and Table 2.
Figure 5. Plot (a) displays the fault-plane solutions of earthquakes of magnitude over 2.5 occurring in the period 1977-2018 at depths less than 70 km in the area contoured by the internal rectangle in Figure 2. Only solutions estimated by waveform inversion are reported. The main parameters and the bibliographic source of each solution are given in Table 1. The different colors in the figure identify different types of mechanisms following Zoback’s [1992] classification based on values of plunges of P and T axes: red = normal faulting (NF) or normal faulting with a minor strike-slip component (NS); green = strike-slip faulting (SS); blue = thrust faulting (TF) or thrust faulting with a minor strike-slip component (TS); black = unknown stress regime (U). “U” includes all focal mechanisms that do not fall in the other five categories [Zoback, 1992]. The beach ball size is proportional to the earthquake magnitude (see legend). In the lower-right corner is reported the orientation of the principal stress axes (lower hemisphere stereographic projection) obtained by inversion of the earthquake focal mechanisms shown in map. Red, green, and blue dots indicate the orientations of the maximum (𝜎1), intermediate (𝜎2), and minimum (𝜎3) compressive stresses, respectively. Crosses and squares indicate the 95% confidence areas for the 𝜎1 and 𝜎3 axes, respectively. F is the average of the individual earthquake misfits with respect to the best model of stress found by inversion (see text); n is the number of focal mechanisms used for stress inversion. Plots b and c shows the orientation of the principal stress axes obtained by inversion of the earthquake focal mechanisms shown in map (same symbols as in plot a). The plot c shows the stress inversion results obtained in the sector between Alfeo Etna Fault System (AEFS) and Ionian Fault System (IonFS), where Polonia et al. [2017] have identified a rifting process with opening in the SW-NE direction, approximately. Plot d shows the orientation of the principal stress axes obtained by inversion of the earthquake focal mechanisms shown in map, i.e. same sector of plot c, depth range 30-70km. See Table 2 for numerical values of stress inversion results.
Table 2. Stress tensor inversion of earthquake focal mechanisms performed for the earthquake sets indicated in Figure 5 and described in the text. N is the number of earthquakes (= focal mechanisms) belonging to the inversion set. F is the average of the misfits of the individual earthquakes with respect to the best model of stress found by inversion. R is the amplitude ratio (𝜎2−𝜎1)/(𝜎3−𝜎1) where 𝜎1, 𝜎2, and 𝜎3 represent the amplitudes of the maximum, intermediate and minimum compressive stress, respectively. Pl and Az are the plunge and azimuth, respectively, of the three main stress axes.
Figure 6. Synthetic test showing the different results obtained by application of the stress inversion methods by Gephart and Forsyth [1984], Vavrikuk [2014] and Arnold and Townend [2007]. Plot (a) shows basic focal mechanisms used for the test. Plot (b) displays the synthetic dataset obtained by random perturbation of the basic focal mechanisms of plot (a), based on generation of 20 strike-slip, 5 reverse and 15 normal faulting mechanisms. Plots (c) to (e) display the stress inversion results obtained for the dataset of plot (b) by using the stress inversion methods by Gephart and Forsyth [1984], Vavrikuk [2014] and Arnold and Townend [2007], respectively.
Set N F (°) R 𝛔1 Pl (°) 𝛔1 Az (°) 𝛔2 Pl (°) 𝛔2 Az (°) 𝛔3 Pl (°) 𝛔3 Az (°)
(a) 112 11.3 0.5 74 180 16 355 1 86
(b) 43 8.3 0.3 34 318 54 114 11 220
(c) 27 6.7 0.5 7 146 58 247 31 52
4.
Discussion
In the most recent analysis of regional seismicity and stress fields, Totaro et al. [2016] proposed a geodynamic scheme highlighting extensional processes of the Apennine-Maghrebian chain occurring inside the overall compressional domain due to Africa-Eurasia convergence (see, in particular, the Figure 4 of Totaro et al., 2016]. This scheme matches well with the model by Nijholt et al. [2018] who stated that “the Calabrian arc is now further transitioning towards a setting dominated by Africa-Eurasia plate convergence, whereas during the past 30 Myrs slab retreat continually was the dominant factor”. On the other hand, as discussed in Section 2 of the present paper, space variations of crustal motions measured in the Central Mediterranean region have pushed several investigators to search for opening zones in the broadly compressive domain of the Ionian sea. Relatively poor information available in the western Ionian is the main reason why this debate is still open. With new data and analyses the present study focuses on the crucial zone of the western Ionian with the purpose of furnishing a contribution in this framework.
The Figure 5a and Table 2 (set a) show the results of stress inversion of earthquake focal mechanisms in the study area. The results indicate a high level of stress heterogeneity (F-value of 11.3°) which can be explained in terms of two clearly different domains in the study area: (i) the extensional domain of Calabrian Arc in the northwestern corner of the study area and (ii) the overall compressional one of the remaining part (Ionian sea) imputable to Africa-Eurasia convergence [see also Totaro et al., 2016]. Then, a stress inversion run has been performed considering only the Ionian offshore of Sicily and Calabria, therefore excluding the Calabrian Arc domain (Figure 5b, Table 2 set b). In this case, the F-value of 8.3° marks again a certain level of stress heterogeneity in the dataset, although lower than in the inversion of Figure 5a. This means that the exclusion of the Calabrian Arc extensional domain from the inversion reduces but does not eliminate completely the heterogeneity, i.e. stress is not homogeneous in the Ionian sector usually considered as a compressional domain [Totaro et al., 2016, among others]. Figure 5c and Table 2 (set c) display the results of stress inversion performed in the area of incipient rifting proposed by Polonia et al. [2016, 2017], approximately located between the Alfeo-Etna and Ionian Fault Systems. In this case, the F-value drops to 6.7° that is quite smaller than the values of the larger datasets of Figures 5a and 5b, but still larger than the value of 6° assumed as approximate upper bound of values corresponding to stress homogeneity (see previous Section). Therefore, stress is moderately heterogeneous in the area between the Alfeo-Etna and Ionian Fault Systems. Here, the best model of stress coming from inversion is characterized by a NW-trending, horizontal 𝜎1 matching well with the
direction of convergence of Africa and Eurasia in this part of the plate margin. However, the 95% confidence limits of stress orientations reveal that 𝜎1 orientation is practically unconstrained from horizontal NW-SE to
vertical. This may suggest that some extensional process opening SW-NE acts together with NW-trending plate convergence in this sector.
A close analogy can be noted between the stress confidence limits of Figure 5c (real earthquakes) and those obtained by inversion of synthetic focal mechanisms (Figure 6c). This suggests that the focal mechanisms available between the Alfeo-Etna and Ionian Fault Systems (Figure 5c) may be generated by the action of two different tectonic sources: (i) a compressional stress with 𝜎1 trending SE-NW imputable to Africa-Eurasia
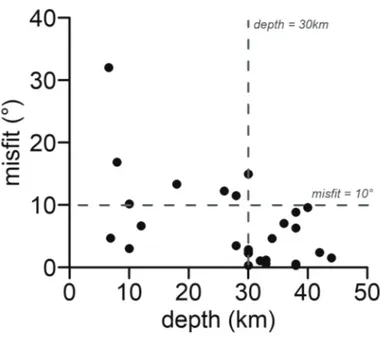
convergence, in agreement with the most recent studies [Montone and Mariucci, 2016; Totaro et al., 2016]; (ii) an extensional stress with SW-NE opening direction which can be plausibly related to the rifting process hypothesized by Polonia et al. [2017]. I have reported in Figure 7 the individual misfits of the earthquakes of Figure 5c with respect to the corresponding stress solution, as a function of focal depth. The best model of stress in 5c is compressional with SE-NW 𝜎1, which recalls regional stress related to Africa-Eurasia
convergence. According to the plot of Figure 7 plate convergence seems to be the only geodynamic process active at depths between 30 and 45 km, approximately. In fact, at these depths, nearly all the individual misfits are lower than 10° (average error of focal mechanisms in the dataset). Conversely, the individual misfits of the earthquakes shallower than 30 km (in half cases exceeding 10°; Figure 7) suggest some degree of stress heterogeneity in the depth range 0-30 km. Based on the information furnished by the plot of Figure 7, I have performed a stress inversion run excluding from the dataset of Figure 5c all the earthquakes shallower than 30 km. The results of this additional run are shown in Figure 5d and Table 2 set d. The value of F (3.3°) and the small confidence limits of stress orientations indicate that stress is homogeneous and well constrained at depths between 30 and 45 km in the sector of Figure 5d. In this framework, the best model of stress
characterized by a NW-SE sub-horizontal 𝜎1, indicates that the action of plate convergence is dominant in this depth range in the area of incipient rifting identified by Polonia et al. [2017]. According to the results of Figure 5c-d and to the plot of Figure 7, the extensional processes associated to rifting are to be confined to the upper ca. 30 km in this area. Unfortunately, the low number of focal mechanisms available above the depth level 30 km (only 10) does not allow a separate stress inversion and this operation has to be postponed to a moment when additional data will be available. It is also worth mentioning that the analysis of the individual misfits of the earthquakes of Figure 5c as a function of magnitude (not reported graphically for conciseness) evidences that all the events of magnitude over 4.0 (maximum magnitude of 4.5) can be imputed to the convergence-related regional stress (misfits less than 10°). On the other hand, the weaker events (magnitude less than 4.0) show in several cases misfits larger than 10°, what means that they in part reflect stress heterogeneities due to more localized processes, such as rifting. In this case, too, the relatively low number of focal mechanisms available does not allow stress inversion of proper subsets partitioned according to earthquake magnitude.
Figure 4a-d displays the locations obtained by Bayloc for the earthquakes of magnitude over 2.5 occurring in the study area between 1985 and 2018. The completeness magnitude of the INGV seismic catalog for this area since 1985 was estimated to be in the order of 2.0-2.5 by Schorlemmer et al. [2003]. By comparing the Bayloc’s epicenter distribution of the earthquakes shallower than 30 km shown in Figure 4b with the structural map of Figure 1, we may note: (i) a certain degree of seismic activity in correspondence with the northern segment of the Malta escarpment, the only considered active in this structural system by several authors [see, e.g., Argnani, 2009; Gutscher et al., 2016]; (ii) a clear belt of seismic activity trending NW-SE between the Alfeo-Etna and the Ionian fault Systems; and (iii) a drop of seismicity going to NE across the Ionian Fault System. In the 30-70 km depth range (Figure 4c) there is no seismicity in correspondence with the Malta escarpment and most of seismic activity is dispersed around the Ionian Fault. The SW-NE vertical section of Figure 4d highlights that seismicity is as shallow as 20 km west of the Alfeo-Etna Fault System, but deepens to depths of the order of 40 km between the Alfeo-Etna and the Ionian Fault Systems, and remains stable at this depth level for several tens of km around the Ionian Fault System. In the same vertical section the presence of seismic activity, although weak, can also be noted in the upper 20 km halfway between the Alfeo-Etna and the Ionian fault systems (AEFS and IFS; Figure 4d). All the features detected in Figure 4a-d can be noted also in the plots of Figure 4e-h reporting the subset of earthquakes occurring between 2005 and 2018, i.e. the information is stable when reducing the time interval of the analysis from 34 to 14 years, what also corresponds to a slight decrease of epicenter and focal depth average errors (values labeled in the plates 4a and 4e).
Previous investigators [see, e.g., Polonia et al., 2011; 2016; Palano et al., 2015b] have proposed that the Ionian fault zone corresponds with the southwestern edge of the Ionian subducting slab dipping to NW and presumably still affected by slow SE-ward residual rollback. The Ionian fault zone would represent the shallow expression of a STEP fault [Polonia et al., 2016]. The above commented epicenter and hypocenter distributions of Figure 4 support this interpretation: earthquake distributions evidence, in particular, that the dislocation processes between the subducting slab (located northeast of the Ionian Fault system) and the adjacent lithosphere (southwest) are distributed over a relatively wide zone, probably because the slab rollback kinematics are slow and do not mimic fast STEP dynamics [Gallais et al., 2013; Orecchio et al., 2014]. The weak earthquake activity detected in the upper 20 km halfway between the Alfeo-Etna and Ionian Fault Systems (Figures 4d-e) occurs in a NW-trending highly fractured zone, site of a rifting process with SW-NE opening direction where serpentinite diapirs rise from deeper depths [Polonia et al., 2017]. This extensional process can be a cause of stress heterogeneity evidenced by stress inversion in the domain of Figure 5c, where SW-NE extension appears to be superimposed to NW-SE compression related to Africa-Eurasia convergence (Figure 8). Earthquake space distribution and stress orientations in the western Ionian are compatible with the geodynamic hypothesis of Polonia et al. [2017] assuming a rifting process near the southwestern edge of the subducting slab. This interpretation appears also to match well with the space variation of GPS vectors in Sicily and Calabria [Figure 8a; vector data from Palano et al., 2012]: these show clear rotation of crustal motions when crossing the onshore prolongation of the NW-trending zone located between the Alfeo-Etna and Ionian Fault Systems.
I look at a future availability of additional data in the study area to explore in a greater detail the local space variations of stress and the contributions by the different tectonic factors. On the other hand, I evidence the new contribution to knowledge of regional geodynamic processes given by the present study in comparison
to the most recent stress inversion analyses carried out in the same area [Totaro et al., 2016]. In fact, although the primary seismogenic role attributed to plate convergence by Totaro et al. [2016] is confirmed here, the use of a more conservative stress inversion method allows me to better detect in the present study the heterogeneity of stress in the study area (see, e.g., Figure 5c). In particular, signatures of a rifting-related extensional component have, here, been detected into the compressional domain produced by plate convergence (Figure 8). According to the results of the present study the effects of rifting would, approximately, be confined to the upper 30 km of the area between the Alfeo-Etna and Ionian Fault Systems (see Figures 5d, 7 and 8b). In this volume, however, the number of focal mechanism data available is not enough for a separate inversion.
The results of the present study may contribute to answer some questions put by previous investigators such as, for example, Serpelloni et al. [2007] (where strain locates between Hyblean and Apulia domains?) or Palano et al. [2012] (is Ionian rigidly connected with the Hyblean block or diverging from it?). Earthquake locations and stress distributions allow stating that (i) the Western Ionian is a main site of strain release between Hyblean and Apulia domains and (ii) the Ionian is not “rigidly connected with the Hyblean block”. Concerning the two alternative scenarios proposed by Palano et al. [2012] and here reported in Figure 2b-c, the results of the present study appear closer to the hypothesis of a Ionian block diverging from the Sicilian-Hyblean-Malta block (Figure 2c). Concerning the question of D’Agostino et al. [2008] whether the assumption of a rigid Apulian-Ionian-Hyblean microplate is correct or not, the results of the present study showing signatures of a rifting process in the Ionian as proposed by Polonia et al. [2017] suggest that D’Agostino et al’s [2008] question was meaningful and the Apulian-Ionian-Hyblean system needs more complex modeling.
Figure 7. Diagram reporting the earthquake individual misfit (with respect to the stress solution) versus focal depth for the earthquakes of Figure 5c. In the depth range 30-45 km nearly all the individual misfits are lower than 10° (approximate average error of focal mechanisms in the dataset). This indicates that plate convergence is likely the only geodynamic process active at these depth levels. A certain degree of stress heterogeneity is revealed by individual misfits at depth shallower than 30 km.
Figure 8. (a) This figure shows the overall compression caused by Africa-Eurasia convergence (black arrows) disturbed by incipient rifting in the westernmost Ionian offshore Sicily [i.e., white diverging arrows between AEFS and IonFS, from Polonia et al., 2017]. Black-to-grey transition of GPS crustal motion vectors marks their clear orientation change from NW-ward to NE-ward and corresponds with the onshore prolongation of the Ionian NW-trending rifting zone [GPS vectors are from Palano et al., 2012]. The grey arrow shows the sense of the subducting slab rollback. (b) Sketch representation of stress distribution along a SW-NE vertical section of the western Ionian area: circles indicate homogeneous compression due to SE-NW plate convergence; ellipses indicate the zone where SW-NE rifting-related extension is superimposed to SE-NW compression. (c) Sketch view of the Calabrian arc subduction zone modified from Polonia et al., [2017]. Extensional processes in the rifting zone between the Alfeo-Etna and Ionian Fault Systems (dotted area) drive serpentinite diapirs rising in correspondence of the tearing slab edge [following Polonia et al., 2017, diapirs are schematically indicated by irregular patches]. Black arrows indicate Africa-Eurasia convergence.
5.
Conclusion
Earthquake relocations and stress inversion of focal mechanisms in the still poorly resolved geodynamic domain of western Ionian lead to the following conclusions: (i) the main finding of previous investigations indicating the primary tectonic action of Africa-Eurasia convergence in this part of the Mediterranean region [Montone et al., 2012, Montone and Mariucci 2016; Totaro et al., 2016] is confirmed; (ii) the level and style of stress heterogeneity detected in the study area furnish, however, evidence of additional tectonic factors acting together with convergence. In this regard, an additional factor can be recognized in the rifting process at the southwestern edge of the subducting slab recently hypothesized by Polonia et al. [2017]. SW-NE opening in the NW-trending belt comprised between the Alfeo-Etna and Ionian Fault Systems would add an extensional stress component to convergence-related compression in the offshore of Eastern Sicily: this is really observed in the plot of stress orientations obtained by inversion of focal mechanisms (Figure 5c). Also, the hypocenter relocations evidence that the dislocation processes between the subducting slab (located northeast of the Ionian Fault System) and the adjacent lithosphere (southwest) are distributed over a relatively wide zone, probably because the subduction kinematics are slow and do not mimic fast STEP dynamics [Gallais et al., 2013; Orecchio et al., 2014]. This wide zone located between the Alfeo-Etna and Ionian Fault Systems (Figures 3d and 4d) corresponds to the NW-trending highly fractured zone of rifting where serpentinite diapirs rise from deeper depths [Polonia et al., 2017]. The stress inversion results of Figure 5c-d and the analysis of earthquake individual misfits in Figure 7 suggest that the seismic effects of rifting are confined to the upper 30 km of the area between the Alfeo-Etna and Ionian Fault Systems (a final sketch of the results into the geodynamic context is given in Figure 8c).
Data and sharing resources. Data used in the present study were collected from the databases of Istituto Nazionale
di Geofisica e Vulcanologia (http://istituto.ingv.it/it/archivi-e-banche-dati) and from catalogs and bibliographic sources indicated in detail in the article.
Acknowledgements This work has been performed in the framework of activity of the Research Unit UNIME of CRUST -
Interuniversity Center for 3D Seismotectonics with territorial applications. I warmly thank Barbara Orecchio and Cristina Totaro for many useful discussions. Some figures were created using Generic Mapping Tools by Wessel and Smith (1991).
References
Argnani, A. (2009). Evolution of the southern Tyrrhenian slab tear and active tectonics along the western edge of the Tyrrhenian subducted slab, Geological Society, London, Special Publications, 311(1), 193-212.
Arnold, R., and J. Townend (2007). A Bayesian approach to estimating tectonic stress from seismological data, Geophys. J. Int., 170(3), 1336-1356.
Billi, A., D. Presti, C. Faccenna, G. Neri, G., and B. Orecchio (2007). Seismotectonics of the Nubia plate compressive margin in the south Tyrrhenian region, Italy: Clues for subduction inception, J. Geophys. Res., 112(B8). Billi, A., C. Faccenna, O. Bellier, L. Minelli, G. Neri, C. Piromallo, D. Presti, D. Scrocca, and E. Serpelloni (2011). Recent
tectonic reorganization of the Nubia-Eurasia convergent boundary heading for the closure of the western Mediterranean, Bull. Soc. Geol. Fr., 182(4), 279–303.
Chiarabba, C., and M. Palano (2017). Progressive migration of slab break-off along the southern Tyrrhenian plate boundary: Constraints for the present day kinematics, J Geodyn., 105, 51-61.
D’Agostino, N., A. Avallone, D. Cheloni, E. D’Anastasio, S. Mantenuto, and G. Selvaggi (2008). Active tectonics of the Adriatic region from GPS and earthquake slip vectors, J. Geophys. Res., 113, B12413, doi:10.1029/2008JB005860.
D’Agostino, N., E. D’Anastasio, A. Gervasi, I. Guerra, M.R. Nedimović, L. Seeber, L. and M. Steckler, M. (2011). Forearc extension and slow rollback of the Calabrian Arc from GPS measurements. Geophys. Res. Lett., 38(17), doi:10.1029/2011GL048270.
moderate earthquakes in the Messina Straits, southern Italy, Phys. Earth Planet. Inter., 179(3-4), 97-106. D’Amico, S., B. Orecchio, D. Presti, A. Gervasi, L. Zhu, I. Guerra, G. Neri, and R.B. Herrmann (2011). Testing the
stability of moment tensor solutions for small earthquakes in the Calabro-Peloritan Arc region (southern Italy), B. Geofis. Teor. Appl., doi:10.4430/bgta0009.
Faccenna, C., P. Molin, B. Orecchio, V. Olivetti, O. Bellier, F. Funiciello, L. Minelli, C. Piromallo and A. Billi (2011). Topography of the Calabria subduction zone (southern Italy): Clues for the origin of Mt. Etna. Tectonics, 30(1), 10.1029/2010TC002694.
Frohlich, C., and S.D. Davis (1999). How well constrained are well-constrained T, B, and P axes in moment tensor catalogs?, Journ. Geophys. Res.: Solid Earth, 104(B3), 4901-4910.
Gallais, F., D. Graindorge, M.A. Gutscher, and D. Klaeschen (2013). Propagation of a lithospheric tear fault (STEP) through the western boundary of the Calabrian accretionary wedge offshore eastern Sicily (Southern Italy), Tectonophysics, 602, 141-152.
Gephart, J. W., and D. W. Forsyth (1984). An improved method for determining the regional stress tensor using earthquake focal mechanism data: application to the San Fernando earthquake sequence, J. Geophys. Res., 89(B11), 9305-9320.
Gillard, D., M. Wyss, and P. Okubo (1996). Type of faulting and orientation of stress and strain as a function of space and time in Kilauea’s south flank. Hawaii, J. Geophys. Res., 101, 16025–16042.
Gutscher, M. A., S. Dominguez, B.M. Lepinay, L. Pinheiro, F. Gallais, N. Babonneau, A. Cattaneo, Y. Le Faou, G. Barreca A. Micallef, and M. Rovere (2016). Tectonic expression of an active slab tear from high-resolution seismic and bathymetric data offshore Sicily (Ionian Sea). Tectonics, 35(1), 39-54.
Gutscher, M. A., H. Kopp, S. Krastel, G. Bohrmann, T. Garlan, S. Zaragosi, I. Klaucke, P. Wintersteller, B. Loubrieu, Y. Le Faou, L. San Pedro, S. Dominguez, M. Roverei, B. Mercier de Lepinay, C. Ranero and V. Sallares (2017). Active tectonics of the Calabrian subduction revealed by new multi-beam bathymetric data and high-resolution seismic profiles in the Ionian Sea (Central Mediterranean), Earth Planet. Sci. Lett., 461, 61-72.
Hardebeck, J. L., and E. Hauksson (2001). Crustal stress field in southern California and its implications for fault mechanics, Jour. Geophys. Res.: Solid Earth, 106(B10), 21859-21882.
Helffrich, G. R. (1997). How good are routinely determined focal mechanisms? Empirical statistics based on a comparison of Harvard, USGS and ERI moment tensors, Geophys. Jour. Int., 131(3), 741-750.
Hjörleifsdóttir, V., and G. Ekström (2010). Effects of three-dimensional Earth structure on CMT earthquake parameters, Phys. Earth Plan. Int., 179(3-4), 178-190.
Husen, S. and R. Smith (2004). Probabilistic earthquake location in threedimensional velocity models for the Yellowstone National Park region, Wyoming, Bull. Seism. Soc. Am., 94(6), 880–896.
Karagianni, I., C. B. Papazachos, E.M. Scordilis and G.F. Karakaisis (2015). Reviewing the active stress field in Central Asia by using a modified stress tensor approach, Jour. Seism., 19(2), 541-565.
Kennett, B. L. N., E. R. Engdahl and R. Buland (1995). Constraints on seismic velocities in the Earth from traveltimes, Geophys. J. Int. 122, 1, 108–124, doi:10.1111/j.1365-246X.1995.tb03540.x.
Li, H., A. Michelini, L. Zhu, F. Bernardi and M. Spada (2007). Crustal velocity structure in Italy from analysis of regional seismic waveforms, Bull. Seism. Soc. Am., 97(6), 2024-2039.
Lippitsch, R., R. White and H. Soosalu (2005). Precise hypocentre relocation of microearthquakes in a high-temperature geothermal field: the Torfajokull central volcano, Iceland, Geophys. J. Int., 160, 371–388. Lomax, A. and A. Michelini (2001). Comparison of NonLinLoc and linear earthquake locations in a 3D model.
http://alomax.free.fr/nlloc/ alberto˙comp/alberto˙comp.html.
Lomax, A., M. Cattaneo, N. Bethoux, A. Deschamps, F. Courboulex, J. Deverchere, and J. Virieux, (1998). Comparison of linear and non-linear earthquake locations for the 1995 Ventimiglia sequence, Poster presentation at: European Geophysical Society, XXII General Assembly, http://alomax.free.fr/posters/vintimiglia.
Lomax, A., J. Virieux, P. Volant and C. Berge-Thierry (2000). Probabilistic earthquake location in 3D and layered model, in Advances in Seismic Event Location, 101–134, Kluwer Academic Publishers, Netherlands. Maury, J., F. H. Cornet and L. Dorbath (2013). A review of methods for determining stress fields from earthquakes
focal mechanisms; Application to the Sierentz 1980 seismic crisis (Upper Rhine graben). Bull. Soc. Geol. Fr., 184(4-5), 319-334.
Michael, A.J. (1987). Use of focal mechanisms to determine stress: a control study, J. Geophys. Res. 92, 357–368. Milia, A., P. Iannace, M. Tesauro, and M. M. Torrente (2017). Upper plate deformation as marker for the Northern
STEP fault of the Ionian slab (Tyrrhenian Sea, central Mediterranean). Tectonophysics 710, 127-148. Minelli, L., and C. Faccenna (2010). Evolution of the Calabrian accretionary wedge (Central Mediterranean),
Tectonics, 29, TC4004, doi:10.1029/2009TC002562.
Musumeci, C., L. Scarfì, M. Palano and D. Patanè (2014). Foreland segmentation along an active convergent margin: New constraints in southeastern Sicily (Italy) from seismic and geodetic observations, Tectonophysics, 630, 137-149.
Neri, G., B. Orecchio, C. Totaro, G. Falcone and D. Presti (2009). Subduction beneath southern Italy close the ending: results from seismic tomography, Seismol. Res. Lett., 80, 63–70.
Neri, G., A. M. Marotta, B. Orecchio, D. Presti, C. Totaro, R. Barzaghi and A. Borghi (2012). How lithospheric subduction changes along the Calabrian Arc in southern Italy: geophysical evidences. Int. J. Earth Sci., 101(7), 1949-1969.
Neri, G., C. Totaro, B. Orecchio, and D. Presti (2018). What seismicity offshore Sicily suggests about lithosphere dynamics and microplate fragmentation models in the Central Mediterranean. Solid Earth Discuss., https://doi.org/10.5194/se-2018-112.
Nijholt, N., R. Govers and R. Wortel (2018). On the forces that drive and resist deformation of the south-central Mediterranean: a mechanical model study, Geophys. J. Int., https://doi.org/10.1093/gji/ggy144.
Nocquet, J. (2012). Present-day kinematics of the Mediterranean: a comprehensive overview of GPS results, Tectonophysics, 579, 220–242.
Orecchio, B., D. Presti, C. Totaro, I. Guerra and G. Neri (2011). Imaging the velocity structure of the Calabrian Arc region (South Italy) through the integration of different seismological data, Boll. Geofis. Teor. Appl., 52, 625– 638.
Orecchio, B., D. Presti, C. Totaro, and G. Neri (2014). What earthquakes say concerning residual subduction and STEP dynamics in the Calabrian Arc region, south Italy. Geophys. J. Int., 199(3), 1929-1942.
Orecchio, B., D. Presti, C. Totaro, S. D’Amico and G. Neri (2015). Investigating slab edge kinematics through seismological data: The northern boundary of the Ionian subduction system (south Italy), J. Geodyn., 88, 23-35. Orecchio, B., M. Aloisi, F. Cannavò, M. Palano, D. Presti, F. Pulvirenti, C. Totaro, G. Siligato and G. Neri (2017). Present-day kinematics and deformation processes in the southern Tyrrhenian region: new insights on the northern Sicily extensional belt, It. Jour. Geosci., 136(3), 418-433.
Palano, M., L. Ferranti, C. Monaco, M. Mattia, M., Aloisi, V. Bruno, F. Cannavò and G. Siligato (2012). GPS velocity and strain fields in Sicily and southern Calabria, Italy: updated geodetic constraints on tectonic block interaction in the central Mediterranean, J. Geophys. Res., 117(B7).
Palano, M., P.J. González and J. Fernández (2015a). The diffuse plate boundary of Nubia and Iberia in the Western Mediterranean: crustal deformation evidence for viscous coupling and fragmented lithosphere, Earth Planet. Sci. Lett., 430, 439-447.
Palano M., D. Schiavone, M. Loddo, M. Neri, D. Presti, R. Quarto, C. Totaro and G. Neri (2015b). Active upper crust deformation pattern along the southern edge of the Tyrrhenian subduction zone (NE Sicily): Insights from a multidisciplinary approach, Tectonophysics, 657, 205-218, doi:10.1016/j.tecto.2015.07.005.
Parker, R. L. and M. K. McNutt (1980). Statistics for the one-norm misfit measure, J. Geophys. Res., 85(B8), 4429-4430. Polonia, A., L. Torelli, P. Mussoni, L. Gasperini, A. Artoni and D. Klaeschen (2011). The Calabrian Arc subduction complex in the Ionian Sea: Regional architecture, active deformation, and seismic hazard, Tectonics, 30(5), doi:10.1029/2010TC002821.
Polonia, A., L. Torelli, A. Artoni, M. Carlini, C. Faccenna, L. Ferranti, L., Gasperini, R. Govers, D. Klaeschen, C. Monaco, G. Neri, N. Nijholt, B. Orecchio and R. Wortel (2016). The Ionian and Alfeo–Etna fault zones: New segments of an evolving plate boundary in the central Mediterranean Sea?. Tectonophysics, 675, 69-90.
Polonia, A., L. Torelli, L., Gasperini, L., Cocchi, F. Muccini, E. Bonatti, C. Hensen, M. Schmidt, S. Romano, A. Artoni and M. Carlini (2017). Lower plate serpentinite diapirism in the Calabrian Arc subduction complex, Nat. Commun., 8(1), 2172.
Pondrelli, S., C. Piromallo and E. Serpelloni (2004). Convergence vs. retreat in Southern Tyrrhenian Sea: insights from kinematics. Geophys. Res. Let., 31(6), doi:10.1029/2003GL019223.
Pondrelli, S., S. Salimbeni, G. Ekström, A. Morelli, P. Gasperini and G. Vannucci (2006). The Italian CMT dataset from 1977 to the present, Phys. Earth Plan. Int., 159(3-4), 286-303.
Bull. Seism. Soc. Am., 94, 2239–2253.
Presti, D., B. Orecchio, G. Falcone and G. Neri (2008). Linear versus nonlinear earthquake location and seismogenic fault detection in the southern Tyrrhenian Sea, Italy, Geophys. J. Int., 172, 607–618.
Presti, D., A. Billi, B. Orecchio, C. Totaro, C. Faccenna and G. Neri (2013). Earthquake focal mechanisms, seismogenic stress, and seismotectonics of the Calabrian Arc, Italy, Tectonophysics, 602, 153-175.
Scarfì, L., A. Messina and C. Cassisi (2013). Sicily and southern Calabria focal mechanism database: a valuable tool for local and regional stress-field determination. Ann. Geophys., 56(1), 0109.
Scarfì, L., G. Barberi, G. Barreca, F. Cannavò, I. Koulakov and D. Patanè (2018). Slab narrowing in the Central Mediterranean: the Calabro-Ionian subduction zone as imaged by high resolution seismic tomography. Sci. Rep., 8(1), 5178.
Schorlemmer, D., G. Neri, S. Wiemer and A. Mostaccio (2003). Stability and significance tests for b value anomalies: Example from the Tyrrhenian Sea, Geophys. Res. Let., 30(16), doi:10.1029/2003GL017335.
Serpelloni, E., G. Vannucci, S. Pondrelli, A. Argnani, G. Casula, M. Anzidei, P. Baldi and P. Gasperini (2007). Kinematics of the Western Africa-Eurasia plate boundary from focal mechanisms and GPS data, Geophys J Int, 169(3), 1180-1200.
Totaro, C., B. Orecchio, D. Presti, S. Scolaro, and G. Neri (2016). Seismogenic stress field estimation in the Calabrian Arc region (south Italy) from a Bayesian approach. Geophys. Res. Lett., 43(17), 8960-8969.
Vavryčuk, V. (2014). Earthquake mechanisms and stress field. Encyclopedia of earthquake engineering, 1-21. Waldhauser F., E. Kissling, J. Ansorge and S. Mueller (1998). Three-dimensional interface modelling with
twodimensional seismic data: the Alpine crust-mantle boundary, Geophys. J. Int., 135, 264-278.
Waldhauser F., R. Lippitsch, E. Kissling and J. Ansorge (2002). High-resolution teleseismic tomography of uppermantle structure using an a priori three-dimensional crustal model, Geophys. J. Int., 150, 403-414. Wyss, M., B. Liang, W.R. Tanigawa and W. Xiaoping (1992). Comparison of orientations of stress and strain tensor
based on fault plane solutions in Kaoiki, Hawaii, J. Geophys. Res. 97, 4769–4790.
Zoback, M.L. (1992). First-and second-order patterns of stress in the lithosphere: the world stress map project, J. Geophys. Res., 97(B8), 11 703–11 728.
*CORRESPONDING AUTHOR: Debora PRESTI,
Department of Mathematics, Computer Sciences, Physics and Earth Sciences, University of Messina; e-mail: [email protected] © 2020 the Istituto Nazionale di Geofisica e Vulcanologia. All rights reserved


![Figure 6. Synthetic test showing the different results obtained by application of the stress inversion methods by Gephart and Forsyth [1984], Vavrikuk [2014] and Arnold and Townend [2007]](https://thumb-eu.123doks.com/thumbv2/123dokorg/4597128.39524/12.892.108.787.875.1011/synthetic-different-obtained-application-inversion-gephart-vavrikuk-townend.webp)