articoli
Evaluate children’s User eXperience with AttrakDiff method: USiena experience
Valutare la User eXperience dei bambini con il metodo AttrakDiff: l’esperienza USiena
Antonio Giardia,1
a Università di Siena, [email protected]
Abstract
The objective of this paper is to share the results of a pilot study conducted by the University of Siena in collaboration with the “Renato Fucini” Comprehensive Institute. The aim has been to evaluate the User eXperience of 96 children using two different educational formats, the Frontal Teaching and the Multimedia Teaching. Six between subjects experiments have been carried out. At the end of each experiment a multiple-choice questionnaire (learning level evaluation) and the AttrakDiff questionnaire (UX evaluation) have been used. On the values obtained from multiple-choice questionnaire the Wilcoxon-Mann-Whitney test has been applied. The study results highlighted two aspects: the learning level of Multimedia Teaching format has been slightly better than Frontal Teaching format, the UX related to Multimedia Teaching format has been basically similar for all children while the own teacher presence has influenced the Frontal Teaching format UX. Keywords: User eXperience; UX evaluation; AttrakDiff; multimedia content; format comparison.
Sintesi
L’obiettivo di questo articolo è di condividere i risultati di uno studio pilota condotto dall’Università di Siena in collaborazione con l’Istituto Comprensivo “Renato Fucini”. Lo scopo è stato quello di valutare la User eXperience di 96 bambini utilizzando due diversi format educativi: Didattica frontale e Didattica multimediale. Sono stati effettuati sei esperimenti fra campioni diversi. Alla fine di ogni esperimento sono stati utilizzati un questionario a scelta multipla (valutazione del livello di apprendimento) e il questionario AttrakDiff (valutazione della UX). Sui valori ottenuti dal questionario a scelta multipla è stato applicato il test di Wilcoxon-Mann-Whitney. I risultati dello studio hanno evidenziato due aspetti: il livello di apprendimento del format Didattica multimediale è stato leggermente migliore rispetto al format Didattica frontale, la UX relativa al format Didattica multimediale è stata sostanzialmente simile per tutti i bambini mentre la presenza della propria maestra ha influenzato la UX del format Didattica frontale.
Parole chiave: User eXperience; valutazione della UX; AttrakDiff; contenuto multimediale; confronto fra formati.
1 I would like to thank the Headmaster of the Comprehensive Institute “Renato Fucini” of Monteroni d’Arbia (SI) Dr. Maria Donata Tardio and teachers Lorna Baffetti, Mariangela Gagliardi, Daniela Giorni and Maria Antonia Manetta for their help and valuable collaboration without which I could not carry out the experimentation.
1. Introduction
Understanding the needs, expectations and requirements of the potential users from any cognitive artifact, which is yet to be developed, is considered important and essential. A study of early user needs and expectations could potentially help in the approximation of the actual User eXperience (UX) even before the product or service is realized (Heikkinen, Olsson, & Väänänen-Vainio-Mattila, 2009). The recent shift of emphasis from usability to UX has made it a central focus of product design and evaluation (Vermeeren et al., 2010). UX researchers have concluded that the basis of any positive User eXperience is already defined when the product or service is still at the conceptual level, even when no actual interaction between the cognitive artifact and the user exists (Roto, Rantavuo, & Väänänen-Vainio-Mattila, 2009). The positive experiences of a product create user satisfaction and – conversely – negative ones can lead to product abandonment (Mugge, Schifferstein, & Schoormans, 2006). For this reason, the last few decades witnessed an ever-growing interest in studying and understanding the UX of different cognitive artifacts (Jordan, 2000; Kuutti, 2010).
This article is divided into the following sections: Introduction, Background (an overview of UX literature and UX evaluation methods, AttrakDiff method and research questions are provided), Materials and Methods (the sample of subjects, the experimental setting and the experimentation carried out are listed), Results (the experimentation results are described), Discussions and Conclusions.
2. Background
In this section, an overview of UX literature and UX evaluation methods, AttrakDiff method (chosen for experimentation) and research questions are provided.
2.1. User eXperience
In the mid-90s of the last century, Donald Norman introduced the concept of User
eXperience associating to this term the set of feelings, thoughts and moods that a user feels
when interacting with an artifact. Norman explains he introduced the term UX because he believed usability to be too narrow to represent a holistic vision of Human-Computer Interactions (Norman, Miller, & Henderson, 1995).
Since the 2000s, the concept of UX is widely used but understood in different ways: many definitions and models have been proposed without resulting in a true consensus (Law, Roto, Hassenzahl, Vermeeren, & Kort, 2009). The term User eXperience is associated with a wide variety of meanings, ranging from traditional usability to beauty, hedonic, affective or experiential aspects of technology use (Blythe, Hassenzahl, Law, & Vermeeren, 2007; Hassenzahl & Tractinsky, 2006; Hassenzahl, 2003; 2008; Karapanos, Zimmerman, Forlizzi, & Martens, 2010). The produced literature, tried to establish a common ground, a shared vision of what constitutes a good UX.
The site All About UX (https://www.allaboutux.org/) reports 27 different UX definitions. Across the numerous definitions that have been proposed (Hassenzahl & Tractinsky, 2006; Law et al., 2009), researchers and practitioners agree that UX is the result of the interaction between three elements: the user, the system and the context.
At the theoretical level, usability and UX are both considered part of User-Centred Design, which is defined as “an approach to interactive systems development that aims to make systems usable and useful” (ISO, 2010, p. VI). This model, initially formalized as an ISO standard in 1999 focusing exclusively on usability (ISO, 1999), has included UX as one of the six key principles that will ensure that a design is user-centered: introduces new concepts to the quality of a cognitive artifact such as aesthetics (Tractinsky, Katz, & Ikar, 2000), pleasure (Jordan, 2000), fun (Blythe, Overbeeke, Monk, & Wright, 2003) and hedonic qualities (Hassenzahl, 2004).
UX evaluations are conducted using many different methods. Alves, Valente, and Nunes (2014) have showed that the most popular methods are observation, think aloud and contextual inquiries, interviews, experience prototyping, task analysis, cognitive walkthrough and questionnaires.
Among the available methodologies, AttrakDiff has been chosen for three reasons: provides a proven and tested methodology (used in many researches), helps designers to understand UX on a detailed level (word pair assessments) but also based on different groups of qualities (pragmatic, hedonic, attractiveness), helps to evaluate the user’s feelings about the interaction with a questionnaire (providing quantitative data). Recent experimental research has proven the importance of putting subjective perceptions on a quantitative scale (Diefenbach, Kolb, & Hassenzahl, 2014).
2.2. Attrakdiff
Increasingly, cognitive artifacts stand out for their UX. AttrakDiff assess the user’s feelings about the cognitive artifact with a questionnaire. In AttrakDiff questionnaire, both hedonic and pragmatic dimensions of UX are studied with semantic differentials (Hassenzahl, 2003; 2004; Hassenzahl, Burmester, & Koller, 2003). AttrakDiff is available online in a basic (free – limited to 20 subjects) or premium (fee – unlimited) version.
In the current version, AttrakDiff metric contains 28 different attributes which are categorized into four main groups:
• perceived pragmatic quality (PQ) – describes the usability of the product and indicates the perceived level of user ease in achieving its goals;
• perceived hedonic quality-identification (HQ-I) – indicates the extent to which the product supports a social function and communicates a certain identity of the user; • perceived hedonic quality-stimulation (HQ-S) – indicates how the product supports the need for stimulation by providing new, interesting and stimulating contents, characteristics and styles of interaction;
• attractiveness (ATT) – describes the total perceived value of the product based on the perception of pragmatic and hedonic qualities.
All the attributes are evaluated using the bipolar semantic differential 7-scale method that represent opposites (good-bad). The middle value is 0, left-most value as -3 and right-most value as +3. To avoid the tendency of acquiescence during the passage of deliveries, the objects do not have the same valence: sometimes the word on the left is negative and sometimes is positive.
2.3. Research questions
The author proposed an experimental research design for the study, because it allows to test the relation between dependent and independent variables: experimental research design
has been widely used in UX research (De Angeli, Sutcliffe, & Hartmann, 2006; Hassenzahl, 2013).
Starting from this theoretical background, two different educational formats have been used in the experimentation: the classic frontal lesson and the multimedia lesson. The used formats, listed below as Frontal Teaching (FT) and Multimedia Teaching (MT), are described in section 3. With regard to these two formats, the present study (which is part of the T-REX research activity: studenT – useR EXperience evaluation in primary school) is based on three main research questions which are addressed in this paper: are there any differences in pupils’ UX perceptions between FT and MT? the own teacher presence influences pupils’ UX perceptions? Is there a learning difference between FT and MT?
3. Materials and Methods
In this section, the sample of subjects, the experimental setting and the experimentation carried out are listed.
3.1. Participants
The experimental method has been used to carry out a pilot study with 96 children, 42 males and 54 females, aged between nine and ten years attending the fifth grade of a primary school. The 96 children have been divided into five groups, from A to E. Each group has been associated with the child’s class. Each group performed two actions: listened to a frontal lecture (FT) held by the teacher and observed a multimedia lecture (MT). Six between subjects experiments have been carried out, described in 3.5 Experimentation section.
3.2. Experimental setting
A research system has been created, in order to allow pupils to watch the multimedia lesson and listen to the frontal lesson and then evaluate the pupils’ UX perceptions and the pupils’ knowledge acquisition. The research has been carried out in the pupils’ classrooms, in order to keep them in a familiar environment. Three devices have been used: a computer to display the multimedia lesson (MT), a paper questionnaire to evaluate pupils’ UX perceptions (AttrakDiff questionnaire), a paper questionnaire to evaluate the pupils’ knowledge acquisition (evaluation questionnaire). For the frontal lesson (FT), no devices have been used.
3.3. The experimentation
Together with the school teachers, two educational contents have been identified: The
Galaxies and Small Celestial Bodies. For each content, a prototype videoclip has been
created, following the guidelines provided by the USiena format.
These guidelines contain design indications relating to a mobile course structure (modular structure, different formats, easy editing of contents, etc.), words readability (font, font colors, keywords, etc.), texts and contents organization (concept maps, use of images, limited number of characters, etc.). Texts and images present in videoclips, varied according to the contents explained by the teacher, as well as blinking actions on keywords (Giardi, 2016a; 2016b; 2017).
In the videoclips appeared, simultaneously and permanently: • the title of the educational content;
• some images and/or animations (always in the same video position); • the title of the topic;
• the teacher who explains (always the same for both videoclips and always in the same video position);
• some keywords.
Figure 1 shows the example of the content Small Celestial Bodies, with the topic Asteroids and the keywords Small Pianets, Irregular Form and Weak Strength of Gravity.
Figure 1. Video format (University of Siena).
The same teacher has both explained the frontal lesson and videotaped and inserted in the videoclip structure (multimedia lesson).
Considering the children, three distinct experimental situations have been reproduced: • a known teacher (but not the own) appeared in video and explained the frontal
lesson (groups A-B);
• the own teacher appeared in video and explained the frontal lesson (groups C-D); • a never seen and known teacher appeared in video and explained the frontal lesson
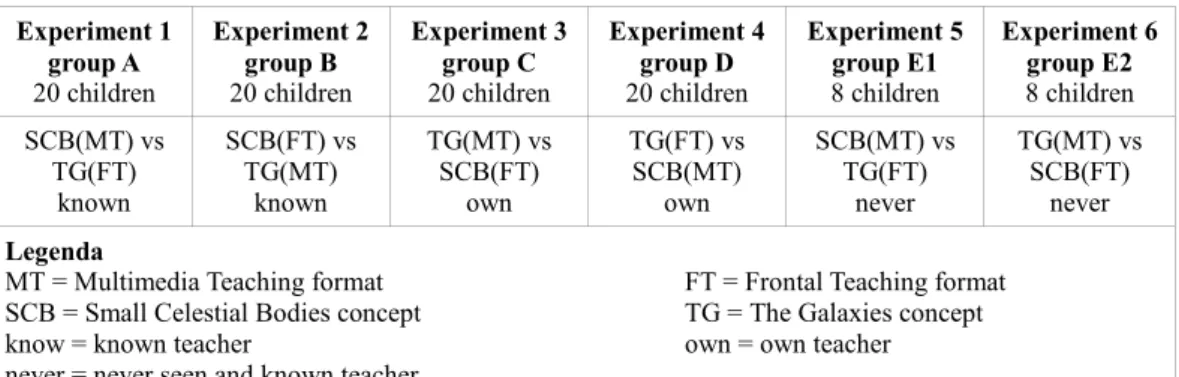
(group E). Experiment 1 group A 20 children Experiment 2 group B 20 children Experiment 3 group C 20 children Experiment 4 group D 20 children Experiment 5 group E1 8 children Experiment 6 group E2 8 children SCB(MT) vs TG(FT) known SCB(FT) vs TG(MT) known TG(MT) vs SCB(FT) own TG(FT) vs SCB(MT) own SCB(MT) vs TG(FT) never TG(MT) vs SCB(FT) never Legenda
MT = Multimedia Teaching format FT = Frontal Teaching format SCB = Small Celestial Bodies concept TG = The Galaxies concept
know = known teacher own = own teacher
never = never seen and known teacher
Figure 2. Experimentation groups with lessons topics and modality (University of Siena).
The experimentation has been divided into six between subjects experiments and each group participated in a single experiment (Figure 2). Each experiment has been divided into two tests. In one test, the task assigned to each child has been to listen to the teacher
explaining a first didactic content in the classical mode of the frontal lesson (Frontal Teaching). In the other test, the task assigned to each child has been to watch the prototype videoclip described above containing a second educational content in a multimedia format (Multimedia Teaching).
The children in group E has been subdivided into 2 subgroups in order to carry out experiments similar to the first four (there was only one class in the never seen and known teacher condition).
3.4. Evaluation questionnaire
The school teachers, carried out an evaluation questionnaire related to the topics covered (learning level evaluation). The questionnaire consisted of 12 multiple-choice questions. The 12 questions have been divided into: easy (4), medium difficulty (4) and difficult (4); this subdivision has been made according to the teachers indications. In order not to give the impression that the difficulty questions increase from the first to the last, the questions have been presented following a random order. For each format, FT and MT, the learners’ learning level has been evaluated. Considering the number of correct answers provided by the children in each questionnaire (and consequently in each educational format), has been possible to compare the knowledge acquired by the children and evaluate their learning level.
Two evaluation questionnaires, one relating to The Galaxies topic and one related to Small Celestial Bodies topic, have been used at the end of each test. Every child filled two evaluation questionnaires.
To better understand the differences between answers inside the experiments and among the participants, the author used the Wilcoxon-Mann-Whitney test calculated using the statistical software R.
3.5. Attrakdiff questionnaire
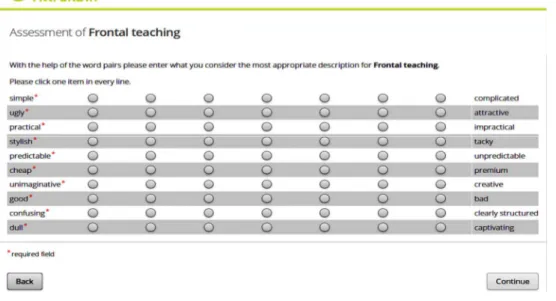
A shortened version of AttrakDiff, containing only 10 attributes, can be used in experimentations (Figure 3).
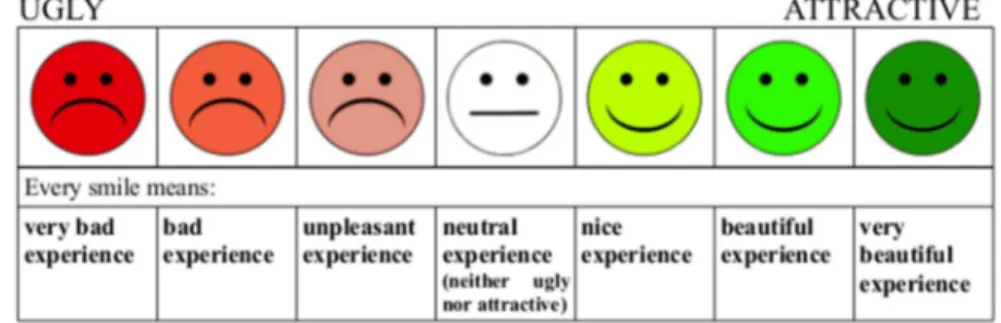
Karapanos (2010) has already used the shortened version of the AttrakDiff questionnaire. In the present study, the shortened version of AttrakDiff was used and a paper questionnaire with the ten attributes has been created. The reasons for the choice are different: the meaning of some words pairs is easy to understand for children (good-bad or simple-complicated) while for other words pairs the teacher explanation would be necessary (separates me-brings me closer), the AttrakDiff questionnaire is filled at the end of each experiment (after viewing a content, listening to another content, filling two multiple-choice questionnaire for learning level evaluation), children’ attention span is quite low. To facilitate the visual understanding that the lived experience may have different shades, associated with the bipolar semantic differential 7-scale method, the AttrakDiff shortened questionnaire has been enriched with smileys (Figure 4).
Figure 4. Questionnaire AttrakDiff shortened modified (University of Siena).
Furthermore, the AttrakDiff online platform has been used. This platform, processes data in real time and provides immediate calculation results: Portfolio-presentation, Diagram of average values, Description of word-pair.
Two AttrakDiff shortened questionnaires, one relating to Frontal Teaching format and one relating to Multimedia Teaching format, have been used at the end of each experiment. Every child filled two AttrakDiff shortened questionnaires. All 192 AttrakDiff shortened questionnaires have been subsequently placed into AttrakDiff online platform for calculation results.
4. Results
In this section, the sample of subjects, the experimental setting and the experimentation carried out are listed.
As mentioned above, the AttrakDiff model consists of three sets of qualities and attractiveness. Being the shortened version of AttrakDiff, the HQ-I and HQ-S results have been unified by the AttrakDiff online platform in Hedonic Quality (HQ). With regard to the first research question, are there any differences in pupils’ UX perceptions between Frontal
Teaching and Multimedia Teaching?, the answer is affirmative.
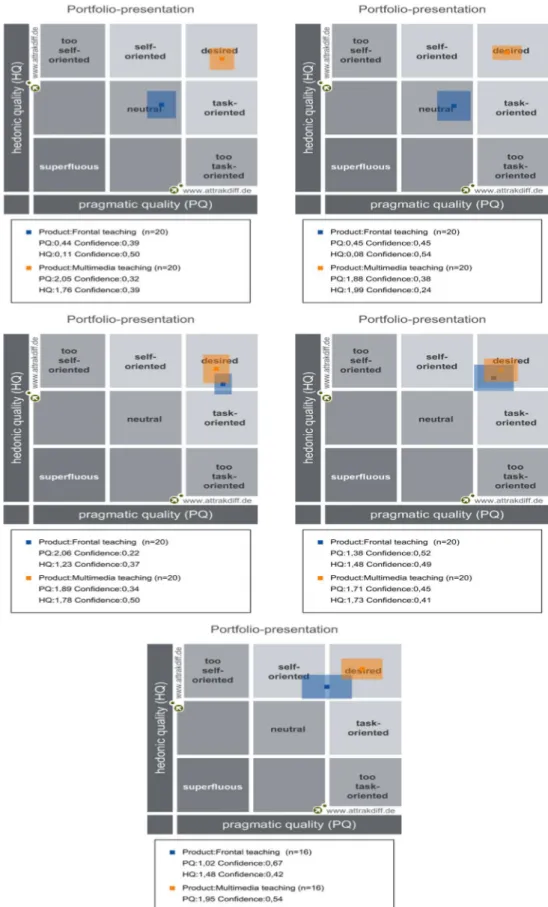
One of the three results calculated by AttrakDiff online platform is the Portfolio presentation (Figure 5): the positioning of average values and confidence levels for each group helped to evaluate child-format interaction episodes. For each group, the average word pair assessment values for pragmatic and hedonic qualities created a point on the map. The location of the points also showed in which area (from too self-oriented to too
It can be seen from the Figure 5 that – for all groups except group C – Multimedia Teaching format had highest values for pragmatic and hedonic qualities compared to Frontal Teaching format: the base and height confidence rectangle values of each group have been very similar, placing itself in desired area.
Moreover, MT format also had a smaller confidence interval for PQ and HQ compared to FT format, indicating a greater level of certainty on the users.
Finally, the MT format is located in the above-average region with an overall impression of the approach as attractive. For group C alone, lower values for pragmatic qualities (1.89 vs. 2.06) and larger confidence rectangles emerged (0.34 vs. 0.22 and 0.50 vs. 0.37). On the contrary, the Frontal Teaching format position values in the grid has been generally different: substantially neutral for A and B groups, between desired and task-oriented for group C, desired for group D, between self-oriented and desired for group E.
For A and B groups, the difference in terms of pragmatic and hedonic quality compared to MT format is important, whereas for C and D groups is not statistically significant (this might be due to the small sample of children per group who participated in the experimentation).
With regard to the second research question, the own teacher presence influences pupils’
UX perceptions?, the answer is affirmative.
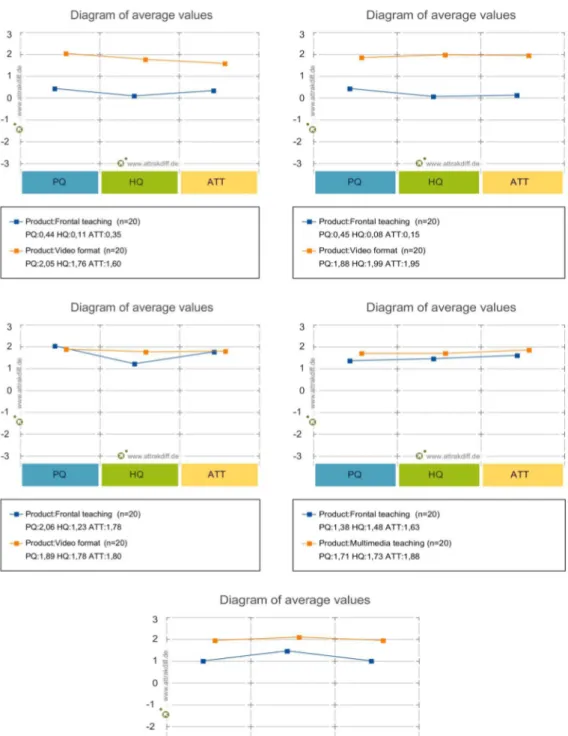
A second result calculated by AttrakDiff online platform is the Diagram of average values (Figure 6).
The calculation for grouping has been done via averaging the values of all answers inside one group. The vertical axis represents the average assessment values of the word pairs inside each group and the horizontal axis shows the three word groups (PQ, HQ, ATT). A bigger number on the y-axis (on a scale of 1-7) depicts better UX with the didactic content, while a value that approximates to 0 expresses a neutral experience.
The UX reported by children for MT format has been virtually identical for all five groups: the value of PQ ranged from 1.71 to 2.05, HQ from 1.73 to 2.13, ATT from 1.60 to 1.97. On the contrary, the values emerged for FT format have been extremely heterogeneous. In A and B groups (known teacher) the children reported a neutral UX: PQ 0.44 and 0.45, HQ 0.11 and 0.08, ATT 0.35 and 0.15.
In C and D groups (own teacher) the children reported a better UX: PQ 2.06 and 1.38, HQ 1.23 and 1.48, ATT 1.78 and 1.63.
In E group (never seen and known teacher) average values of UX, compared to previous groups, emerged: PQ 1.02, HQ 1.48, ATT 1.03.
Figure 6. AttrakDiff - Diagram of average values – Groups A-B / C-D / E (University of Siena).
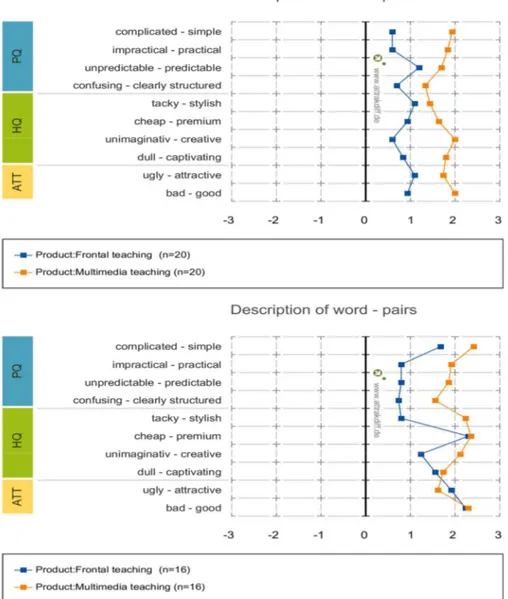
The same contrasting results also emerges in Description of words-pairs, the third result calculated by AttrakDiff online platform (Figure 7).
Figure 7. AttrakDiff - Description of words - pairs – Groups A-E (University of Siena).
The Figure 7 is a visual representation of the word pair values selected by the children, which helps to instantly understand their evaluations. Word pairs are in the vertical axis, whereas the assessment is in the horizontal axis. The values in the Figure represent the chosen option in the word pair, -3 referring to the leftmost and 3 to the rightmost part of the scale. Each format is shown as a connected line with different colours.
For all children the Multimedia Teaching format had higher values than Frontal Teaching format. This option, first of all, allows to examine individual word pairs: for example, if the researcher is searching for the most creative and innovative designs, only those word pairs could be assessed (unimaginative-creative). In this study no specific word pair separately was as relevant as the averages of AttrakDiff groups, because the research was not looking for just simple versus complicated or good versus bad solutions. However, this study allowed to detect any high values inside each group.
For the MT format, a homogeneity of values for all five groups can be noted: the average value has been kept on the 2 value. The words pairs with higher positive values have been
complicated-simple and confusing-clearly structured (PQ), tacky-stilish and
unimaginative-creative (HQ), bad-good (ATT).
For FT format the values have been extremely heterogeneous. For A and B groups the average value has been kept on the 0 value. In addition, some negative values emerged:
confusing-clearly structured (PQ), unimaginative-creative and dull-captivating (HQ), ugly-attractive (ATT ) as evidence of a negative experience related to this didactic format. For
C and D groups the average value has been kept on 1.5 value (group C) and 1 value (group D). Moreover, for group C, the positive values of MT format have been equalled (complicated-simple, ugly-attractive and bad-good) and in some cases outdated (impractical-practical, unpredictable-predictable and confusing-clearly structured). In group E the average value has been kept on 1.2 value. Moreover, the values have been generally lower than MT format, except for cheap-premium and dull-captivating (HQ),
ugly-attractive and bad-good (ATT).
With regard to the third research question, is there a learning difference between Frontal
Teaching (FT) and Multimedia Teaching (MT)?, the answer is affirmative.
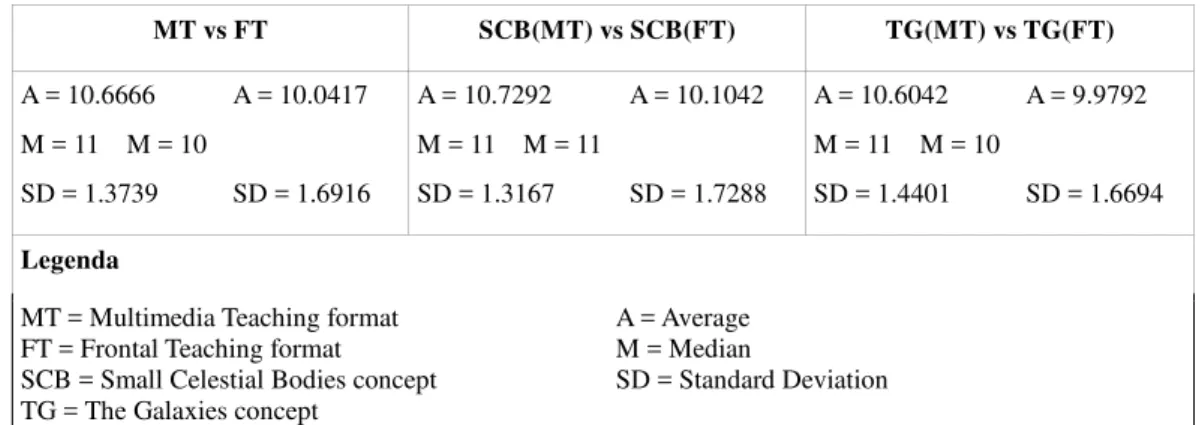
Figure 8 shows the average number of correct answers provided by the children in the multiple-choice questionnaire, comparing the two formats in their totality (MT vs FT) and subdividing the obtained values on the basis of the two didactic contents (learning level evaluation). The average value of the children’ evaluations has been calculated for each experiment. Additionally, standard deviation has been calculated to understand how big were the differences inside one experiment’s answers.
MT vs FT SCB(MT) vs SCB(FT) TG(MT) vs TG(FT) A = 10.6666 A = 10.0417 M = 11 M = 10 SD = 1.3739 SD = 1.6916 A = 10.7292 A = 10.1042 M = 11 M = 11 SD = 1.3167 SD = 1.7288 A = 10.6042 A = 9.9792 M = 11 M = 10 SD = 1.4401 SD = 1.6694 Legenda
MT = Multimedia Teaching format FT = Frontal Teaching format
SCB = Small Celestial Bodies concept TG = The Galaxies concept
A = Average M = Median
SD = Standard Deviation
Figure 8. Average number of correct answers by format and content (University of Siena).
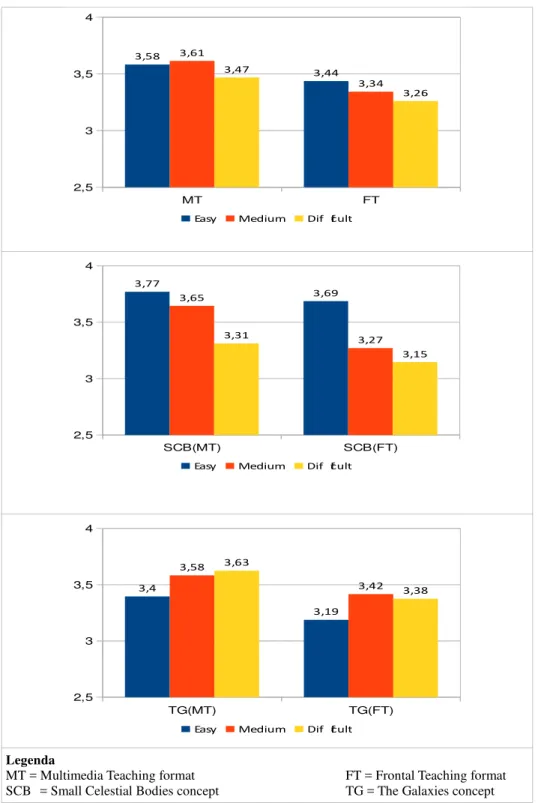
Considering the knowledge transmission from lecturer to learner, the MT format obtained slightly better learning results compared to FT format (Figure 8), both considering the two formats in their entirety (MT vs FT – 96 children) and considering separately the two didactic contents identified (SCB(MT) vs SCB(FT) and TG(MT) vs TG(FT) – 48 children). Figure 9 shows the same data listed in Figure 8, subdividing the average number of correct answers according to the facility-difficulty of the questions. FT presented a slight but
constant flexion in the average number of correct answers, passing from easy to difficult
questions (MT vs FT). A counter-trend data emerged with the The Galaxies content: the average number of correct answers for difficult questions has been higher than the same value of easy questions. As stated by the teachers, the teacher’s subjective perception of contents facility has been different than children’s perception.
Legenda
MT = Multimedia Teaching format FT = Frontal Teaching format SCB = Small Celestial Bodies concept TG = The Galaxies concept
Figure 9. Average number of correct answers by format and content (University of Siena).
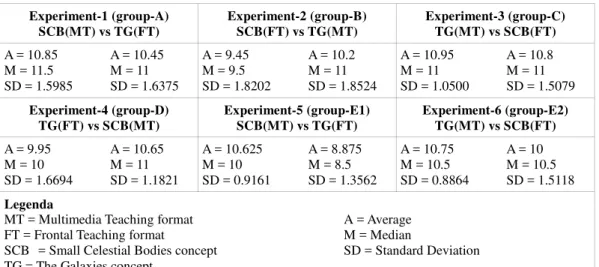
Similar results emerged considering the average number of correct answers for each experiment (Figure 10).
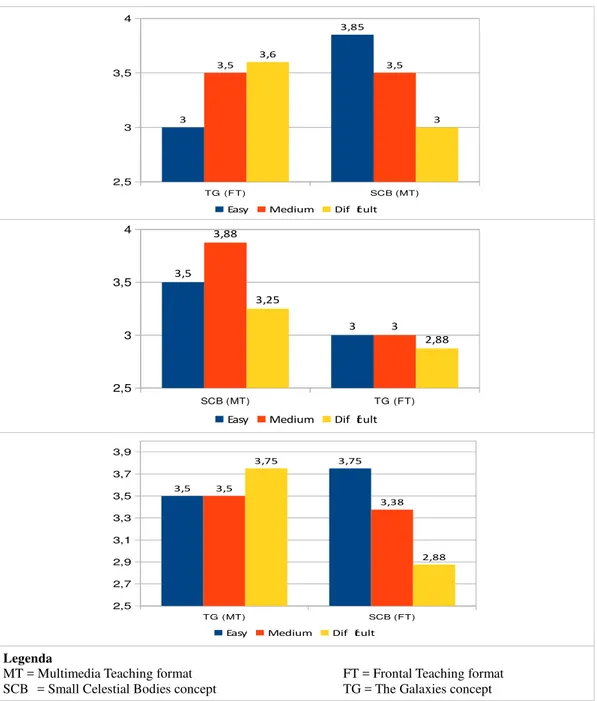
Figure 11 shows the same data listed in Figure 10, subdividing the average number of correct answers according to the facility-difficulty of the questions.
MT FT 2,5 3 3,5 4 3,58 3,44 3,61 3,34 3,47 3,26
Easy Medium Dif ficult
SCB(MT) SCB(FT) 2,5 3 3,5 4 3,77 3,69 3,65 3,27 3,31 3,15
Easy Medium Dif ficult
TG(MT) TG(FT) 2,5 3 3,5 4 3,4 3,19 3,58 3,42 3,63 3,38
Experiment-1 (group-A) SCB(MT) vs TG(FT) Experiment-2 (group-B) SCB(FT) vs TG(MT) Experiment-3 (group-C) TG(MT) vs SCB(FT) A = 10.85 A = 10.45 M = 11.5 M = 11 SD = 1.5985 SD = 1.6375 A = 9.45 A = 10.2 M = 9.5 M = 11 SD = 1.8202 SD = 1.8524 A = 10.95 A = 10.8 M = 11 M = 11 SD = 1.0500 SD = 1.5079 Experiment-4 (group-D) TG(FT) vs SCB(MT) Experiment-5 (group-E1) SCB(MT) vs TG(FT) Experiment-6 (group-E2) TG(MT) vs SCB(FT) A = 9.95 A = 10.65 M = 10 M = 11 SD = 1.6694 SD = 1.1821 A = 10.625 A = 8.875 M = 10 M = 8.5 SD = 0.9161 SD = 1.3562 A = 10.75 A = 10 M = 10.5 M = 10.5 SD = 0.8864 SD = 1.5118 Legenda
MT = Multimedia Teaching format A = Average FT = Frontal Teaching format M = Median
SCB = Small Celestial Bodies concept SD = Standard Deviation TG = The Galaxies concept
Figure 10. Average number of correct answers for each experiment (University of Siena).
SCB (MT) TG (FT) 2,5 3 3,5 4 3,8 3,45 3,7 3,65 3,35 3,35
Easy Medium Dif ficult
SCB (FT) TG (MT) 2,5 3 3,5 4 3,55 3,25 3,1 3,35 2,8 3,6
Easy Medium Dif ficult
TG (MT) SCB (FT) 2,5 3 3,5 4 3,5 3,8 3,85 3,4 3,6 3,6
Legenda
MT = Multimedia Teaching format FT = Frontal Teaching format SCB = Small Celestial Bodies concept TG = The Galaxies concept
Figure 11. Average number of correct answers for each experiment (University of Siena).
Considering the two formats in their entirety (MT vs FT – 96 children) and comparing the variable values, all the test results have been significant (V=1940, p-value=0.00609). Considering separately the two didactic contents identified (48 children for the first content and 48 children for the second), similar results have been obtained (Figure 12).
SCB (MT) vs SCB (FT) W = 1378.5, p-value = 0.03815 TG (MT) vs TG (FT) W = 1403, p-value = 0.03976
Figure 12. Wilcoxon Rank Sum Test (University of Siena).
TG (FT) SCB (MT) 2,5 3 3,5 4 3 3,85 3,5 3,5 3,6 3
Easy Medium Dif ficult
SCB (MT) TG (FT) 2,5 3 3,5 4 3,5 3 3,88 3 3,25 2,88
Easy Medium Dif ficult
TG (MT) SCB (FT) 2,5 2,7 2,9 3,1 3,3 3,5 3,7 3,9 3,5 3,75 3,5 3,38 3,75 2,88
Comparing the values of the variables within the same experiment (20 children for groups A-D and 16 for group E), 4 significant results and 2 non-significant results have been obtained (Figure 13). Experiment 1 V = 94.5, p-value = 0.0039 Experiment 2 V = 33, p-value = 0.0293 Experiment 3 V = 73.5, p-value = 0.0938 Experiment 4 V = 42, p-value = 0.0818 Experiment 5 V = 28, p-value = 0.02107 Experiment 6 V = 13, p-value = 0.0396
Figure 13. Wilcoxon Signed Rank Test (University of Siena).
5. Conclusions
Although the present experimentation has been only a pilot study, the results emerged have been certainly interesting: the diversity in User eXperience has proven to exist also in this study.
The obtained results highlighted two aspects: the learning level of Multimedia Teaching format has been slightly better than Frontal Teaching format, the UX related to Multimedia Teaching format has been basically similar for all children while the own teacher presence has influenced the Frontal Teaching format UX.
Despite it was not planned to make observations, several children have commented orally their experience. Therefore, the author took some additional notes regarding their behavior; the notes are generalised and not connected to any specific child. Based on a visual inspection, almost all the children analyzed more thoroughly the word pairs while filling the AttrakDiff shortened questionnaires, evaluating the different shades of color associated with the lived experience.
From the study emerged that the children have been able to evaluate the analyzed didactic formats and report their experiences successfully. Therefore, the author believes that the study provided useful information about the AttrakDiff method for UX evaluation. In conclusion, according to the AttrakDiff results, the MT format clearly met the users’ expectations had for it, can be trusted, it fits well to teaching and can be considered a professional teaching tool. Therefore, it gave a very positive UX, resulting to be the most desired format for all children: the evaluation of different qualities of the reported UX has proved homogeneous. While for the FT format a key role is played by the teacher: the presence of own teacher has influenced the children’s UX.
The AttrakDiff questionnaire is a good indicator of how the product’s pragmatic and hedonic qualities are perceived. Unfortunately, AttrakDiff does not distinguish the most important UX factors for users, so it can be difficult for practitioners to decide which UX dimensions they should focus on when developing the product further.
From the researcher’s point of view, although AttrakDiff was straightforward to use, measurements with children have been quite laborious because the teachers had to explain the meaning of some pairs of words such as stylish-tacky.
The activity proposed in this paper, however, has some limitations: this also creates restrictions on interpreting the results of the research.
Firstly, being a pilot study, only one Comprehensive Institute has been involved. The involvement of a larger number of Comprehensive Institutes could obviously lead to different results.
Secondly, the participants have been limited to children attending the fifth grade. The User eXperience of subjects coming from a different experimental sample could be different. Finally, several studies have shown that the nature of different UX qualities of any cognitive artifact evolve and change continuously over time due to its temporal nature (Fenko, Schifferstein, & Hekkert, 2010; Kankainen, 2003; Karapanos, Hassenzahl, & Martens, 2008). Surely it would be interesting to observe how the UX of a child changes, also to realize if the highest values obtained by MT format are real or virtual (due for example to the momentary didactic novelty).
Future research steps could be identified in two directions: expanding and diversifying the number and the typology of involved subjects (also involving younger children in the study), making repeated measurements over time (at least five experimental situations during the school year).
Additional research could be conducted to study the differences among AttrakDiff qualities. For example, it can be investigated which interaction elements provide better scores for pragmatic or hedonic qualities.
Reference List
All About UX. https://www.allaboutux.org/ (ver. 10.12.2019).
All About UX. Information for user experience professionals. User experience definitions. http://www.allaboutux.org/ux-definitions (ver. 10.12.2019).
All About UX. Information for user experience professionals. User experience methods. http://www.allaboutux.org/all-methods (ver. 10.12.2019).
Alves, R., Valente, P., & Nunes, N. J. (2014). The state of user experience evaluation practice. Proceedings of the 8th Nordic Conference on Human-Computer
Interaction (NordiCHI ‘14) (pp. 93-102). Helsinki, Finland. https://doi.org/10.1145/2639189.2641208 (ver. 10.12.2019).
Attrakdiff. http://www.attrakdiff.de/ (ver. 10.12.2019).
Blythe, M., Hassenzahl, M., Law, E., & Vermeeren, A. (2007). An analysis framework for user experience (UX) studies: A green paper. In E. Law, A. Vermeeren, M. Hassenzahl & M. Blythe (Eds.), Towards a UX Manifesto-Proceedings of a
COST294-MAUSE affiliated workshop on BHCI (pp. 1-5). Lancaster: COST.
Blythe, M., Overbeeke, K., Monk, A., & Wright, P. (2003). Funology: from usability to
enjoyment. Dordrecht: Kluwer Academic Publishers.
De Angeli, A., Sutcliffe, A., & Hartmann, J. (2006). Interaction, usability and aesthetics: what influences users’ preferences? Proceedings of the 6th conference on
Designing Interactive systems, 271–280. University Park & New York: ACM.
https://doi.org/10.1145/1142405.1142446 (ver. 10.12.2019).
Diefenbach, S., Kolb, N., & Hassenzahl, M. (2014). The ‘Hedonic’ in Human-Computer Interaction – History, Contributions, and Future Research Directions. Proceedings
of the 2014 conference on Designing interactive systems (DIS 2014) (pp. 305-314).
Vancouver, BC, Canada. https://doi.org/10.1145/2598510.2598549 (ver. 10.12.2019).
Fenko, A., Schifferstein, H. N. J., & Hekkert, P. (2010). Shifts in sensory dominance between various stages of user-product interactions. Applied ergonomics, 41(1), 34–40.
Giardi, A. (2016a). ‘USiena’ vs ‘only video’: comparing the two models for a mobile course design. SCIREA Journal of Education, 1(1), 1–14.
Giardi, A. (2016b). Mobile learning: una comparazione sull’acquisizione della conoscenza utilizzando due modelli di corso. Form@re – Open Journal per la formazione in
rete, 16(3), 148–162.
Giardi, A. (2017). iTunesU e modello «USiena»: una nuova prospettiva per l’apprendimento in mobilità degli studenti con dislessia? Dislessia, 14(2), 213– 236.
Hassenzahl, M. (2003). The thing and I: Understanding the relationship between user and product. In M. Blythe, C. J. Overbeeke, A. F. Monk & P. C. Wright (Eds.),
Funology. From Usability to Enjoyment, part of the Human-Computer Interaction
Series book series (HCIS, Vol. 3) (pp. 31-42). Dordrecht: Kluwer Academic Publishers. https://doi.org/10.1007/1-4020-2967-5_4 (ver. 10.12.2019).
Hassenzahl, M. (2004). The interplay of beauty, goodness, and usability in interactive products. Human-Computer Interaction, 19(4), 319–349. https://doi.org/10.1207/s15327051hci1904_2 (ver. 10.12.2019).
Hassenzahl, M. (2008). User experience (ux): towards an experiential perspective on product quality. IHM ‘08: Proceedings of the 20th International Conference of the
Association Francophone d’Interaction Homme-Machine, 11–15. Metz & New
York: ACM. https://doi.org/10.1145/1512714.1512717 (ver. 10.12.2019).
Hassenzahl, M., Burmester, M., & Koller, F. (2003). AttrakDiff: Ein Fragebogen zur Messung wahrgenommener hedonischer und pragmatischer Qualität. In G. Szwillus & J. Ziegler (Eds.), Mensch & Computer 2003. Interaktion in Bewegung, (pp. 187-196). Wiesbaden: Springer Vieweg Verlag.
Hassenzahl, M., & Tractinsky, N. (2006). User Experience – A Research Agenda.
Behaviour and Information Technology, 25(2), 91–97.
https://doi.org/10.1080/01449290500330331 (ver. 10.12.2019).
Heikkinen, J., Olsson, T., & Väänänen-Vainio-Mattila, K. (2009). Expectations for user experience in haptic communication with mobile devices. Proceedings of
MobileHCI 2009 (article No. 28). Bonn & New York: ACM. https://doi.org/10.1145/1613858.1613895 (ver. 10.12.2019).
ISO. International Organization for Standardization (1999). Human-centred design
processes for interactive systems. ISO 13407:1999.
https://www.iso.org/standard/21197.html (ver. 10.12.2019).
ISO. International Organization for Standardization (2010). Ergonomics of human-system
interaction: Part 210: Human-centred design for interactive systems. ISO
Jordan, P. W. (2000). Designing pleasurable products: An introduction to the new human
factors. London: Taylor & Francis.
Kankainen, A. (2003). UCPCD: User-Centered Product Concept Design. Proceedings of
the 2003 conference on Designing for user experiences (DUX ‘03) (pp. 1-13). San
Francisco, CA, USA. https://doi.org/10.1145/997078.997087 (ver. 10.12.2019). Karapanos, E. (2010). Quantifying diversity in user experience. Eindhoven: Technische
Universiteit Eindhoven. https://doi.org/10.6100/IR658635 (ver. 10.12.2019). Karapanos, E., Hassenzahl, M., & Martens, J.-B. (2008). User experience over time.
Proceeding of CHI EA 08 Extended Abstracts on Human Factors in Computing
Systems (pp. 3561-3566). Florence, Italy.
https://doi.org/10.1145/1358628.1358891 (ver. 10.12.2019).
Karapanos, E., Zimmerman, J., Forlizzi, J., & Martens, J.-B. (2010). Measuring the dynamics of remembered experience over time. Interacting with Computers, 22(5), 328–335. https://doi.org/10.1016/j.intcom.2010.04.003 (ver. 10.12.2019).
Kuutti, K. (2010). Where are the Ionians of user experience research? Proceedings of the
6th Nordic Conference on Human-Computer Interaction: Extending Boundaries
(NordiCHI ‘10) (pp. 715-718). Reykjavik, Iceland.
https://doi.org/10.1145/1868914.1869012 (ver. 10.12.2019).
Law, E., Roto, V., Hassenzahl, M., Vermeeren, A., & Kort, J. (2009). Understanding, scoping and defining UX: a survey approach. Proceedings of the ACM conference
on human factors in computing systems (CHI 2009), Boston, MA, USA.
https://doi.org/10.1145/1518701.1518813 (ver. 10.12.2019).
Mugge, R., Schifferstein, H. N. J., & Schoormans, J. P. L. (2006). Product Attachment and Product Lifetime: The role of personality congruity and fashion. In K. M. Ekstrom & H. Brembeck (Eds.), European Advances in Consumer Research 7 (pp. 460-467). Goteborg, Sweden: Association for Consumer Research.
Norman, D. A., Miller, J., & Henderson, A. (1995). What you see, some of what’s in the future, and how we go about doing it: HI at Apple computer. Proceedings of CHI
1995 (p. 155). Denver, CO, USA. https://doi.org/10.1145/223355.223477 (ver. 10.12.2019).
Roto, V., Rantavuo, H., & Väänänen-Vainio-Mattila, K. (2009). Evaluating User Experience of Early Product Concepts. Proceedings of International Conference
on Designing Pleasurable Products and Interfaces (DPPI 09) (pp. 13-16).
Compiegne, France.
Tractinsky, N., Katz, A. S., & Ikar, D. (2000). What is beautiful is usable. Interacting with
Computers, 13(2), 127–145. https://doi.org/10.1016/S0953-5438(00)00031-X (ver. 10.12.2019).
Vermeeren, A. P. O. S., Law, L-C. E., Roto, V., Obrist, M., Hoonhout, J., & Väänänen-Vainio-Mattila, K. (2010). User experience evaluation methods: current state and development needs. Proceedings of the 6th Nordic Conference on
Human-Computer Interaction: Extending Boundaries (NordiCHI ‘10) (pp. 521-530).