DOCUMENTS DE TREBALL
DE LA FACULTAT DE CIÈNCIES
ECONÒMIQUES I EMPRESARIALS
Col·lecció d’Economia
Agglomeration and labour productivity in Spanish industry:
a long-term analysis
Julio Martínez-Galarraga*, Elisenda Paluzie+, Jordi Pons+
and Daniel A.Tirado*
(*) University of Barcelona (+) CAEPS, University of Barcelona
Adreça correspondència:
Departament d´Història i Institucions Econòmiques Facultat de Ciències Econòmiques i Empresarials Julio Martínez-Galarraga Universitat de Barcelona Email.- [email protected]
Departament de Teoria Econòmica, i CAEPS Facultat de Ciències Econòmiques i Empresarials Universitat de Barcelona
Av. Diagonal 690
08034 Barcelona (Spain)
Abstract:
This paper analyzes the relationship between spatial density of economic activity and interregional differences in the productivity of industrial labour in Spain during the period 1860-1999. In the spirit of Ciccone and Hall (1996) and Ciccone (2002), we analyze the evolution of this relationship over the long term in Spain. Using data on the period 1860-1999 we show the existence of an agglomeration effect linking the density of economic activity with labour productivity in the industry. This effect was present since the beginning of the industrialization process in the middle of the 19th century but has been decreasing over time. The estimated elasticity of labour productivity with respect to employment density was close to 8% in the subperiod 1860-1900, reduces to a value of around 7% in the subperiod 1914-1930, to 4% in the subperiod 1965-1979 and becomes insignificant in the final subperiod 1985-1999. At the end of the period analyzed there is no evidence of the existence of net agglomeration effects in the industry. This result could be explained by an important increase in the congestion effects in large industrial metropolitan areas that would have compensated the centripetal or agglomeration forces at work. Furthermore, this result is also consistent with the evidence of a dispersion of industrial activity in Spain during the last decades.
JEL Classification: R1; O4; N12
Keywords: Agglomeration economies, regional disparities, Spanish Economic History
Resum:
Aquest article analitza la relació entre la concentració geogràfica de l’activitat econòmica i les diferències interregionals en la productivitat del treball industrial a Espanya durant el període 1860-1999. Seguint a Ciccone i Hall (2002) i Ciccone (2002), s’analitza l’evolució a llarg termini d’aquesta relació a Espanya. Utilitzant les dades del període 1860-1999, mostrem la existència d’un efecte d’aglomeració que connecta la densitat de l’activitat econòmica amb la productivitat del treball en la indústria. Aquest efecte era present des del començament del procés d’industrialització a meitat del segle XIX. Però ha anat disminuint gradualment. L’elasticitat estimada de la productivitat del treball respecte a la densitat de contractació era propera al 8% en el subperíode 1860-1900, es va reduir a un valor del
voltant del 7% en el subperíode 1914-1930, al 4% en el subperíode 1965-1979, i esdevé insignificant al final del subperíode 1985-1999. A la fi del període analitzat, no hi ha evidència de l’existència d’efectes nets d’aglomeració en la indústria. Aquest resultat es podria explicar per un important increment dels efectes de la congestió en les grans àrees metropolitanes industrials que haurien compensat les forces centrípetes o d’aglomeració en la feina. A més aquest resultat és també consistent amb l’evidència de la dispersió de l’activitat industrial a Espanya durant les darreres dècades.
1. Introduction
Over the last two decades, the theoretical and empirical advances of the new economic geography (NEG) have opened up new prospects for the study of economic agglomeration. On the theoretical side, models have been developed to explain the emergence of industrial agglomerations in a market structure characterised by monopolistic competition.1 On the empirical side, the advances can be seen in the analysis of industry’s location decisions, in the identification of which sectors are characterised by higher concentrations of activity, and in the study of the factors determining spatial concentration.2
Paralleling such recent NEG developments, the field of economic history has advanced as well, using the lens provided by NEG to refocus on the early stages of industrialisation. In most instances, it appears, industrialisation occurred in step with advances in the integration of national economies. Industrialisation also brought with it marked productive specialisation in the regions where it occurred. From a geographic perspective, in fact, industrialisation in the 19th century generated significant regional disparities that fostered the rise of a limited number of industrial clusters.3 For this reason, the empirical analysis of these historical cases provides an excellent vantage point from which to observe the relative weight of the forces that have shaped the geographic pattern of today’s countries.
In fact, that has been the principal motivation of a series of recent papers in quantitative economic history. In line with NEG proposals, these papers have conducted analyses of the role of agglomeration economies in determining regional specialisation of production in a number of historical cases of industrialisation. Examples include
1 Recent surveys of theoretical work in the field can be found in Fujita, Krugman and Venables (1999)
and in Ottaviano and Thisse (2004).
2 A good summary of the empirical approximations of agglomeration processes, according to the NEG
framework can be found in Head and Mayer (2004).
3 The emergence of sharp regional disparities during the early stages of development has been addressed
4
Kim (1995, 1998) on the US case; Tirado, Paluzie and Pons (2002) and Rosés (2003) on the Spanish case; Crafts and Mulatu (2005) regarding the UK, and Wolf (2006) regarding reunified Poland after World War I. In each of these cases, evidence has been put forward in relation to regional specialisation of production, as well as to the concentration of industrial activity, and the factors determining that. In summary, all of these studies have set out evidence supporting the presence of agglomeration economies in the industrial sector during the period. In addition, these agglomeration economies appear to have developed in step with the growing integration within various national economies, acting as a source of the sharp disparities among the affected regions.
This group of papers, however, is not in agreement as to the importance of this view compared to alternative explanations. Nor do these papers coincide in specifying when agglomeration economies began to be important or, once in play, when their explanatory power started to decline. Thus, Kim (1995) has identified the presence of economies of scale as determinants of long-term specialisation in US states. Nevertheless, he has pointed to the different relative endowments among regions as the basic element in the determination of regional specialisation of production. Crafts and Mulatu (2005) have analysed the British case and addressed the interaction between market size and economies of scale. Although the interaction may have influenced industrial specialisation in some regions, they found that this had stopped having any serious effect prior to World War I.
On the other hand, Rosés (2003) has argued in favour of a ‘home market’ effect to explain regional specialisation of production in Spain in the early stages of industrialisation, in the mid-19th century. Tirado, Paluzie and Pons (2002) have reinforced this view and supported the notion that this factor redoubled in importance as the Spanish economy was integrated in the course of the second half of the 19th century and the early years of the 20th century. Along similar lines, Wolf (2006) highlights the impact of the market-size effect in understanding the changes brought about by regional specialisation of production in newly reunified Poland after World War I.
In short, this literature fails to give precise answers to questions such as: Were agglomeration economies more important in the early stages of industrialisation? Did
agglomeration forces lose their explanatory power in the course of the last century and, if so, when did they start losing this potential? Do they still act as economic forces shaping productivity differentials across regions? Finding answers to these questions will require studies to be carried out, focusing on the determinants of industrial agglomeration that best provide a long-term perspective. Nonetheless, this first set of papers on economic history based on NEG have, with the exception of Kim (1995), only analysed evidence relating to the period prior to World War II.
NEG formulations predict that, in agglomeration economies, there will be a relationship between falling transport costs and the level of concentration of economic activity in a defined geography, leading to marked industrial specialisation.4 However, the models also indicate that this relationship may follow an inverted-U curve along the integration process of a given economy. In that case, the early stages would be accompanied by growing economic disparities across the space, while later advances would cause such disparities to diminish.5 Disparities would lessen as agglomeration forces are undermined by reductions in transport costs and offset by dispersion forces related to the congestion in large industrial clusters.
In these circumstances, this paper takes as its starting point descriptive evidence of regional economic disparities in Spain as they evolved from the mid-19th century to the close of the 20th century. It analyses the role played by agglomeration economies in creating those disparities and sets out to specify their relevance over time. To do so, the analysis in this paper addresses one of the empirical implications of agglomeration on production processes: the relationship between the spatial density of economic activity and inter-regional differences in industrial labour productivity.
4 This relationship appears in a seminal paper along this line of theoretical analysis (Krugman, 1991). 5
Puga (1999) formalises this relationship in a model that analyses a process of global economic integration, in which congestion costs are generated by a fixed production factor in the context, namely labour.
6
Analysis directly linked to the one carried out here has been undertaken by Ciccone and Hall (1996) and Ciccone (2002) for the case of the US counties and for the regions of France, Germany, Italy, Spain and the UK in the 1980s respectively. The aim of this paper is to identify any agglomeration effect linking the density of economic activity with industrial labour productivity, using data for the Spanish regions covering the period 1860-1999. Hence, this paper widens the time frame analysed with respect to previous studies and sets out to furnish evidence that may establish shifts in intensity owing to this relationship throughout the process of integration and regional specialisation of production.
The findings show that this effect has been present since the beginning of the Spanish industrialisation process in the mid-19th century but has been decreasing over time. The estimated elasticity of labour productivity with respect to employment density was close to 8% in the sub-period 1860-1900. It fell to a value of around 7% in the sub-period 1914-1930, and to 4% in the sub-period 1965-1979. Then it became insignificant in the final sub-period 1985-1999. At the end of the period analysed, there was no evidence of the existence of net agglomeration effects in industry.
These findings complement the results of earlier studies and bring a fresh perspective to the descriptive evidence that different authors have offered on the evolution of specialisation patterns by sectors, in the Spanish regions (Paluzie, Pons and Tirado, 2004). From their results, the spatial concentration of economic activity seems to have followed an inverted-U curve. This is characterised in the first stage by rising concentration of economic activity in the territory until, potentially, the 1970s, followed by a second stage of moderate reductions in concentration levels. The results obtained in this paper indicate that agglomeration strongly affected industry in the first stage, while the intensity of these effects began to decline early in the 20th century and, by the second stage, were non-existent.
The remainder of the paper has the following structure. Section 2 provides a review of the existing evidence on the evolution of regional disparities in the distribution of industrial activity in the course of the integration of the Spanish home market, starting in the mid-19th century. Section 3 puts forward the basic model that
provides the theoretical underpinnings for the empirical analysis. Section 4 presents descriptive evidence of evolving industrial labour productivity throughout the period 1860-1999, along with some descriptive evidence on the potential relationship between changes in productivity and density across the geographic space. In addition, Section 5 offers the methodology and the results obtained in the empirical analysis. Lastly, the final section concludes with comments on the main implications of the findings.
2. The geographical patterns of industrial development: the Spanish experience
Table 1 shows the evolution of the Gini indices for geographical concentration of industry throughout the period 1860-1999 reported in Paluzie, Pons and Tirado (2004). These indices have been built at a level of regional aggregation that corresponds to NUTS-3 (Spanish provinces), and they use a sectoral division of manufacturing that has remained constant throughout the period analysed.
Table 1. Gini Indices
1856 1893 1913 1929 1955 1975 1995
NUTS-3 0.44 0.60 0.68 0.78 0.64 0.68 0.63
Source: Paluzie, Pons and Tirado (2004)
The first impression from this snapshot of the evolution of the Gini indices is that the geographical concentration of industrial production grew over the period 1856-1929, then fell sharply in the years following the Spanish Civil War. However, once the immediate post-war period was over, a new phase again led to growing disparities in the distribution of industrial activity over the territory, between 1955 and 1975. Then the final 20 years of the century saw a slight easing off.
This suggests, by way of hypothesis, that the indicators of industrial clustering during the development of the Spanish economy evolved, broadly speaking, in accord with the propositions of the NEG literature, namely regarding the relationship between
8
transport costs and agglomeration. Firstly, taking the starting point for Spanish industrialisation and development as the mid-19th century, the early stages saw production techniques from the first industrial revolution gain widespread use. They spread from pioneering sectors, such as the cotton textile industry, to a wide range of industrial and consumer goods. In turn, this led to the emergence of internal and external economies of scale in a wide range of manufacturing sectors.
Secondly, the Spanish home market during this period became increasingly integrated as a result of strong investment in railway infrastructure, the unification of the monetary system around the peseta and various financial innovations like a system of free transfers between the branches of the Bank of Spain. Together these factors favoured lower inter-regional transaction and transport costs. Moreover, until the 1890s, the integration of the home market was accompanied by a growing level of openness in the Spanish economy that also helped initiate the process.
Under these conditions, the Spanish case affords an example of how growth in the number and size of sectors subject to agglomeration economies and reductions in inter-regional transport costs, taken together, favour regional specialisation of production and industrial clustering in a limited number of places.6
Civil war and the early years of the Franco dictatorship, however, brought a halt to economic growth in Spain and to the development of transport and communication infrastructure. The Spanish economy found itself closed off from the rest of the world. While the lack of data sources for the 1940s makes it difficult to carry out any precise analysis of the implications of such changes on the distribution of economic activity over the territory, it seems reasonable to assume that these factors may lie at the root of the reversals seen in the cluster indicators for industrial production during those years.
From the mid-1950s, however, the Spanish economy regained its positive momentum and began to grow again. The literature links this to a handful of factors: the full-scale adoption of the production innovations of the second technological
6
A specific analysis of the factors determining the rise in the geographical concentration of industry during this period can be found in Tirado, Paluzie and Pons (2002).
revolution; deregulation in production sectors; fresh investment in infrastructure; and reopening the economy to the outside world. Within the framework of NEG modelling, a reasonable hypothesis to put forward in this case would be that the new economic scenario served to unleash the subsequent advances in industry concentration, registered in Spain between the mid-fifties and the mid-seventies.
The same modelling, however, indicates that progress from growing agglomeration, although keyed to the process of economic integration, is subject to limits such as those which would, for example, give rise to congestion costs in the affected regions. Factors of this sort would slow down regional specialisation of production and favour the development of an inverted-U curve in the relationship between falling transport costs and the concentration of industrial activity in a given geography. In Spain, this relationship began to switch direction in the mid-seventies.
Therefore, evidence regarding the evolution of industrial concentration in Spain over the recent period may be explained by considering both the factors favouring agglomeration economies in production processes and also how these forces grow weaker once very high levels of regional economic integration are achieved. That is the hypothesis considered by this paper, following arguments based on NEG models. Analysis of this hypothesis forms the paper’s core, and it is carried out according to the subsequent steps. Firstly, following Ciccone (2002), a model is put forward for working out one of the empirical implications of agglomeration economies: the existence of a relationship between the density of economic activity in a given region and the factor productivity. Secondly, descriptive evidence is given for the evolution of these variables in the Spanish economy for the period 1860 to 1999. Finally, an analysis of the relationship between the variables is carried out for specific sub-periods between 1860 and 1999.
10
3. The model
Consider Ciccone’s (2002) model of spatial externalities arising from to the density of economic activity.7 Denote the production function of a kilometre of land in region s by: ); , ; , ( s s s f nH k Q S q=Ω (1)
where q is output per square km, n is employment per square km, H is the average level of workers’ human capital per square km, k is the amount of physical capital used per square km, and Ωsis an index of total factor productivity in the region. Lastly, Qs and
Ss are the region’s total output and total area, respectively, and are used to capture the
spatial externalities.
In the empirical section of the paper, the premise is that spatial externalities are caused by the density of production in a given region (Qs/ Ss), and that the elasticity of
output per square km is constant with respect to this production density. That gives the following equation: (λ λ) α β β / ) 1 1 ) ) (( ) , ; , ( − − ⎟⎟ ⎠ ⎞ ⎜⎜ ⎝ ⎛ Ω = Ω = s s s s s s S Q k nH S Q k nH f q (2)
where 0≤α≤1 captures the returns to capital and labour per square km, 0≤β ≤1 is a distribution parameter and (λ-1)/ λ is a constant representing the elasticity of output per square km relative to the regional density of production. Hence, according to this formulation, positive spatial externalities only exist if λ >1.
To obtain an equation that is estimable at the regional level, it is necessary to assume that the distribution of labour and capital is uniform within each region. The implication of this assumption is that aggregate production Qs may be expressed as
7 This model is a variant of the one proposed by Ciccone and Hall (1996), which used a more flexible
follows: (λ λ) α β β / 1 1 ) ) / ( ) / (( − − ⎟⎟ ⎠ ⎞ ⎜⎜ ⎝ ⎛ Ω = = s s s s s s s s s s s S Q S K S H N S q S Q , where Ns is total
employment in the region, Hs is the average level of workers’ human capital in the
region, and Ks is the total amount of physical capital used there. Average labour
productivity may thus be isolated as follows:
1 1− − ⎟⎟ ⎠ ⎞ ⎜⎜ ⎝ ⎛ ⋅ ⎟ ⎟ ⎠ ⎞ ⎜ ⎜ ⎝ ⎛ ⎟⎟ ⎠ ⎞ ⎜⎜ ⎝ ⎛ ⋅ ⋅ Ω = αλ αλ β β λ s s s s s s s s S N N K H N Q (3)
This equation can then be simplified under the assumption that returns to capital, r, are
the same in every region in the country. Using equation (2), the capital demand function can be obtained as follows:
s
s Q
r
K =α(1−β) (4)
By substituting the capital demand function for the amount of capital in equation (3), average labour productivity can be shown as follows:
θ ω ⎟⎟ ⎠ ⎞ ⎜⎜ ⎝ ⎛ ⋅ ⋅ ⋅ Ω ⋅ Λ = s s s s s s s S N H H N Q (5)
where is a constant dependent on returns to capital in the country, ω is another constant, and: Λ ) 1 ( 1 1 β αλ αλ θ − − − = (6)
The variable θ measures the effect of the region’s density on its productivity. Density will have a positive effect on the average labour productivity of the region only if the positive externalities at a regional level offset the congestion effects so that αλ > 1. In addition, the greater (1-β) is, the greater θ will be. That occurs due to the
12
assumption that physical capital flows to the most productive regions. Consequently, an increase in total factor productivity caused by a rise in employment density will lift average labour productivity in the region and that, in turn, will be reinforced by an inflow of physical capital. This effect will be greater, the greater (1-β) is. Following Ciccone (2002), we will call θ the agglomeration effect.
An estimable equation can be obtained by taking the logarithms of equation (5): ) log (log log ) 1 ( log log log logQs − Ns = Λ+ω Ωs + θ + Hs +θ Ns − Ss (7)
In this case, the parameter θ measures the percentage change in labour productivity caused by unit variation in employment density. That is, it shows the elasticity of labour productivity with respect to labour density.
In the empirical analysis, dummy variables are used to control for differences in the returns to capital and in total factor productivity that are exogenous to the different regions.
Moreover, we have time series data. Therefore, the equation to be used is:
st st st
st st
st N Dummyregional iables H N S u
Q −log = var + log + (log −log )+
log γ θ (8)
where Qst, total industrial output in region s at time t is the region’s gross value-added
(GVA); Hst, human capital in region s at time t is average years of schooling in the
region; Nst is total industrial employment in region s at time t; and Sst is the area of
region s in square km. The resulting equation thus directly relates regional productivity (measured by GVA per employee) to employment density in the region (employment per square km) taking into account the region’s stock of human capital and other features of the region represented by the dummy regional variables.
The described model captures spatial externalities within the regions. However, spatial externalities can easily spill over regional boundaries. Hence, we must allow for
the spatial externalities of each region being partially caused by the industrial production density of neighbouring regions. It follows that, if total factor productivity
in region s depends on the density of regions neighbouring s, then:
s Ω μ φ ⎟⎟ ⎠ ⎞ ⎜⎜ ⎝ ⎛ ⋅ = Ω sv sv s s S Q (9)
where φs is the total productivity of factors exogenous to region s, and Qsv and Ssv stand
for total output and total area in the regions neighbouring s. Combining equation (9)
with (7) and (8), the following equation is obtained:
st st st svt svt st t s st u S N S Q H iables nal Dummyregio N Q + − + − + + = − ) log log( ) log (log log var log log θ ωμ γ (10)
Estimating equation (10) shows the relationship between industrial regional productivity (measured by GVA per employee) and regional employment density (industrial employment per square km), taking into account a region’s stock of human capital, other regional features represented by the dummy regional variables, and the production density in neighbouring regions.
4. Data and descriptive evidence
This study draws on data relating to industrial output, working-age population in the industrial sector, size by area, and human capital stock. The level of data disaggregation corresponds to the Spanish provinces (NUTS-3) and refers to several points of time during the period 1860-1999.
This paper follows the methodology proposed by Geary and Starks (2002) for estimating British GNP by region and similarly, uses the estimation carried out by Martínez-Galarraga (2006) for the pre-Spanish Civil War period in order to build estimations of Spanish industrial GVA by province for the years 1860, 1900, 1914 and 1930. Regarding the post-war years, such data has been compiled from information
14
provided by the BBVA (1999 and 2000). In particular, in the case of industrial GVA information by region, data are provided at eight points in time: 1965, 1969, 1975, 1979, 1985, 1989, 1995 and 1999.8
Employment data by province for the industrial sector have been built up for the period 1860 to 1930, inclusive, based on Spanish census data gathered in census years. For the period after the Civil War, the pertinent data comes from information provided by the BBVA (1999 and 2000) under the heading of employment in the industrial sector in the relevant years.
Data on human capital stock for the pre-war period has been estimated using regional literacy rates gathered by Núñez (1992). For the years 1964-1999, the variable has been estimated for each province by taking the average education in years as gathered by Mas, Pérez, Serrano, Soler and Uriel (2002). Lastly, information on the area size of the provinces of Spain comes from the Statistical Yearbook of Spain and uses only data on the 47 continental provinces, leaving aside the Balearic Islands, the Canary Islands, Ceuta and Melilla.
The database implemented to carry out this study makes it possible to analyse various aspects of the disparities in the distribution of productivity and density of industrial activity in the Spanish regions throughout the 140 years under study. Thus, table 2 sets out the evolution of two synthetic indicators of that disparity across the Spanish provinces in terms of output per working-age employee in the industrial sector. The first column shows values for the coefficient of variation for this variable among the 47 provinces analysed. The second column shows the relative distance, in terms of productivity, between the five provinces located at one extreme of the distribution and the five at the other extreme.
8
The information provided by the BBVA on manufacturing GVA begins in 1955. However, relevant data for the decade 1955-1964 have not been used in this study because the information for other factors (such as human capital stock) is not available for that period.
Table 2. Regional industrial GVA/Industrial Workforce Coefficient of Variation Top 5 /Bottom 5
1860 0.16 1.85 1900 0.20 2.09 1914 0.11 1.44 1930 0.14 1.70 1965 0.17 1.80 1975 0.21 2.01 1985 0.20 1.95 1999 0.28 2.31
Source: own preparation. (See text for further explanation.)
At the outset, industrialisation and the growing levels of geographical concentration of manufacturing output running parallel to it (see table 1) led to sharp rises in regional productivity differences along the second half of the XIXth century (1860-1890). However, during the first third of the 20th century, namely the period prior to the Civil War, this disparity in the regional distribution of productivity did not follow a growing pattern. For the indicators relating to the years 1965 and 1975, however, a marked growth in regional disparity was again in evidence. It corresponded to the new boost given by the concentration of production in the territory, experienced during the period 1965-1975. Nevertheless, a relative maximum was reached in 1975. Subsequently, regional disparities began to narrow as redistribution of industrial activity began to occur in the territory. This continued until 1985. Finally, with Spain’s entry in the EEC in 1986, productivity disparities among provinces again began to widen. This, however, did not reflect any change in the concentration of production in the territory.
The evolution of inter-regional disparities in industrial output per working-age population, as described in the paragraph above, is accurate whether the analysis is carried out on the entire distribution or limited to the two extremes of the distribution. In other words, the description also holds if only the five most productive provinces are compared to the five least productive ones.
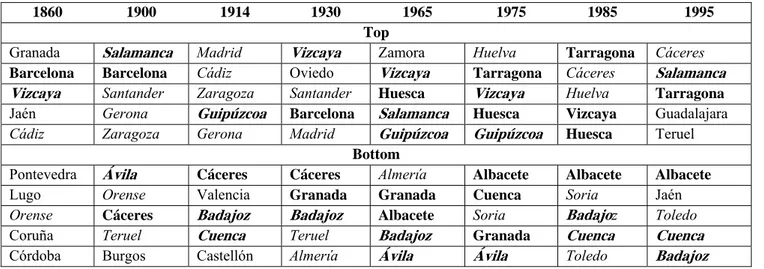
Table A.1 in the appendix lists the provinces occupying the top and bottom five positions for each period of time. In addition, the table highlights in bold any provinces that held positions at the top or the bottom of the ranking, respectively, during three or more of the analysed time periods. (Provinces appear in bold and cursive if they held
16
such positions both before and after the Civil War.) If a province only appeared twice in either of the two rankings, its name is printed in cursive. If it appeared only once, normal lettering is used.
Two key ideas may be drawn from an interpretation of the table. Firstly, there is apparent stability in the productivity rankings with respect to provinces holding positions at the top and the bottom. What is more, many of the provinces at the extremes can be found there both before and after the Civil War. Secondly, there is a geographic pattern to the distribution of productivity in the territory. Outlying provinces (particularly the Basque and the Catalan) dominate the upper reaches of the table, while the lower ranks of the table are held by those from the interior of the peninsula (such as the provinces of Castilla-La Mancha and Extremadura).
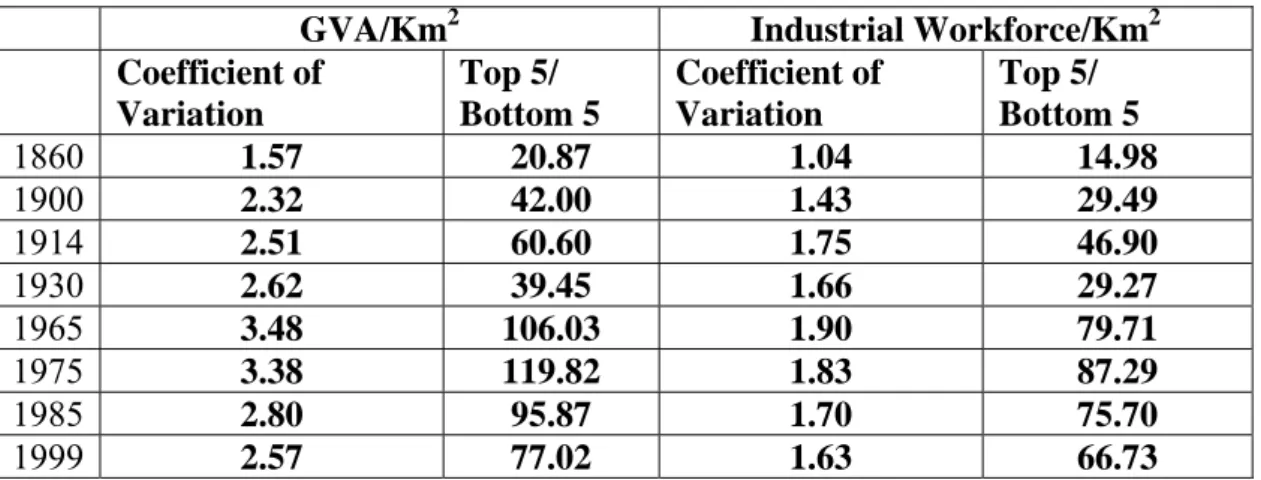
Turning to the distribution of industrial activity by province, a number of important characteristics may also be drawn from the information gathered. In particular, table 3 provides data on density by province in terms of both industrial GVA per square km and also employment in the industrial sector per square km. In addition, two different indicators of the disparity in the distribution of the variables are displayed: the coefficient of variation and the ratio between the density of the top five and bottom five ranked provinces in terms of industrial production density.
Table 3. Indicators of Industrial Density
GVA/Km2 Industrial Workforce/Km2
Coefficient of Variation Top 5/ Bottom 5 Coefficient of Variation Top 5/ Bottom 5 1860 1.57 20.87 1.04 14.98 1900 2.32 42.00 1.43 29.49 1914 2.51 60.60 1.75 46.90 1930 2.62 39.45 1.66 29.27 1965 3.48 106.03 1.90 79.71 1975 3.38 119.82 1.83 87.29 1985 2.80 95.87 1.70 75.70 1999 2.57 77.02 1.63 66.73
Source: own preparation. (See text for further explanation.)
From the information shown in the table above, the disparities in industrial concentration are obviously greater than those for productivity. For example, in the
time period showing the least observed difference, it can be seen that the average concentration in the five provinces of greatest density, taken as employment per square km in the sector, is 14.98 times greater than the same measure for the five least dense provinces. At its greatest, the ratio reaches a value of 87.29. As regards the density variable expressed by GVA per square km, the differences are even greater. The lowest ratio is 20.87, while the highest is 119.82.
A second feature to highlight is the way that the disparity in the distribution of industrial concentration has evolved among the Spanish provinces. If the disparity is estimated in terms of GVA per square km, its growth is apparent from the mid-19th century (1860) until either 1965, when it reached its absolute maximum (in the case of the coefficient of variation), or until 1975 (in the case of the ratio between provinces with the greatest density and those with the least). From that point until 1999, the variable diminished. Moreover, this overall profile holds, broadly speaking, whichever variable is used to estimate levels of industrial concentration by province.9 The resulting evolution has an inverted-U shape and, it must be pointed out, accurately reflects the indicators of geographic concentration of industrial production set out on the previous pages. It can also be explained in the context of the predictions of certain NEG models summarised in the introduction.
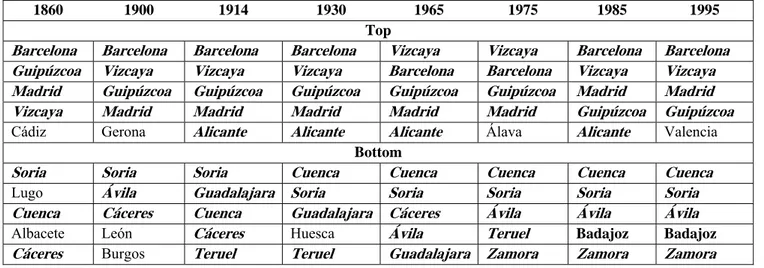
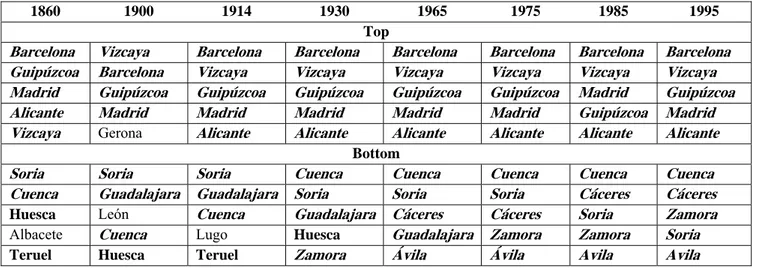
Tables A2 and A3 in the annex highlight which provinces are found at the top and bottom ends of the distribution. Firstly, the geographic pattern emerges more prominently than it did in the case of productivity per worker. The provinces of greatest density (except for Madrid) are fundamentally peripheral provinces, while the lowest density appears in the interior provinces. Secondly, a high degree of consistency is evident in the composition of the top five and bottom five provinces for each slice of time analysed. Barcelona, Vizcaya, Guipúzcoa and Madrid occupy top-five positions in all the time periods. On the other hand, the list of the five provinces ranked as those with least density is not so stable. Nonetheless, provinces such as Soria, Cuenca,
9
The sole exception is the falling disparity for the period 1914-1930, when density is estimated based on the working-age population. The reason for this difference could be related to significant changes which were made to the criteria used to record occupations between the census of 1910 and subsequent ones.
18
Cáceres and Ávila hold bottom-five places in periods both before and after the Civil War. Once again, the foregoing conclusions hold regardless of the variable expressing the density of industrial activity.
In short, the magnitude of regional disparities may differ when measured by productivity per worker or by density of industrial output; however, the two measures do seem to have points in common as well, such as the consistency in the top-five and bottom-five lists of provinces and the emergence of a certain geographic pattern.
In any case, this paper’s main focus of interest is to verify the existence of agglomeration economies in production processes and to determine what impact they may have had on the distribution of manufacturing in the territory. The analysis addresses one of the empirical implications of agglomeration economies: the presence of a relationship between spatial density of economic activity and inter-regional differences in the productivity of industrial labour. For this reason, prior to carrying out the empirical analysis, it would interesting to find, in broad terms, whether any relationship exists between the values for (a) the productivity per employee in the industrial sector, by Spanish province, in each of the time periods and (b) the density of industrial activity by province in those time periods.
With the aim of checking whether such a relationship exists, figure A1 is a scatter diagram of the evolution of the values associated with the two variables across all the time periods analysed.10 The information displayed in the figure supports the hypothesis, revealing a marked positive relationship between the study’s two main variables, over the entire extent of the period analysed. The provinces of greatest density similarly achieve the highest levels of productivity per worker. A specific analysis of this relationship is carried out in the next section, based on the theoretical model presented in the previous section and aimed at determining the magnitude of the
10 In particular, the variable used in the diagram to approximate regional density of industrial activity is
GVA/Km2. The resulting picture matches the picture that would be obtained using the alternative variable
instead: working-age population per square km in the industrial sector. In fact, this alternative variable is used in the empirical analysis in the next section.
relationship as well as the extent of any variations in its intensity throughout the entire period analysed.
5. Empirical analysis
Following Ciccone (2002), this estimation makes use of two strategies of empirical analysis in examining the relationship between the productivity and the density of industrial activity in Spain. The first strategy involves estimating equations (8) and (10) using ordinary least squares (OLS). The second strategy uses the instrumental variables method. The reason for using the latter approach is because density (the explanatory variable) could also be a consequence, and not solely the cause of, higher levels of productivity. Thus, if regional fixed effects in the estimation do not capture exogenous differences in total factor productivity among provinces and if the provinces with the highest total factor productivity attract more workers, then an estimation using OLS will give inconsistent estimators. Therefore, to obtain consistent estimators, it is necessary to employ the instrumental variables (IV) method.
From this point, regional employment density is instrumented by using total size of province by area, as used by Ciccone (2002). This variable has a significant negative correlation to employment density. In 1833, the drawing of Spanish provincial boundaries set equality of population size as a criterion. For that reason, the total area size of a province may be instrumented for its employment density. When using equation (10), account must also be taken of the production density of neighbouring provinces as an endogenous variable. The instrument used to capture this effect is the arithmetic average of the area size of neighbouring provinces.
As noted earlier, this paper aims to analyse whether the effects of agglomeration vary in extent or explanatory power in the Spanish case, based on data from four of the sub-periods into which the sample may be broken down: 1860-1900, 1914-1930, 1965-1979 and 1985-1999. For each of the first two sub-periods, 94 observations are used (2 years for 47 provinces). For the latter two, the greater availability of information allows for use of 188 observations (4 years for 47 provinces).
20
Table 4 summarises the results obtained from estimating the agglomeration effects. In particular, it shows estimates of parameter θ, which measures the effect of a region’s density on its productivity and which has been called the “agglomeration effect”, once differences in educational levels and other regional fixed effects are controlled.
Table 4. Estimation Results
Period Equation (8) Equation (10)
OLS IV OLS IV 1860-1900 8.234% 5.181% (0.084) 786 . 0 2 = R N=94 7.660% (0.003) 806 . 0 2 = R N=94 5.007% (0.095) 799 . 0 2 = R N=94 (0.000) 802 . 0 2 = R N=94 1914-1930 6.977% 4.353% (0.077) 923 . 0 2 = R N=94 6.653% (0.000) 926 . 0 2 = R N=94 3.843% (0.059) 925 . 0 2 = R N=94 (0.000) 925 . 0 2 = R N=94 1965-1979 1.636% 3.671% (0.047) 954 . 0 2 = R N=188 1.717% (0,097) 954 . 0 2 = R N=188 4.108% (0.014) 953 . 0 2 = R N=188 (0.116) 955 . 0 2 = R N=188 1985-1999 -0.069% 1.180% (0.581) 728 . 0 2 = R N=188 -0.004% (0.998) 728 . 0 2 = R N=188 1.687% (0.372) 726 . 0 2 = R N=188 (0.961) 729 . 0 2 = R N=188
Source: own preparation. (See text for further explanation.)
The first aspect to highlight is that the R2 values are very high for all time periods analysed. The robustness of the result is confirmed by two factors. Firstly, the result (R2) holds regardless of the estimation strategy followed (OLS and IV). Secondly, the overall significance of the estimation is similar both when using the model that considers the existence of inter-regional externalities (equation 10) and when using the model that restricts externalities to within regions (equation 8).
A second aspect to note, when limiting the analysis to externalities within a region (equation 8) the parameter θ is, on the majority of occasions, significantly different from 0 at 10% of significance. In fact, it ceases to be so only in the estimations for the last period analysed. In addition, the estimated values reach their highest levels in the estimation for the period 1860-1900, a period in which this
elasticity was 8.23% in the OLS estimate and 5.18% in the IV estimate. From that point, however, the estimated values get progressively smaller for each subperiod analysed (6.98%–OLS and 4.35%–IV in 1914-1930; 1.63% and 3.67%, respectively, in 1965-1979).
The results derived from the estimation of the model in equation (10) (which accounts for inter-regional externalities) introduce no fundamental variations. The largest values are observed in the first of the periods analysed, and they continue to fall gradually in subsequent periods until, in the final period (1985-1999), the elasticity coefficient is no longer significantly different from 0.
In brief, it can be deduced from the results obtained that doubling employment density raises average labour productivity in the industrial sector by between 3% and 5% in all periods analysed, with the exception of the last segment from the 20th century. This would appear to constitute significant evidence of agglomeration effects. However, these effects seem to have been falling sharply from the mid-19th century until late in the 20th century, and there appears to be no positive evidence of agglomeration effects in industry in the period 1985-1999.
These findings complement previous results and provide a new perspective on the evolution of the location pattern of industry in the Spanish regions from the mid-19th century through the end of the 20th century (Tirado, Paluzie and Pons, 2002 and Paluzie, Pons and Tirado, 2001). During that period, the geographic concentration of industrial activity, as noted previously, would seem to have followed an inverted-U shape characterised by an initial phase of growing concentration of industrial production which continued until the 1970s. This phase was then followed by a second phase of moderately falling concentration levels. The results obtained in this study indicate that in this initial phase strong agglomeration effects were at work, while during the second phase these effects were weak or non-existent.
22
This paper has analysed the magnitude and evolution of agglomeration effects in the industrial sector, taken as the effect of employment density on productivity, in the provinces of Spain over the period 1860-1999. Of the two main findings, the first is that the relationship between employment density and productivity has been present in the Spanish case since the origins of industrialisation and modern growth and it should be considered, therefore, a key factor in explaining the location patterns of industrial activity in the country. The second main finding is that this factor continued to grow weaker in strength over the second half of the 20th century, particularly during its last two decades.
In other words, in relation to the questions put forward in the introduction, the findings of this paper support some recent work (Kim, 1995, Tirado, Paluzie and Pons, 2002, Rosés, 2003, Crafts and Mulatu, 2005) in pointing to the significant role of agglomeration economies in determining industrial specialisation in the context of industrialisation in the 19th century. Nevertheless, unlike the findings of a few of these studies (Crafts and Mulatu, 2005), our analysis has shown that, in the Spanish case, the significance of agglomeration effects was not limited to the period prior to World War I but, in fact, extended right through the greater part of the 20th century.
As for the diminishing importance of such effects, the results obtained may be pointing toward the existence of growing congestion effects over the period, effects which may have come to offset agglomeration effects in the final years of the 20th century, in the case of Spanish industry. Findings from earlier studies (Paluzie, Pons and Tirado, 2004) also seem to suggest the likely appearance of congestion costs in the major metropolitan areas, causing a weakening of centripetal forces (agglomeration forces) and triggering the start of a process of spatial redistribution of economic activity. However, as raised by Combes and Overman (2004), the model applied in this study estimates the net effect of density on regional productivity and cannot differentiate between agglomeration effects, which have a positive impact, and congestion effects, which have a negative impact.
By way of closing, it is worthwhile bearing in mind that the redistribution of economic activity observed in Spain in the last 25 years has been limited to the spatial
distribution of industrial production. In fact, overall activity and, in particular, service sector activity do not appear to have responded to the same dynamic. With respect to the service sector, the disparity in the distribution of production actually appears to have widened in the same time span. It would therefore be of further interest to pursue specific research into the extent of agglomeration economies in that sector, as well as their evolution over time.
References
BBVA (1999): Renta Nacional de España y su distribución provincial. Serie homogénea. Años 1955-1993 y Avances 1994-1999”, Madrid, Fundación BBVA.
BBVA (2000): Renta Nacional de España y su distribución provincial. Año 1995 y 1996-1999, Madrid, Fundación BBVA.
CICCONE, A. (2002): “Agglomeration effects in Europe”, European Economic Review 46, 213-227.
CICCONE, A. AND HALL, R. E. (1996): “Productivity and the density of economic activity”, American Economic Review 86, 54-70.
COMBES, P.P. AND OVERMAN, H. G. (2004): “The spatial distribution of economic activities in the European Union”, in HENDERSON, J.V. AND THISSE, J.F.
Handbook of Regional and Urban Economics, volume 4, Elsevier-North Holland.
CRAFTS, N. AND MULATU, A. (2005): “What explains the location of industry in Britain, 1871-1931”, Journal of Economic Geography, 5, 4, 499-518.
FUJITA M., KRUGMAN P. AND VENABLES A. J. (1999): The Spatial Economy: Cities, Regions and International Trade. The MIT Press, Cambridge.
GEARY, F. AND STARK, T. (2002): "Examining Ireland´s post famine economic growth performance", Economic Journal, 112, 919-935.
HEAD, K AND MAYER, T. (2004): “The empirics of agglomeration and trade”, in HENDERSON, J. V. AND THISSE, J. F., Handbook of Regional and Urban Economics, Volume 4, Elsevier, North-Holland, 2609-2669.
KIM S. (1995): “Expansion of markets and the geographic distribution of economic activities: the trends in U.S regional manufacturing structure, 1860-1987”,
Quarterly Journal of Economics 110, 881-908.
KIM, S. (1998): “Economic integration and Convergence: US regions, 1840-1987”, Journal of Economic History, 58, 659-683.
24
KRUGMAN, P. (1991): “Increasing returns and economic geography”, Journal of Political Economy , 99, 483-499.
MARTINEZ-GALARRAGA, J. (2006): “Una primera aproximación al PIB regional español, 1860-1930”, processed, Universitat de Barcelona.
MAS, M., PÉREZ, E., SERRANO, L., SOLER, A. AND URIEL, A. (2002):
Capital humano. Metodología y Series 1964-2001, Fundación Bancaja, INE.
NÚÑEZ, C. E. (1992): La fuente de la riqueza: educación y desarrollo económico en la España contemporánea, Madrid, Alianza.
OTTAVIANO, G. AND THISSE, J. F. (2004): “Agglomeration and Economic Geography”, in HENDERSON, J. V. AND THISSE, J. F., Handbook of Regional and Urban Economics, Volume 4, Elsevier, North-Holland, 2563-2608.
PALUZIE, E., PONS, J. AND TIRADO, D. A. (2001) “Regional integration and specialization patterns in Spain”, Regional Studies, 35, 285-296.
PALUZIE, E., PONS, J. AND TIRADO, D. A. (2004) “The geographical concentration of industry across Spanish Regions, 1856-1995”, Jahrbuch für Regionalwissenschaft (Review of Regional Research), 24, 143-160.
PUGA, D. (1999): “The rise and fall of regional inequalities”, European Economic Review, 43, 2, 303-334.
ROSES, J. R. (2003): “Why isn´t the Whole of Spain Industrialized? New Economic Geography and Early Industrialization, 1797-1910”, Journal of Economic History, 64, 4, 995-1022.
TIRADO, D.A, PALUZIE, E. AND PONS, J. (2002): “Economic integration and industrial location: the case of Spain before World War I.”, Journal of Economic Geography, 2, 343-363.
WILLIAMSON, J. G. (1965): “Regional inequality and the Process of National Development: A Description of the Patterns”, Economic Development and Cultural Change, VIII, 4, Suplement, 84.
WOLF, N. (2006): “Endowments, market potential and industrial location: evidence from interwar Poland (1918-1939)”, Explorations in Economic History, in press.
APPENDIX
Table A1. Provinces occupying the top and bottom five positions in terms of industrial output per employee
1860 1900 1914 1930 1965 1975 1985 1995 Top
Granada Salamanca Madrid Vizcaya Zamora Huelva Tarragona Cáceres
Barcelona Barcelona Cádiz Oviedo Vizcaya Tarragona Cáceres Salamanca
Vizcaya Santander Zaragoza Santander Huesca Vizcaya Huelva Tarragona
Jaén Gerona Guipúzcoa Barcelona Salamanca Huesca Vizcaya Guadalajara
Cádiz Zaragoza Gerona Madrid Guipúzcoa Guipúzcoa Huesca Teruel Bottom
Pontevedra Ávila Cáceres Cáceres Almería Albacete Albacete Albacete
Lugo Orense Valencia Granada Granada Cuenca Soria Jaén
Orense Cáceres Badajoz Badajoz Albacete Soria Badajoz Toledo
Coruña Teruel Cuenca Teruel Badajoz Granada Cuenca Cuenca
Córdoba Burgos Castellón Almería Ávila Ávila Toledo Badajoz
26
Table A2. Provinces occupying the top and bottom five positions in terms of industrial output per square km.
1860 1900 1914 1930 1965 1975 1985 1995 Top
Barcelona Barcelona Barcelona Barcelona Vizcaya Vizcaya Barcelona Barcelona
Guipúzcoa Vizcaya Vizcaya Vizcaya Barcelona Barcelona Vizcaya Vizcaya
Madrid Guipúzcoa Guipúzcoa Guipúzcoa Guipúzcoa Guipúzcoa Madrid Madrid
Vizcaya Madrid Madrid Madrid Madrid Madrid Guipúzcoa Guipúzcoa
Cádiz Gerona Alicante Alicante Alicante Álava Alicante Valencia
Bottom
Soria Soria Soria Cuenca Cuenca Cuenca Cuenca Cuenca
Lugo Ávila Guadalajara Soria Soria Soria Soria Soria
Cuenca Cáceres Cuenca Guadalajara Cáceres Ávila Ávila Ávila
Albacete León Cáceres Huesca Ávila Teruel Badajoz Badajoz
Cáceres Burgos Teruel
Source.- Own elaboration. See text.
Table A3. Provinces occupying the top and bottom five positions in terms of industrial employee per square km.
1860 1900 1914 1930 1965 1975 1985 1995
Top
Barcelona Vizcaya Barcelona Barcelona Barcelona Barcelona Barcelona Barcelona
Guipúzcoa Barcelona Vizcaya Vizcaya Vizcaya Vizcaya Vizcaya Vizcaya
Madrid Guipúzcoa Guipúzcoa Guipúzcoa Guipúzcoa Guipúzcoa Madrid Guipúzcoa
Alicante Madrid Madrid Madrid Madrid Madrid Guipúzcoa Madrid
Vizcaya Gerona Alicante Alicante Alicante Alicante Alicante Alicante
Bottom Soria
Source.- Own elaboration. See text.
Soria Soria Cuenca Cuenca Cuenca Cuenca Cuenca
Cuenca Guadalajara Guadalajara Soria Soria Soria Cáceres Cáceres
Huesca León Cuenca Guadalajara Cáceres Cáceres Soria Zamora
Albacete Cuenca Lugo Huesca Guadalajara Zamora Zamora Soria
28
Graph A1
Industrial GVA per employee vs. Industrial GVA per square km. 1860-1999
30 50 70 90 110 130 150 170 190 210 1 10 100 1000 10000