GRADUATES JOB MOBILITY: A LONGITUDINAL ANALYSIS S. Bacci, B. Chiandotto, A. Di Francia, S. Ghiselli
1. INTRODUCTION
Evaluating the internal and external effectiveness and efficiency of university education is not just a requirement for Italian universities under the current legis-lation1, but also a valuable instrument that governing bodies at various levels can use for making decisions based on adequate information. Of course, there are countless elements that go into the definition of the concepts of effectiveness and efficiency. In particular, with regard to external effectiveness, in addition to con-sidering the employment rates of graduates, it is also essential to assess the quality of the working activity carried out. This assessment must be based on an analysis of several aspects and characteristics of the job including, by way of example, in-come level, type of employment contract, leisure time availability, career oppor-tunities, geographic localization of the workplace. The latter aspect is the main focus of this article: in particular, this analysis is based on a comparison between Region of employment and Region of residence.
The goal of this analysis is to pinpoint and investigate any significant differ-ences among degree courses with respect to the phenomenon of occupational mobility and to identify individual and context-related determinants trying to es-timate their net impact. Of all the different variables that can explain the phe-nomenon under consideration, special attention was devoted to the effect of time in order to estimate mobility trends and identify possible interactions with the other covariates. This paper is a natural follow up to the analysis conducted by Bacci and Chiandotto (2007) on the same mobility-related aspects whose focus was restricted, however, to cross-sectional data. Being aware of the limitations in-herent in a cross-sectional analysis, the authors of this work investigated the phe-nomenon of occupational mobility by adopting a longitudinal approach.
This analysis draws upon the data gathered by ALMALAUREA as part of its surveys on graduates from the years 2000, 2001 and 2002 interviewed at 1, 3 and 5 years after graduation. Thanks to the high number of interviewees involved, it was possible to differentiate the analysis by type of degree course; furthermore,
1 See Ministerial Decree No. 544 of October 31st, 2007 and subsequent directorial decree no. 61
the double hierarchical nature of the data (graduates from degree courses and re-peated measurements for each graduate) suggested the use, as a suitable instru-ment of analysis, of a multilevel random-effects model.
Section 2 introduces the data set used for the analysis and discloses some pre-liminary results; Section 3 briefly reports some of the conclusions arising out of the cross-sectional analysis and, above all, points out the limitations inherent in this type of approach. Section 4 presents a first longitudinal analysis whose pur-pose is to allow a direct comparison with the findings of the cross-sectional anal-ysis. A more in-depth longitudinal analysis is described in paragraph 5 using a three-level random-effects logistic model. The article ends with a few conclusive remarks.
2. DESCRIPTION OF DATA SETS AND PRELIMINARY ANALYSIS
The data used in the analysis were obtained from the last seven ALMALAU-REA2 reports (from the 2001 to the 2007 edition3) on graduates’ employment conditions. This survey, which is conducted on a yearly basis, sheds light on the latest trends and developments on the labour market identifying the employment conditions of graduates from the universities participating in the Consortium dur-ing the first five years after graduation. For the purpose of this survey, all gradu-ates were interviewed after one, three and five years from completion of their studies; the broad range of data and information which derives from this survey provides a suitable frame of reference for conducting a full-scale longitudinal analysis. As briefly pointed out in the introduction, the analysis described in this article is restricted to the pre-reform graduates from the years 2000, 2001 and 2002 from a total of 24 Italian universities who were interviewed on all three in-terviewing sessions (at one, three and five years from graduation) and who re-ported being in employment on at least one of the three interviews: they totalled a number of 31,621 graduates from 80 different degree courses4. Only Table 1 reports data concerning the whole graduate population (34,122) from the 80 de-
2 ALMALAUREA, set up in Italy in 1994 as an Inter-University Consortium by the Observatory
of Statistics of the University of Bologna, sees the participation of a total of 53 universities repre-senting about 70% of Italian graduates and is open to collaboration with foreign universities as part of its strong international commitment. ALMALAUREA was created to be at the service of gradua-tes, universities and businesses; to achieve this goal the Consortium collects and makes available an updated documentation on the human capital educated in Italian universities and provides an online database of graduates, including those with several years of experience, to facilitate the matching of demand and supply of work on the national market as well as to boost transnational mobility. Fur-ther details on the survey methodology are available on Almalaura’s website: www.almalaurea.it.
3 Participation in the survey interviews has always been broad-based with a rate of over 85% at
one year from graduation, 80% at three years and 76% at five years. For further details on the last survey see Consorzio Interuniversitario ALMALAUREA (2008).
4 The analysis considered only degree courses with at least 10 employed graduates in one of the
TABLE 1
Employment conditions of graduates at one, three and five years from graduation, by type of degree course Graduates at 1 years Graduates at 3 years Graduates at 5 years
N. Degree course employed % employedNo. employed % employedNo. employed % employedNo.
Total graduates
1 administration 66.7 14 85.7 18 76.2 16 21
2 aerospace
engineering 78.9 75 95.8 91 94.7 90 95
3 agric. sciences and
technologies 59.0 69 76.9 90 87.2 102 117 4 agriculture 64.0 89 77.7 108 85.6 119 139 5 animal husbandry sciences 72.2 13 72.2 13 72.2 13 18 6 architecture 75.3 1,389 92.0 1,697 93.9 1,733 1,845 7 astronomy 30.4 7 52.2 12 69.6 16 23 8 banking and insurance sciences 60.0 9 73.3 11 60.0 9 15 9 banking economics 70.0 63 88.9 80 87.8 79 90
10 banking fin. and
insur. economics 50.0 27 74.1 40 83.3 45 54 11 biological sciences 43.9 362 59.4 490 71.0 586 825 12 biotechnologies 37.1 26 42.9 30 61.4 43 70 13 business economics 68.5 583 84.3 717 94.7 806 851 14 business engineering 86.6 304 95.2 334 97.2 341 351 15 chemical engineering 70.6 89 85.7 108 92.1 116 126 16 chemistry 50.5 158 63.3 198 80.2 251 313 17 chemistry and pharmac. tec. 65.7 301 79.9 366 88.4 405 458 18 civil engineering 82.5 514 92.3 575 96.5 601 623 19 communications 68.9 306 87.4 388 92.3 410 444 20 conservation of cultural heritage 68.2 165 80.2 194 86.8 210 242 21 construction engineering 87.0 168 94.3 182 97.4 188 193
22 dentistry and dental
implants 70.9 134 92.6 175 94.2 178 189 23 economics and banking 64.0 135 86.3 182 91.5 193 211 24 economics and commerce 62.7 2,456 77.6 3,042 91.0 3,568 3,919 25 economics of tourism 77.6 59 85.5 65 89.5 68 76 26 education sciences 77.4 1,114 87.5 1,260 88.2 1,270 1,440 27 electrical engineering 83.1 138 97.6 162 97.0 161 166 28 electronic engineering 79.2 528 90.7 605 95.8 639 667
29 eng. for envir. and
land-use planning 76.8 215 89.6 251 95.7 268 280
30 environmental
sciences 50.6 40 83.5 66 86.1 68 79
31 Europ. foreign
lang. and literature 65.2 15 82.6 19 87.0 20 23
32 European languages and cultures
76.2 16 71.4 15 85.7 18 21
33 food sciences and
technologies 65.0 89 78.1 107 87.6 120 137 34 foreign languages and literature 65.6 1,027 80.5 1,261 84.4 1,322 1,566 35 forestry and environ. sciences 58.3 67 78.3 90 81.7 94 115 36 forestry sciences 58.3 7 91.7 11 91.7 11 12 37 geography 85.7 12 71.4 10 100.0 14 14 38 geology 59.1 156 77.7 205 84.8 224 264 39 history 59.0 108 76.5 140 81.4 149 183
Graduates at 1 years Graduates at 3 years Graduates at 5 years N. Degree course employed % employed No. employed % employedNo. employed % employed No.
Total graduates 40 history of conserv of architectural and environ. heritage 52.8 19 83.3 30 83.3 30 36 41 industrial chemistry 53.3 72 76.3 103 83.0 112 135 42 information sciences 86.4 121 87.1 122 92.1 129 140 43 information technology 74.0 71 81.3 78 92.7 89 96 44 institutions and financial markets 50.0 5 80.0 8 90.0 9 10
45 intern. trade and curr. market economics 62.8 27 90.7 39 95.3 41 43 46 intern. and diplomatic relations 56.3 36 85.9 55 93.8 60 64 47 IT engineering 87.5 253 91.0 263 94.8 274 289
48 land-use urban and
environ. planning 72.9 35 93.8 45 93.8 45 48
49 law 29.6 1,468 58.3 2,897 84.4 4,190 4,965
50 letters 53.7 946 73.6 1,297 82.3 1,450 1,762
51 letters and literature 75.4 92 78.7 96 80.3 98 122
52 marine engineering 80.8 21 100.0 26 100.0 26 26 53 maritime and transp. economics 82.1 23 85.7 24 92.9 26 28 54 materials engineering 68.6 70 87.3 89 95.1 97 102 55 mathematics 55.5 212 74.3 284 83.2 318 382 56 mechanical engineering 82.5 613 93.5 695 97.3 723 743 57 medicine and surgery 15.4 210 23.0 313 52.0 708 1,361 58 modern foreign
lang. and literature 61.5 59 77.1 74 82.3 79 96
59 motor sciences 93.8 30 96.9 31 93.8 30 32 60 natural sciences 56.9 173 75.7 230 83.9 255 304 61 nuclear engineering 57.1 12 85.7 18 95.2 20 21 62 pedagogy 71.2 178 78.4 196 82.0 205 250 63 pharmacology 83.1 424 90.8 463 93.1 475 510 64 philosophy 51.8 290 72.5 406 78.9 442 560 65 physics 42.0 124 52.2 154 71.2 210 295 66 political economics 70.9 105 87.8 130 95.9 142 148 67 political sciences 68.8 1,399 85.4 1,737 90.2 1,834 2,034 68 psychology 55.0 880 85.8 1,372 87.9 1,405 1,599
69 public admin. and
intern. institutions 71.4 10 78.6 11 85.7 12 14 70 social services 98.0 390 97.2 387 96.5 384 398 71 sociology 67.5 52 81.8 63 92.2 71 77 72 statistics and actuarial sciences 84.2 16 100.0 19 100.0 19 19 73 statistics and business IT 81.5 22 100.0 27 100.0 27 27 74 statistics and economics 69.1 103 87.9 131 94.6 141 149 75 statistics demogr.
and social sciences 58.4 45 87.0 67 85.7 66 77
76 telecoms
engineering 75.0 141 88.3 166 96.8 182 188
77 the arts, music and
the performing arts 64.7 196 76.6 232 84.2 255 303
78 translation and interpreting 79.9 111 89.9 125 93.5 130 139 79 tropical and subtrop. agric. sciences 50.0 10 55.0 11 65.0 13 20 80 veterinary medicine 53.2 125 81.7 192 89.8 211 235 Total 59.3 20,236 76.5 26,114 86.7 29,597 34,122
gree courses under consideration and is inclusive, therefore, of those graduates who have never had a job after completion of their university studies; this choice was dictated by the need to make a more accurate assessment of differences in employment rates across the various degree courses.
Table 1 shows, for each of the 80 degree courses under investigation, the indi-cators relating to the employment rate at one, three and five years from gradua-tion. At one year from completion of the degree course, almost 60% of inter-viewed graduates declared having a paid job (with the exception of those engaged in any type of training activity, including remunerated training schemes)5; this percentages reached 76.5% at three years and as much as 87% at five years from completion of university studies. The type of degree course was found to con-tribute in varying degrees to the above results: on the one hand there are degree courses whose graduates report high rates of employment as early as one year af-ter completion of their education (in particular several degree courses from the engineering grouping, but also from the social services, motor sciences, pharma-cology, groupings with employment rates of over 80 per cent at one year after graduation) and, on the other hand, there are degree courses whose graduates typically take longer to find an employment (medicine and surgery, law, but also some courses in the sciences grouping).
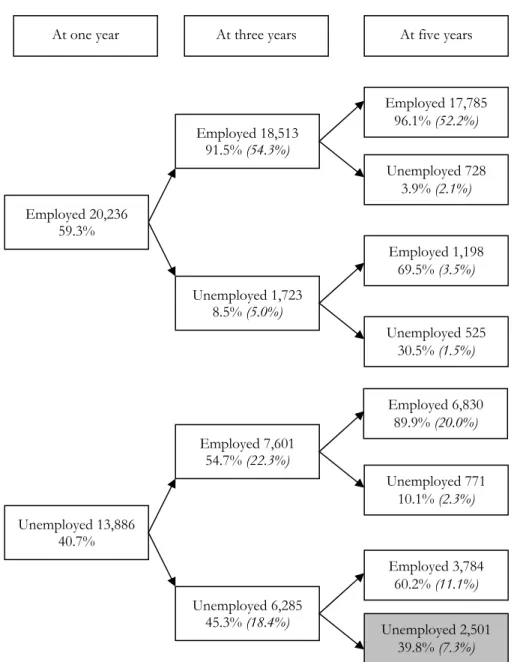
Figure 1 reports a schematic representation of the transitions, from employed to unemployed status and vice versa, identified during the three interviewing ses-sions: as clearly shown by the data, having entered the labour market increases the likelihood of staying in employment; as a matter of fact, over 90% of those who declared to be in employment one year after graduation were found to be still employed three and five years thereafter. This means, in general, that slightly more than half of graduates have found a job at one year after graduation and remains employed in the four years that follow.
At the other end of the spectrum, about 7% of graduates declared, on all three interviews, to have no employment; of course this cohort has been excluded from all further analyses on mobility for job reasons.
As a whole, for 15 of the 80 degree courses examined, the employment rate at one year from graduation exceeded 80%; when lowering the employment rate threshold to 70%, the number of degree courses increases to 34. By contrast, only 6 degree courses show employment rates lower than 50%.
As already discussed, at three years from graduation the percentage of gradu-ates engaged in a work activity show a substantial increase as regard both the total number of interviewees and the majority of the degree courses under examination
5 In line with the ISTAT official survey on the employment conditions of graduates, this analysis
considered as “employed” only those graduates who declared being in some sort of paid job provi-ded this did not entail some form of training (traineeships, apprenticeships, research doctorates, master courses); according to this definition, the fact that a graduates gets paid, though being a pre-condition, it not sufficient for him/her to be defined as employed. This definition differs from the one used by ISTAT in its survey on the Labour Force: according to this latter definition, all those who declared they were working for a wage, even as part of trainee programmes and without a re-gular employment contract, were considered as being employed.
Figure 1 – Graduates from the years 2000, 2001 and 2002: employment conditions at one, three and
five years from graduation.
Note: the figures in italics reported in brackets are the percentages calculated with respect to the
to-tal number of interviewees (34,122). Moreover, the box highlighted in grey, which shows the num-ber of interviewees with no work experience whatsoever in the three-year period under investiga-tion, refers to graduates excluded from the analysis on occupational mobility.
Employed 18,513 91.5% (54.3%) Unemployed 1,723 8.5% (5.0%) Employed 20,236 59.3% Unemployed 728 3.9% (2.1%) Employed 1,198 69.5% (3.5%) Unemployed 525 30.5% (1.5%) Unemployed 13,886 40.7% Employed 7,601 54.7% (22.3%) Unemployed 6,285 45.3% (18.4%) Employed 17,785 96.1% (52.2%) Employed 6,830 89.9% (20.0%) Unemployed 771 10.1% (2.3%) Employed 3,784 60.2% (11.1%) Unemployed 2,501 39.8% (7.3%)
(with a few exceptions due to the low number of graduates surveyed): in 19 de-gree courses, the employment rate exceeded 90% whereas it remained below 70% for 8 degree courses (these are courses in which high numbers of graduates pur-sue post-graduate studies).
Finally, at five years from graduation, the percentage of graduates who have found a job, while reaching 87% in the aggregate, exceeds 90% in 39 of the de-gree courses under consideration (95% for 17 of them). At the bottom of the ranking there are 10 degree courses in which the percentage of employed gradu-ates remains lower than 80%.
Of course, a through analysis of the employment conditions of graduates can-not be confined to employment rates only, but must necessarily consider also the main characteristics of the working activity carried out: type of employment agreement, level of remuneration, relevance to the course of study in the job ac-tivity as well as the location of the workplace with respect to the place of resi-dence6.
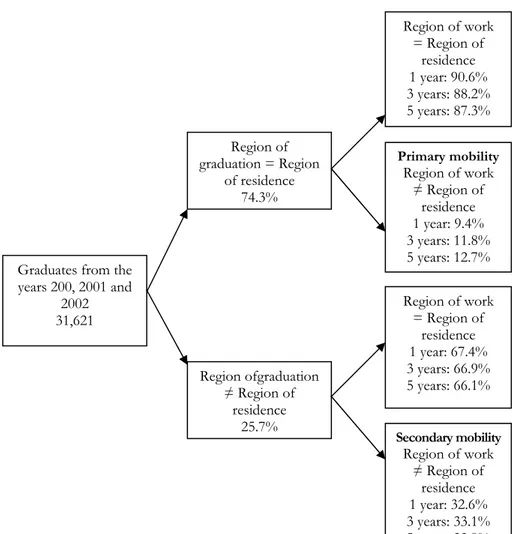
Figure 2 and Table 2 provide a summary indication of mobility flows for study and occupational reasons; what emerges is a strong association between the two components under examination: graduates who moved to a different town for study purposes are later more likely to stay away from home for occupational rea-sons. As a whole, 15% of graduates declare having taken up a work activity out-side of their region of reout-sidence at one year from completion of their studies; this percentage shows a slight increase to 17.3% at 3 years from graduation and to 18.1% at five years. A twofold increase in these percentages is observed when narrowing down the analysis to those graduates who completed their studies in a region different from the one of residence: in this case the percentage raise to a-bout 33% in all the years under consideration (secondary mobility). By contrast, occupational mobility is markedly lower in the case of graduates who studied in their region of residence (primary mobility): as it turned out, on all three inter-viewing occasions, about 90% of graduates reported working in the same region where they live and completed their university education.
With reference to degree courses, the picture appears decidedly more articulate compared to the one observed for the total number of graduates. As a matter of fact, with the passing of time from the year of graduation, the number of degree courses showing relatively high mobility flows tends to increase: while at one year from graduation, only 7 of the 80 degree courses under examination report over 30% of employed graduates working away from their region of residence, this number increases to 13 at three years and to 17 at five years from completion of studies. At the other end of the spectrum, in the period between one and five ye-ars from graduation, the number of degree courses involved in low mobility flows (i.e. lower than 10%) drops drastically: from 17 degree courses at one year from graduation to 9 after three years and further down to 6 after five years.
6 On the topic of graduates’ occupational mobility see also G. Cainelli, G. Gorla (2008) and G.
Figure 2 – Graduates from the years 2000, 2001 and 2002: mobility for study and occupational
rea-sons at one, three and five years from graduation.
Note: the percentages relating to the comparison between region of work and region of residence are calculated on the employed graduates only and not on the total number of interviewees as is the case, instead, of the percentages relating to the comparison between region of graduation and re-gion of residence.
Source: measurements based on ALMALAUREA data
In particular, the degree courses characterised by the highest rates of mobility for occupational reasons are those offered by a limited number of universities which, therefore, feature a high level of mobility for study reasons. But these are also degree courses which, by their very nature, require some predisposition to mobility, in particular, international and diplomatic relations, translation and in-terpreting, institution and financial markets (a low number of graduates), the arts, music and the performing arts, economics and banking, banking economics, all of them firmly positioned within the first 10 in terms of percentage share of gradu-
Region of graduation = Region of residence 74.3% Region ofgraduation ≠ Region of residence 25.7% Graduates from the
years 200, 2001 and 2002 31,621 Region of work = Region of residence 1 year: 90.6% 3 years: 88.2% 5 years: 87.3% Primary mobility Region of work ≠ Region of residence 1 year: 9.4% 3 years: 11.8% 5 years: 12.7% Region of work = Region of residence 1 year: 67.4% 3 years: 66.9% 5 years: 66.1% Secondary mobility Region of work ≠ Region of residence 1 year: 32.6% 3 years: 33.1% 5 years: 33.9%
TABLE 2
Percentage of graduates employed in a region different from the one of residence, by type of degree course and by comparison between region of graduation and region of residence: same region, different region and total number
of employed graduates (degree courses denominations as per Table 1 above)
1-year graduates 3-year graduates 5-year graduates
Region of graduation vs
region of residence Region of graduation vs region of residence Region of graduation vs region of residence Degree
course number
same different total same different total same different total
1 7.7 - 7.1 12.5 50.0 16.7 28.6 50.0 31.3 2 14.5 76.9 25.3 17.8 83.3 30.8 18.7 73.3 27.8 3 1.6 62.5 8.7 4.9 44.4 8.9 10.1 46.2 14.7 4 5.6 11.8 6.7 7.9 26.3 11.1 11.2 23.8 13.4 5 - 33.3 7.7 - 50.0 23.1 12.5 60.0 30.8 6 5.6 31.9 13.6 6.4 25.8 12.4 5.9 25.1 11.8 7 - 40.0 28.6 - 50.0 33.3 25.0 66.7 56.3 8 28.6 - 22.2 37.5 - 27.3 28.6 - 22.2 9 27.5 34.8 30.2 30.2 44.4 35.0 31.5 40.0 34.2 10 29.4 20.0 25.9 34.8 35.3 35.0 44.0 30.0 37.8 11 10.1 40.0 16.3 17.0 43.6 22.4 15.5 51.2 23.2 12 20.0 100.0 23.1 18.5 66.7 23.3 25.0 85.7 34.9 13 8.0 47.2 16.3 10.9 48.2 19.5 12.5 42.6 19.4 14 17.1 52.5 24.0 17.9 56.1 25.4 18.8 57.8 26.1 15 20.8 66.7 27.0 27.6 61.9 34.3 25.5 59.1 31.9 16 11.6 48.3 18.4 19.9 33.3 22.7 18.8 48.1 25.1 17 16.3 41.8 20.9 20.3 34.2 23.2 19.8 43.2 24.4 18 8.4 42.1 15.4 10.4 41.0 16.9 11.9 38.5 17.3 19 12.9 57.1 29.1 18.3 56.2 31.7 18.1 58.7 32.9 20 8.6 18.3 12.1 12.2 28.2 18.0 13.0 27.8 18.1 21 3.9 37.5 7.1 8.5 38.9 11.5 8.3 50.0 12.8 22 6.3 18.4 9.7 6.3 29.8 12.6 3.8 27.1 10.1 23 23.8 61.1 43.7 16.9 60.6 40.7 11.4 54.3 34.7 24 9.6 31.8 13.5 12.3 31.4 15.7 12.7 31.9 16.3 25 6.3 48.8 37.3 - 42.2 29.2 10.0 58.3 44.1 26 4.9 28.9 8.2 6.4 25.6 8.9 7.4 28.1 10.2 27 12.5 50.0 21.7 9.1 58.5 21.6 11.5 56.4 22.4 28 14.6 62.9 22.7 13.9 60.3 22.8 18.4 60.7 26.4 29 10.1 46.8 18.1 11.3 45.6 19.1 14.5 45.9 21.6 30 - 30.0 7.5 22.2 38.1 27.3 16.7 50.0 26.5 31 7.7 - 6.7 23.5 - 21.1 16.7 - 15.0 32 13.3 100.0 18.8 21.4 100.0 26.7 17.6 100.0 22.2 33 16.4 40.9 22.5 14.6 44.0 21.5 16.1 55.6 25.0 34 9.4 40.9 14.1 12.9 38.6 17.2 13.4 45.2 18.7 35 6.0 11.8 7.5 7.4 9.1 7.8 8.5 21.7 11.7 36 - - - - - - 37 - - - 10.0 25.0 14.3 38 16.3 33.3 19.2 18.0 36.8 21.5 17.8 35.9 21.0 39 9.5 33.3 14.8 8.3 32.3 13.6 8.0 30.6 13.4 40 7.7 16.7 10.5 15.0 20.0 16.7 20.0 20.0 20.0 41 13.0 33.3 18.1 11.4 37.5 17.5 15.3 48.1 23.2 42 11.8 73.7 21.5 13.9 66.7 23.0 9.3 47.6 15.5 43 13.1 50.0 18.3 17.6 50.0 21.8 19.5 50.0 23.6 44 100.0 - 40.0 33.3 60.0 50.0 33.3 50.0 44.4 45 5.9 40.0 18.5 13.6 41.2 25.6 8.3 35.3 19.5 46 30.0 43.8 36.1 32.0 46.7 40.0 41.4 51.6 46.7 47 13.7 62.5 22.9 15.3 59.6 23.2 19.6 60.0 27.0 48 10.0 33.3 20.0 13.8 25.0 17.8 7.1 35.3 17.8 49 9.0 20.7 13.1 11.1 22.6 15.2 11.6 23.0 15.6 50 7.5 27.4 10.4 12.2 36.0 15.8 12.6 38.1 16.8 51 8.9 23.1 10.9 6.1 57.1 13.5 7.4 52.9 15.3 52 6.7 50.0 19.0 30.0 33.3 30.8 30.0 33.3 30.8 53 22.7 100.0 26.1 13.0 - 12.5 15.4 - 15.4 54 17.7 37.5 20.0 12.8 36.4 15.7 12.8 36.4 15.5 55 11.0 33.3 16.0 20.8 39.7 25.0 21.7 37.2 25.5 56 11.7 53.1 18.3 14.4 49.5 20.0 15.0 47.4 20.2 57 6.6 38.6 13.3 7.6 45.3 16.6 14.2 55.0 23.4 58 5.8 28.6 8.5 15.0 35.7 18.9 20.9 50.0 25.3
1-year graduates 3-year graduates 5-year graduates Region of graduation vs
region of residence Region of graduation vs region of residence Region of graduation vs region of residence Degree
course number
same different total same different total same different total 59 4.2 16.7 6.7 12.0 - 9.7 8.0 - 6.7 60 8.3 31.0 12.1 15.1 36.8 18.7 14.4 39.1 18.8 61 - 100.0 16.7 14.3 50.0 22.2 13.3 80.0 30.0 62 5.8 12.8 7.3 8.7 17.4 10.7 7.6 16.7 9.8 63 7.0 21.1 11.1 7.1 24.8 12.5 7.2 24.5 12.4 64 8.4 34.0 13.1 13.8 41.1 20.2 13.8 39.6 19.7 65 10.3 52.9 16.1 12.5 42.3 17.5 17.1 57.1 23.8 66 12.8 37.0 19.0 14.0 45.9 23.1 17.5 43.6 24.6 67 8.6 33.0 12.3 10.5 34.4 14.3 11.6 39.0 15.9 68 5.8 21.1 12.0 7.3 24.7 14.8 8.4 23.5 14.9 69 - 33.3 10.0 - 33.3 9.1 - 33.3 8.3 70 7.9 2.3 2.8 7.9 2.9 3.4 5.4 3.2 3.4 71 - 24.1 13.5 - 25.7 14.3 - 26.3 14.1 72 7.1 - 6.3 5.9 - 5.3 5.9 - 5.3 73 22.2 50.0 27.3 14.3 50.0 22.2 14.3 50.0 22.2 74 12.0 45.0 18.4 15.8 43.3 22.1 15.5 35.5 19.9 75 16.1 35.7 22.2 29.2 63.2 38.8 21.3 57.9 31.8 76 21.8 70.6 27.7 16.8 69.6 24.1 12.8 65.4 20.3 77 8.6 45.2 32.1 17.9 43.2 34.1 28.7 45.8 40.0 78 19.5 58.6 44.1 19.6 62.0 46.4 20.8 59.8 45.4 79 - 50.0 20.0 - 50.0 18.2 10.0 33.3 15.4 80 12.2 32.6 19.2 6.8 37.3 16.1 8.3 36.4 17.1 Total 9.4 32.6 15.0 11.8 33.1 17.3 12.7 33.9 18.1 Source: measurements based on ALMALAUREA data
ates employed out of their original regions, regardless of the year of measure-ment. At the bottom of the ranking there are social services, pedagogy, forestry and environmental sciences.
When restricting our analysis to graduates who studied away from their region of residence, the number of graduates employed in a region different from the one of origin exceeds, for some degree courses, 60%; when considering just the graduates interviewed at five years from completion of their studies, these degree courses are: european languages and cultures, biotechnologies, nuclear engineer-ing, aerospace engineerengineer-ing, astronomy (few graduates), telecoms engineerengineer-ing, e-lectronic engineering, it engineering, animal husbandry sciences (few graduates). 3. SOME CONSIDERATIONS ON THE CROSS-SECTIONAL ANALYSIS
The findings outlined in the previous paragraph revealed considerable differ-ences among the various degree courses in terms of occupational mobility, but did not provide any indication as to the individual and context factors that may have an impact on the extent and characteristics of the phenomenon under ex-amination. Estimating the impact of such factors will enable us to measure the net effect of degree courses on mobility and a deeper understanding of this phe-nomenon.
As briefly mentioned in the introduction, previous attempts to identify the ma-jor determinants of occupational mobility were made by Bacci and Chiandotto (2007) who applied a two-level model (first level: graduates, second level: degree courses – see the works by Snijders and Bosker, 1999, Raudenbush and Bryk,
2002 and Goldstein, 2003 for a detailed analysis of multi-level models) to cross-sectional data taken from the ALMALAUREA 2005 and 2006 surveys on gradu-ates’ employment conditions. The variables that were chosen as possible determi-nants are reported on Table 3 and are the same as those considered in this article: the first-level explanatory variables refer both to the graduate’s individual charac-teristics (gender, secondary school-leaving certificate mark, degree mark, etc.) and to the characteristics of the job (professional status, type of employment agree-ment, etc.) and of the employer of the graduate (size of company, economic sec-tor, public or private sector); the second-level explanatory variables were obtained by aggregating individual characteristics and were determined on the basis of their ability to reflect and represent differences among degree courses.
As emerged from the analysis, both the graduates’ individual characteristics and the characteristics relating to type of employer and work activity were found to have a sizable impact on mobility for work reasons. In particular, what appears to determine the variability of the phenomenon are, to a great extent, the geo-graphical location of the university of graduation, the geogeo-graphical location of the company where the graduate is employed as well as the mobility for study rea-sons. After subtracting the effect of the first-level variables selected, what remains is a statistically significant level of variance that is attributable to the non-observed characteristics of the degree courses; this confirms the existence of an effect due to the type of university education received.
The results so obtained provide a number of valuable insights concerning tho-se degree courtho-ses which are associated with a very high level of mobility for oc-cupational reasons. However, this type of analysis has a few inherent limitations due, in particular, to the use of cross-sectional data. The main limitation lies in the impossibility of tracking the evolution, which is longitudinal in nature, of the phenomenon under consideration, i.e. of assessing whether - and to what extent - the “time” variable could affect in a significant manner the decision to move a-way from one’s region of residence for occupational reasons. In the same a-way, the use of cross-sectional data does not enable an assessment of the evolution in time of the effects exercised by the variables under examination because possible variations between the different cohorts could in the same way be attributed to an evolution of the phenomenon in time and to the structural differences between the cohorts. For the same reason, there is no comparability between the rankings obtained for each data set due to the different nature of the data sets under con-sideration.
To overcome these limitations, the analysis was carried out on longitudinal da-ta. The first step consisted in estimating three two-level logistic models identical to the models applied in the previous study, using the same explanatory variables. At a later stage, in order to overcome additional limitations inherent in this type of analysis (see next session for additional details), a three-level logistic model was adopted, with the year of the interview being chosen as the third-level unit (Sec-tion 5). In this latter case, it was decided to consider addi(Sec-tional first-level variables which may be useful to explain the phenomenon under consideration; these new variable are reported on Table 3 and are marked with a star.
TABLE 3
First, second and third-level variables employed in the three-level model
Variable considered Relevant modalities
Variable under examination
Region of employment vs. region of residence same region/different region/abroad Explanatory variable relative to the year of the interview
*Year of the interview quantitative
Explanatory variables relative to graduates Characteristics of the graduate
Region of graduation vs. region of residence same region, different region
Gender female, male
Type of upper secondary school lyceum, other school Secondary school-leaving certificate quantitative (sixtieths)
Degree mark quantitative
Age at graduation quantitative
Study abroad experiences no, yes
*At least one post-graduate training course no, yes
Area of study South, Centre, North, abroad
Was employed at the time of graduation no, yes
Is currently seeking employment no, yes
*Has children no, yes
*Married or not-married cohabiting no, yes
*At least one graduate parent no, yes
Characteristics of the employer
Company size small, medium, large
Economic sector of the company agriculture, industry, services
Public/private sector private, public
Characteristics of the job
Professional status employee, self-employed, other (collaborator, partner)
Type of employment agreement stable, temporary
Location of the workplace South, Centre, North, abroad
General satisfaction with the job quantitative (from 1 to 10)
Use of skills high, moderate, none
Usefulness of the degree certificate useful, useless
Explanatory variables relative to degree courses
% of males quantitative
average age at graduation quantitative
average graduation mark quantitative
average school-leaving certificate mark quantitative % of students coming from lyceums quantitative % of students already working at the degree quantitative * New variables included in the three-level model used for the longitudinal analysis
4. A PRELIMINARY LONGITUDINAL ANALYSIS
In order to allow a direct comparison between cross-sectional and longitudinal data, a preliminary analysis was conducted on this latter category in order to clo-sely replicate the cross-sectional analysis referred to in the preceding section. In particular, three two-level logistic models were estimated (using employed gradu-ates as first-level unit and degree courses as second-level unit), one for each inter-view year. The degree courses chosen corresponded to the 54 courses already ex-amined in the cross-sectional analysis with the exception of the degree course in public relations for which no longitudinal data were available; moreover, the ex-planatory variables were the same as those used in the previous analysis.
The estimated regression coefficients reported on Table 4 show remarkable differences between the models estimated around the two types of data both in terms of covariates’ significance and of rank order of degree courses. As one can easily notice, while several variables are found to be significant in both types of
TABLE 4
Cross-sectional and longitudinal data: regression coefficients estimates
1 year degree 3 years degree 5 years degree
Covariate Reference
Cross-section Longitu-dinal section Cross- Longi- tudinal section Cross- Longi- tudinal
Intercept NS NS NS NS -3.46 2.22
2-level variance 0.06 0.07 0.08 0.11 0.15 0.12
Characteristics of the graduate
Region of graduation vs.
region of residence Same Region 2.29 1.99 1.99 1.84 1.43 1.77
Gender Female NS 0.29 NS 0.29 NS 0.27
Age at graduation NS -0.04 NS -0.05 NS -0.04
Degree mark NS 0.01 NS 0.01 NS 0.02
Type of upper secondary
school Technical school 0.2 NS 0.25 0.16 0.18 0.15
Study abroad experiences No 0.69 0.63 0.6 0.54 0.55 0.53
Geographical area of study:
Centre South -3.92 -2.03 -3.53 -2.05 -1.97 -1.93
Geographical area of study:
North South -2.69 -3.09 -2.90
Was employed at the time of
graduation No -0.42 -0.19 -0.23 NS -0.27 NS
Is currently seeking
em-ployment No NS NS 0.23 0.18 0.25 0.22
Characteristics of the employer
Public sector Private sector -0.22 -0.19 NS -0.28 NS -0.32
Company size: small Large -0.36 -0.63 -0.65 -0.85 -0.63 -0.88
Company size: medium Large NS -0.42 -0.42 -0.50 -0.31 -0.35
Characteristics of the job Prof. status: self-employed Employee
or other -0.42 -0.47 -0.27 -0.25 -0.43 -0.25
Type of employment
agree-ment: temporary stable 0.25 NS 0.24 NS 0.34 0.19
Geogr. location of the
workplace: Centre South 4.61 2.58 4.1 2.99 2.29 2.84
Geogr. location of the
workpl.: North/abroad South 2.71 3.35 3.16
Generalsatisfaction with the
job NS 0.06 NS 0.04 NS 0.06
Characteristics of the degree course Average age at graduation
for the degree course -0.14 -0.11 -0.09 -0.09 NS -0.13
% of males in the degree
course 0.71 0.99 NS NS NS NS
models and show similar estimated coefficients, other variables, which in the cross-sectional analysis did not turn out as being significant on any of the three years under consideration, were selected for all three years in the longitudinal a-nalysis: these variables are, in particular, gender, age at graduation, degree mark and satisfaction with the current job.
Further differences can be observed among degree courses rankings (not re-ported in their entirety in this article for lack of space) which were developed on the basis of second-level residuals. As was also the case for the cross-sectional analysis, here too it is possible to build three rankings (one for each year) enabling a one-to-one comparison with degree courses. By calculating the Spearman’s Rho cograduation index for each of the three pairs of rankings (on cross-sectional and on longitudinal data), the following values were obtained: 0.40 at one year, 0.58 at three years and 0.68 at 5 years from graduation. Therefore, the correlation
be-tween a ranking of degree courses built on the basis of cross-sectional data and a ranking built on the basis of longitudinal data appears to be, in all cases, medium to low. In other terms, the use of rankings built on the basis of cross-sectional data can lead to wrong conclusions (and hence to wrong decisions) regarding the effect of a degree course on graduates’ mobility. Finally, the tendency towards an increasingly positive correlation between the two types of rankings, as evidenced by the Spearman’s Rho coefficient values, can be ascribed to the fact that the structural differences among the graduate populations from the various degree courses tend to diminish with the passing of time from the year of graduation.
However, apart from the similarities and differences observed between the two-level cross-sectional and longitudinal analyses, the latter type of analysis still poses a number of outstanding questions. First of all, having relied on three dif-ferent two-level logistic models, it was not possible to take into account the cor-relation of the response variable across the three measurement occasions: in other words, it is reasonable to assume that the tendency to mobility at time t is a func-tion of the tendency to mobility at time t-q, where q = 1, 2,…. Secondly, an esti-mation of the effect exercised by time on both the rankings of degree courses and the covariates, which would provide an understanding of whether the courses’ effect and the covariates’ effect change over time or remain constant, was not possible. What can be provided, at the most, is a descriptive evaluation obtained by comparing the estimates resulting from the three models which, however, would not enable a judgement of the significance of the identified differences. 5. A THREE-LEVEL RANDOM INTERCEPT AND RANDOM SLOPE LOGISTIC MODEL 5.1. The model
In order to overcome the limits inherent in conducting a two-level analysis se-parately for each cohort of graduates as shown in the preceding section, a single three-level regression model can be used (Gibbson and Hedeker, 1997) in which the first-level units are represented by the measurement occasions (i = 1, 2, 3), the second-level units by employed graduates (j = 1, …, n) and the third-level units by the degree courses (k = 1, …, 80). The model can be constructed in terms of a three-level random intercept logistic model (both at level 2 and at level 3) using the following equations:
- First-level equation: ijk ijk jk k 0 , 1 logit[P(Y 1|x , x , x )] jk H h h ijk h x β β = = = +
∑
,where xh ijk, indicates the value taken by the h – th characteristic at the level of the
i measurement occasion for subject j belonging to group k, βh is the
correspond-ing (fixed) regression coefficient and β0jk is the random intercept at individual
- Second-level equation: 0 00 , 0 1 L jk k l l jk jk l x u β β β = = +
∑
+where xl jk, is the value taken by the l-th individual characteristic for subject j of group k, βl is the corresponding (fixed) regression coefficient, β00k is the fixed component at individual level and the variable component at group level of the intercept of the first-level model and u0 jk is the second-level residual compo-nent. The second-level residuals are assumed to be normally distributed with zero mean and constant variance (equal to 2
u
σ ). They indicate the variation experi-enced by the mean value of Y among the subjects: therefore, u0 jk indicates the extent to which the likelihood of mobility for student j from the k degree course
varies with respect to the average likelihood observed for course k.
- Third-level equation: 00 000 , 00 1 M k m m k k m x v β β β = = +
∑
+ ,where xm k, is the value taken by the m-th context-related characteristic for group k, βm is the corresponding (fixed) regression coefficient, β000 is the fixed com-ponent of the intercept at group level and v00k is the third-level residual compo-nent. The third-level residuals are assumed to be normally distributed with zero mean and constant variance (equal to 2
v
σ ). They indicate the variation experi-enced by the mean value of Y among the various groups: therefore, v00k reveals
the extent to which the likelihood of mobility for a student with average charac-teristics coming from course k varies with respect to the average likelihood
ob-served for the entire graduate population. In other words, third-level residuals measure the degree courses’ different “propensity” to mobility.
Of all first-level covariates, particular importance is attached to the measure-ment occasion indicator since it allows an estimation of the response variable’s time trend. With regard to this, it might be useful to introduce a polynomial func-tion of time – f (timeijk) – which indicates the average growth trajectory of the
re-sponse variable over time – as well as to assume interaction effects with the other 1-level covariates in order to check the assumption about there being a mean constant effect on mobility with the passing of time. Moreover, since it is reason-able to assume that the growth trajectory of the mobility likelihood will not be constant neither within the graduates’ population nor across the various degree courses, the corresponding regression coefficient (γ1,ijk) is assumed to be variable both a level 2 and at level 3. By taking into account all these elements, a three-level random intercept and coefficient logistic model is obtained:
ijk ijk jk k 0 1 , 1 0 000 , , 0 00 1 1 1 11 1 11 111 11
logit[P(Y 1|x , x , x )] jk H jk ( ijk) [ h ijk ( ijk)]
h M L jk m m k l l jk jk k m l jk k jk k k f time x f time x x u v u v β γ η β β β β γ γ γ γ = = = ⎧ = = + ⋅ + ⋅ ⋅ ⎪ ⎪ ⎪⎪ = + + + + ⎨ ⎪ ⎪ = + ⎪ = + ⎪⎩
∑
∑
∑
Compared to the model with a single random intercept, the three-level model is more complex due to the presence of residual components u1 jk and v11k. These are both assumed to be normally distributed with zero means and constant variance; moreover, they are generally assumed to be uncorrelated with one an-other; by contrast, a correlation different from 0 is deemed to exist between u0 jk and u1 jk, on the one hand, and between v00k and v11k, on the other hand. For interpretation purposes, the u1 jk residuals indicate the variation experienced by the growth trajectory of subject j with respect to the mean trajectory reported by the k group to which it belongs; the v11k residuals indicate, on the contrary, the variation in the growth trajectory for group k with respect to the mean trajectory of the population.
5.2. Results: the random effects
The three-level logistic model was estimated with the MLwiN software (Ras-bash et al., 2005) using Taylor series expansion with second-order approximation and, hence, the Iterative Generalized Least Squares method.
The first series of significant results shows the random effects and, in particu-lar, the significance of the hierarchical structure assumed in the analysis. A high percentage (41.8%) of the resulting total variance (equal to 5.64) is ascribable to the hierarchical structure of the data: in particular, 40.0% is attributed to differ-ences among graduates whereas the remaining part (only 1.8%) is attributed to differences among degree courses (see Table 5 for an estimate of variance com-ponents). Based on these findings one can therefore conclude that, despite the degree courses’ significant effect on the tendency towards mobility, this effect is nevertheless quite weak; in fact, a much greater role is played by individual differ-ences.
As for the assumed random effect on the regression coefficient of the growth trajectory, it turned out to be non-significant (both at individual and at group le-vel): in other words, the estimated time effect on the mobility likelihood was found to be linear, positive and fixed. This means that the time trajectory of mo-bility does not show any variation among the various graduates and degree cour-ses. The conclusion, therefore, is that the differences observed among the degree courses’ rankings in the two-level cross-sectional and longitudinal analyses are not
statistically significant. Therefore, the estimated model is a three-level random in-tercept logistic model.
5.3. Results: the covariates effects
Before commenting on the effects of the explanatory variables included in the final model, it might be useful to indicate that several other variables have turned out to be not statistically significant. Among them there are individual characteris-tics of the graduates, such as secondary school-leaving certificate mark and degree mark, specific characteristics of the employer such as the economic sector, char-acteristics of the work activity, such as type of employment agreement, income level and the use of skills and, finally, typical characteristics of the degree course such as average degree mark, average secondary school-leaving certificate mark, percentage of students coming from a lyceum and percentage of working stu-dents. Therefore, contrary to what one would reasonably expect, seeking and finding employment in a Region different from the one of residence is typically not leading to a better paid job or to an employment that better fits one’s univer-sity qualifications nor is it correlated to school and educational success or to ob-servable characteristics of the degree courses. With respect to the two-level cross-sectional and longitudinal analyses, some interesting differences emerge: the level of income, the type of employment agreement, the economic sector of the em-ployer and the status as working student did, in fact, turn out to be statistically significant covariates for at least one of the three types of estimated models.
Table 5 reports the estimates of the regression coefficients and the relevant odds ratios of the covariates which were found to be significant. In this case, the results confirm, in substance, what had already emerged from the cross-sectional analysis: the variables which seem to decisively affect the probability of mobility are the study area (Centre, North, South), the location of the workplace (Centre, North or abroad, South) and primary mobility as results from the comparison be-tween Region of study and Region of residence. In particular, graduates attending universities in the Centre or in the North of Italy report a remarkably lower ten-dency to mobility than students in the South (odds ratios equal to 0.18 and 0.09 for the Centre and the North respectively). By contrast, those who work in the Centre and North have an odds ratio of over 12 times as high as the one ob-served for those employed in the South. Finally, those students who moved away from their region of residence to undertake university studies are found to be highly likely to remain away from their family of origin also when starting to seek employment. It should be stressed in this respect that primary mobility is the only explanatory variable which showed a statistically significant time interaction ef-fect: as a matter of fact, the tendency towards mobility for occupational reasons, though being invariably high among those who studied in a Region different from the one of residence, tends to decrease with the passing of time (with odds ratios dropping from 7.20 at one year from graduation to 5.74 at 5 years from gradua-tion) which clearly testifies to the tendency, by some graduates, to go back even-tually to their region of origin. Finally, it is worth noticing that the Region of
resi-dence was not included in the analysis since its effect is absorbed both by primary mobility and by the area of study.
TABLE 5
Three-level random intercept logistic model: regression coefficients estimates, standard errors, odds ratio
Covariate Reference Estimate Std. Error Odds ratio
Intercept 0.82 0.67
2-level variance 2.26 0.05
3-level variance 0.10 0.02
Description of measurement occasion
Year of the interview 0.12 0.02 1.12
Characteristics of graduates Region of graduation vs. region of
residence*1 year from graduation Same Region 1.97 0.05 7.20
Region of graduation vs. region of
residence *3 years from graduation Same Region 1.82 0.05 6.18
Region of graduation vs. region of
residence *5 years from graduation Same Region 1.75 0.06 5.74
Gender Female 0.24 0.04 1.27
Age at graduation -0.04 0.01 0.96
Type of upper secondary school Technical school 0.13 0.04 1.14
Study abroad experiences No 0.59 0.04 1.80
At least one post-graduate training course No 0.19 0.03 1.20
Area of study: Centre South -1.71 0.07 0.18
Area of study: North South -2.43 0.07 0.09
Was employed at the time of grad. No -0.11 0.03 0.90
Is currently seeking employment No 0.10 0.03 1.10
Has children No -0.47 0.06 0.63
Married or not-married cohabiting No 0.11 0.03 1.12
At least one graduate parent No 0.15 0.04 1.16
Characteristics of the employer
Public sector Private sector -0.15 0.04 0.86
Company size: small Large -0.69 0.04 0.50
Company size: medium Large -0.35 0.03 0.71
Characteristics of the job
Professional status: self-employed Employee or other -0.33 0.05 0.72
Localization of the workplace: North/Centre/Abroad South 2.51 0.07 12.34
General satisfaction with the job 0.06 0.01 1.06
Characteristics of the degree course
Average age at graduation for the degree course -0.13 0.02 0.88
% of males in the degree course 0.40 0.19 1.50
Table 5 provides a list of the other covariates along with a thorough analysis of their net effects which are substantially in line with the findings of the cross-sectional analysis. It should be noted, in this respect, that all the variables which had not been considered in the previous analyses were found to be statistically significant; in particular, graduates who completed post-graduate studies, gradu-ates who got married and gradugradu-ates with at least one graduate parent displayed a stronger tendency to mobility (odds ratios of 1.20, 1.12 and 1.16 respectively); by contrast, graduates with children showed a lower tendency (odds ratio of 0.63).
Moreover, with the exception of primary mobility, no other variable was found to exert a time-dependent effect. This allows a clearer reading of the findings of the two-level cross-sectional and longitudinal analyses; in fact, for a number of variables, the resulting estimates showed either a time trend or a fluctuating trend that were apparently difficult to interpret; in other instances the variables were found to be significant for only one of the three cohorts. To conclude, the effect of the covariates under consideration on the mobility likelihood does not change significantly over time.
Finally, it is worthy to notice that the likelihood of mobility tends to increase in a linear manner throughout the years: with each additional year, the odds ratio of mobility increases, as a matter of fact, by 12% (Table 5). This finding can lead to various interpretations. One possible explanation is that graduates might start, at the beginning, to seek employment in the Region of residence and then, if their job seeking is unsuccessful, decide to move elsewhere. Another possibility is that the positive trend is exclusively attributable to the fact that the graduates who pursue post-graduate studies and who, as mentioned before, are more likely to move for occupational reasons, are not included among employed graduates in the years immediately following the year of graduation (because they are continu-ing their education).
5.4. Results: the probability of mobility
In order to provide some useful guidance to future university students, the es-timated regression coefficient values can be used to calculate the probability of mobility for the various individual profiles. This will allow each individual student to assess, on the basis of his/her own characteristics and the characteristics of the job sought, the odds of having to move elsewhere to find employment after completing university studies. Table 6 reports the characteristics of 7 profiles. The base profile refers to an individual displaying the characteristics selected as the reference features for the estimation of the model: although it may not corre-spond to the profile of the “most common” individual, it is nevertheless useful for an easier interpretation of the estimated parameters. The two extreme profiles (lowest and highest) represent two individuals who, for each of the characteristics under consideration, display the modalities that are, respectively, the least and the most conducive to mobility: in this way it is possible to calculate the degree of variability of the phenomenon being considered.
Finally, profile A represents a typical individual (female, average age at gradua-tion, attended a lyceum, married, no children, with at least one graduate parent, etc.) while profiles B, C and D differ from profile A for just one characteristic: profile B for primary mobility, profile C for the area of study and profile D for the location of the workplace. Thanks to this arrangement it is possible to get an immediate understanding of what would happen by changing just one of the ex-planatory variables with a high odds ratio.
Table 7 shows the estimated probability for each profile and for each of the three modalities that can characterise the variable indicating the time of the inter-view (1, 3, 5 years from graduation). As clearly shown by the base profile, the probability of mobility follows a growing trend. Moreover, compared with an av-erage value ranging between 7.4% and 9.1% for the base profile, the variability range of mobility probability is extremely broad, as shown by the two extreme profiles. This fact is confirmed by the probabilities calculated for profiles A, B, C and D. With reference to employed graduates at one year from graduation – an observation which applies also to the other two time points – type A graduates show a probability of mobility equal to 12.3% whereas their peers who completed
TABLE 6
Individual profiles
Base profile The lowest extreme The highest extreme Profile A Profile B Profile C Profile D Year of the
interview 1, 3, 5 1 5 1, 3, 5 1, 3, 5 1, 3, 5 1, 3, 5
Region of grad. vs.
region of residence Same region Same region Different region Same region Different region Same region Same region
Gender Female Female Female Male Female Female Female Female
Age at graduation Av. value
(27.7) Q3 (29.2) Min value (24.5) Av. value (27.7) Av. value (27.7) Av. value (27.7) Av. value (27.7) Type of upper
secondary school Technical Technical Class./scient. Class./scient. Class./scient. Class./scient. Class./scient. Study abroad
experiences No No Yes No No No No
At least one post-graduate training course
No No Yes Yes Yes Yes Yes Geographical area
of study South North/C. South South South North/C. South
Was employed at the time of graduation No Yes No No No No No Is currently seeking employment No No Yes No No No No
Has children No Yes No No No No No
Married or
not-married cohabiting No No Yes Yes Yes Yes Yes
At least one
graduate parent No No Yes Yes Yes Yes Yes
Sector Private Public Private Private Private Private Private
Company size Large Small Large Large Large Large Large
Professional status Employee Self-Empl. Employee Employee Employee Employee Employee Geographical
location of the workplace
South South North/C./A. South South South North/C./A.
General satisfaction
with the job Average (7.4) Min (1) Max (10) Average (7.4) Average (7.4) Average (7.4) Average (7.4) Average age at
graduation for the degree course
27.7 Q3 (28.0) Min (24.5) 27.7 27.7 27.7 27.7
% of males in the
degree course 0.43 Min (0.05) Max (0.95) 0.43 0.43 0.43 0.43
Second-level
residuals 0 Min (-4.00) Max (7.00) 0 0 0 0
Third-level
residuals 0 Min (-0.44) Max (0.79) 0 0 0 0
TABLE 7
Estimated probability of working in a Region different from the one of residence, by individual profile Base profile The lowest extreme The highest extreme Profile A Profile B Profile C Profile D
1 year 7.4 0.0 – 12.3 50.3 1.2 63.5
3 years 8.2 – – 13.7 49.4 1.4 66.1
5 years 9.1 – 100.0 15.1 50.5 1.5 68.7
their studies in a region different from the one of residence and those who are employed in northern Italy report a probability of 50.3% and 63.5% respectively. By contrast, their colleagues who studied in a northern region show a probability of mobility of only 1.2%, all other characteristics being equal.
5.5. Results: ranking of degree courses
To conclude the analysis we present a ranking of the 80 degree courses based on the third-level v00k residuals relating to the random intercept (see Figure 3 for the courses placed in the extreme positions of the ranking) which indicate the ex-tent to which the probability of mobility changes for an average individual (i.e. with base characteristics) who attended a specific degree course with respect to an individual who attended an average course (i.e. with v00k = ). As already under-0
lined in Section 5.2, given the non-significance of the random coefficient of the growth trajectory, it is possible to rely on a single ranking of degree courses which, in this way, will replace the three (apparently) different rankings obtained from the two-level cross-sectional and longitudinal analyses. It should be noted, however, that each of the three rankings of degree courses that resulted from the two-level cross-sectional and longitudinal analyses is highly correlated with the ranking reported in Figure 4: as a matter of fact, the Spearman’s Rho cogradua-tion index shows values ranging approximately between 83% and 86%.
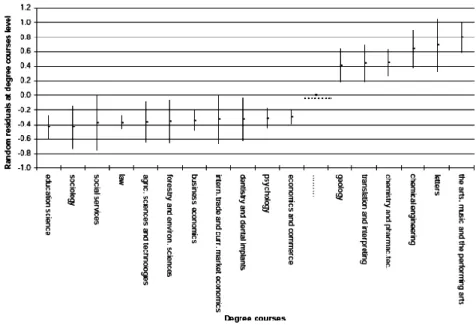
Figure 3 – Ranking of (extreme) degree courses as a function of third-level residuals.
Figure 3 reports the value of v00k and the corresponding 95% confidence in-terval for only those degree courses that are positioned at the extremes of the ranking meaning that they are significantly different from the other courses. As a matter of fact, since the tendency towards mobility of two degree courses can be considered as significantly different only if the respective confidence intervals do not overlap, this condition is met only by the degree courses that are positioned at the extremes of the ranking, in particular in the highest end. This is in line with
the observations made in Section 5.2 concerning the fact that the aggregation of graduates in different degree courses (1.8% of total variance) can explain the vari-ability of the mobility phenomenon only to a limited extent. Having regard to this consideration, it is nevertheless possible to identify degree courses which, by comparison to others, induce a significantly greater tendency towards mobility. These are in particular: the arts, music and the performing arts, letters, chemical engineering, chemistry and pharmaceutical technology, translation and interpret-ing, geology (see the 6 courses that are positioned at the top right of Figure 3). By contrast, graduates from the following degree courses show in general a lower tendency to mobility: economics and commerce, psychology, dentistry and dental implants, international trade and currency market economics, business econom-ics, forestry and environmental sciences, agricultural sciences and technologies, law, social services, education science (see the 11 courses positioned at the bot-tom left of Figure 3). In particular, for an average individual who graduated from a degree course included in the first group, the probability of mobility ranges be-tween 10.8% (geology) and 15.0% (the arts, music and the performing arts), whe-reas for an average individual coming from the second group the same probability ranges between 4.9% (economics and commerce) and 5.6% (education science). 6. CONCLUSIONS
This article outlines the results of the analysis of cross-sectional data obtained from the ALMALAUREA surveys on graduates from the years 2000, 2001 and 2002 interviewed at 1, 3 and 5 years from graduation: the survey comprised a to-tal of about 31,600 degree holders. The goal of the analysis was to measure the effect of the education received (degree qualification) on the phenomenon of mobility of graduates for occupational reasons as well to identify any other factor that could possibly affect such phenomenon.
Starting with a brief description of the data sets, the article presents two differ-ent types of analyses – the first being a cross-sectional analysis and the second a longitudinal analysis – which were conducted with the aim of identifying any bi-ases in the results obtained with the cross-sectional approach.
These two different methodological approaches highlighted substantially dif-ferent conclusions in terms of significance of the determinants found to be statis-tically significant and ranking of the degree courses. In particular, the longitudinal analysis showed that gender, age at graduation, graduation mark and satisfaction with the job have a significant impact on mobility for job reasons, an effect which found no confirmation in the cross-sectional analysis. The rankings between de-gree courses developed on the basis of the second-level residuals resulting from the two types of analyses showed major differences. The obvious conclusion to be drawn from the above considerations is that a great deal of caution must be exercised when drawing inferences from the findings of cross-sectional analyses given the fact that such inferences are very likely to be affected by substantial bi-ases.
The use of a three-level logistic regression model (first level unit: measurement occasions; second-level unit: employed graduates; third-level unit: degree courses) in the longitudinal analysis showed that degree courses do play a significant im-pact on the tendency towards occupational mobility; however, other variables, in particular context-related and individual factors, were found to have the biggest impact on mobility for job reasons. More specifically, among context-related fac-tors, the geographical localization of the university of graduation, the geographi-cal logeographi-calization of the workplace and primary mobility (i.e. having studied in a re-gion different from the one of residence) were indicated as exercising the strong-est impact on graduates’ likelihood to move for job reasons. Those who gradu-ated in universities locgradu-ated in the Centre or North of Italy are found to be less inclined to mobility than those who completed higher education in a university located in southern Italy. Graduates employed in central or northern regions typi-cally display a considerably higher tendency to mobility than their counterparts who found employment in the South. Finally, students who move away from their region of residence to pursue university studies in another region are much more likely to find employment in the region (generally in the Centre-North of the country) where they completed their education than in the region of origin (generally in southern Italy). Obviously, social and economic conditions have the greatest impact on mobility for job reasons both directly, since the wealthier re-gions in the Centre-North offer greater employment opportunities to graduates, and indirectly, because by determining primary mobility for study reasons they also lead, at a later stage, to greater mobility for job reasons.
Contrary to what one would reasonably expect, some individual factors and in-ternal context-related characteristics turned out to be non-significant. Among them there were some individual characteristics of the graduate such as the sec-ondary school-leaving certificate mark and the degree mark, some peculiar char-acteristics of the employer, such as the economic sector and the charchar-acteristics of the job (for example type of employment agreement, income level and use of skills) and, finally, the peculiar characteristics of the degree course such as the av-erage graduation mark, the avav-erage secondary school-leaving certificate mark, the percentage of students who attended a lyceum and the percentage of working students. The individual variables which were found to be highly significant are completion of post-graduate studies, being married and having at least one gradu-ate parent, having children, age at graduation, satisfaction for the job and being a working student.
Regarding the evaluation of a “time” effect on mobility probability, the analysis indicated that both the individual subjects and the individual degree courses dis-play the same growth trajectory. This means that the differences observed in the degree courses’ rankings obtained by the two-level cross-sectional and longitudi-nal alongitudi-nalyses are not statistically significant; therefore a single ranking of degree courses can be used. The following degree courses were found to determine a significantly greater tendency towards mobility than other courses: the arts, music and the performing arts, letters, chemical engineering, chemistry and pharmaceu-tical technology, translation and interpreting, geology.
It is furthermore interesting to note that, with the exception of primary mobil-ity, all the other explanatory variables show no interactions with time; therefore, the extent to which the covariates under consideration have been shown to affect the likelihood of mobility does not change significantly between one, three and five years from graduation.
As a whole, the likelihood of mobility tends to increase linearly over the years: with each additional year the odds ratio increases by 12%. This phenomenon may be determined by the need, felt by some graduates, to move away from their re-gion of residence in an effort to find employment opportunities that were not a-vailable at home. Another possibility is that the positive mobility trend may sim-ply be a consequence of the (delayed) entry onto the labour market by those graduates who pursue post-graduate studies and who, as it turned out, generally show a greater propensity to move for work reasons.
The findings reported in this article are focused exclusively on a single aspect of graduates’ employment conditions: mobility; the same approach could be fruit-fully applied to investigating and evaluating other aspects in order to provide a comprehensive picture of the employment situation of young people with a uni-versity education.
Department of Statistics “G. Parenti” SILVIA BACCI
University of Florence BRUNO CHIANDOTTO
Consorzio Interuniversitario ALMALAUREA ANGELO DI FRANCIA SILVIA GHISELLI
REFERENCES
S. BACCI, B. CHIANDOTTO (2007), Mobilità dei laureati per motivi di lavoro: un’analisi multilivello, “Statistica Applicata”, 19(1), pp. 5-40.
G. CAINELLI, G. GORLA (2008), Per amore o per forza? La mobilità territoriale per motivi di lavoro, in Consorzio Interuniversitario ALMALAUREA (edited by), X Rapporto sulla condizi-one occupazionale dei laureati. Formazicondizi-one universitaria ed esigenze del mercato del lavoro, Il Mulino, Bologna.
CONSORZIO INTERUNIVERSITARIO ALMALAUREA (2008), X Rapporto sulla condizione occupazionale
dei laureati. Formazione universitaria ed esigenze del mercato del lavoro, Il Mulino, Bologna.
R.D. GIBBONS, D. HEDEKER (1997), Random effects probit and logistic regression models for three-level
data, “Biometrics”, 53(4), pp. 1527-1537.
H. GOLDSTEIN (2003), Multilevel statistical models, Arnold, London.
J. RASBASH, C. CHARLTON, W.J. BROWNE, M. HEALY, B. CAMERON (2005), MLwiN, v2.02, Centre for Multilevel Modelling, University of Bristol.
S.W. RAUDENBUSH, A.S. BRYK (2002), Hierarchical linear models. Applications and data analysis
meth-ods, Sage Publications.
A.B. SNIJDERS, R.J. BOSKER (1999), Multilevel analysis. An introduction to basic and advanced
multi-level modeling, Sage Publications.
G. VIESTI (2005), La mobilità geografica per lavoro dei laureati in Italia, in Consorzio Interuniver-sitario ALMALAUREA (edited by), Lavorare dopo la laurea: caratteristiche e percorsi occupazionali, Il Mulino, Bologna.
SUMMARY Graduates job mobility: a longitudinal analysis
As part of the analysis of the external effectiveness of university education, a special area of attention is represented by graduates’ mobility for occupational reasons. Under-standing whether or not the various types of degree courses affect mobility to a significant extent and estimating the net effect induced by individual and context-related characteris-tics as well as the tendency of this phenomenon over time will help provide information support to universities for use in their decision-making processes. This article proposes a multi-level longitudinal analysis to investigate the above aspects. The analysis draws upon the ALMALAUREA database relative to graduates from the years 2000, 2001 and 2002 interviewed at 1, 3 and 5 years from graduation.