Chemosensors 2020, 8, 46; doi:10.3390/chemosensors8030046 www.mdpi.com/journal/chemosensors Article
A Chemometric Survey about the Ability of
Voltammetry to Discriminate Pharmaceutical
Products from the Evolution of Signals as a Function
of pH
Javier Marín 1, Núria Serrano 1,2,*, Cristina Ariño 1,2 and José Manuel Díaz-Cruz 1,2,*
1 Department of Chemical Engineering and Analytical Chemistry, University of Barcelona, Martí i Franquès 1-11, 08028 Barcelona, Spain; [email protected] (J.M.); [email protected] (C.A.)
2 Institut de Recerca de l’Aigua (IdRA), University of Barcelona, 08028 Barcelona, Spain * Correspondence: [email protected] (N.S.); [email protected] (J.M.D.-C.) Received: 31 May 2020; Accepted: 24 June 2020; Published: 29 June 2020
Abstract: Many pharmaceutical products are electroactive and, therefore, can be determined by
voltammetry. However, most of these substances produce signals in the same region of oxidative potentials, which makes it difficult to identify them. In this work, chemometric tools are applied to extract characteristic information not only from the peak potential of differential pulse voltammograms (DPV), but also from their evolution as a function of pH. The chemometric approach is based on principal component analysis (PCA), partial least squares discriminant analysis (PLS-DA) and support vector machine discriminant analysis (SVM-DA) yielding promising results for the future discrimination of pharmaceutical products in water samples.
Keywords: pharmaceutical products; differential pulse voltammetry (DPV); electrochemical
sensors; voltammetric signal evolution with pH; sample discrimination; principal component analysis (PCA); partial least squares discriminant analysis (PLS-DA); support vector machine discriminant analysis (SVM-DA)
1. Introduction
In recent years, the increasing use of pharmaceutical products for both clinical and farming purposes and the growth of water recycling practices, urged by climate change, have considerably raised the presence of such substances and their metabolites in natural waters, wastewaters and food products [1–8]. The ecotoxic behavior of many pharmaceutical compounds [9] has led to their inclusion in the Watch List of emerging contaminants recently set by EU through the Decision 2015/495 [10,11]. Thus, the determination of pharmaceutical products in water and food samples is of the highest concern.
This is usually achieved by means of chromatographic techniques, especially liquid chromatography combined with fluorescence and mass spectrometric detection [12–15]. These techniques are highly selective, sensitive and accurate and allow multianalyte determination. However, they are expensive and non-portable and require specifically trained personnel. This is why electrochemical sensors, less selective but still sensitive and much simpler, cheaper and portable, constitute a promising alternative to chromatography for the screening and monitoring of pharmaceutical products [16–18]. Moreover, the recent popularization of commercial screen-printed electrodes (SPE) modified with a large diversity of biomolecules and nanomaterials have boosted the capabilities of electrochemical sensing in this field [19–22].
Nevertheless, a crucial problem in the electroanalytical detection of a large set of pharmaceutical products is that they are reduced or, more frequently, oxidized in similar ranges of potential, which depends far more on the nature of the electroactive functional groups than on the structure of the molecules. Then, without the support of a previous chromatographic separation, the task of simultaneously identifying and quantifying different pharmaceutical products in a sample by voltammetry (the most potential-selective electroanalytical technique) is usually restricted to 2 or 3 substances. For this purpose, bare commercial SPE [23], modified SPE [24,25] and SPE grouped into electronic tongues [26] are used and, in the case of overlapping signals, multivariate analysis methods are applied [26]. In this scenario, we think that it is highly unrealistic to start a competition between SPE sensors and chromatographic methods for the simultaneous determination of dozens of pharmaceutical substances in a water sample. A sounder option would be working in two directions: on the one hand, modifying SPE with highly selective reagents for the accumulation and determination of target compounds (e.g., caffeine or paracetamol) that could act as indicators of contamination with pharmaceutical products; on the other hand, developing methodologies for the qualitative discrimination among large groups of such substances that could help as preliminary screening tools to guide the further analysis by chromatographic methods. The present work lies within the second category, quite unexplored up to now.
It is obvious that the most effective information provided by voltammetry for the qualitative identification of substances is the peak potential, which is characteristic of every compound independently of its concentration. However, when we think about dozens of compounds, it is sure that many of them will have virtually the same peak potential. Then, we could define groups of substances with signals appearing in certain potential regions. In this way, the appearance of signals in specific potential ranges would reveal the presence of one or more analytes belonging to the group of compounds appearing there, whereas the absence of signals would ensure the absence of all of them.
As the single information about peak potentials appears to be clearly insufficient for such an ambitious goal, in this work we intend to explore, as a proof of concept, the evolution of peak potentials with pH as a new dimension to help in the discrimination of pharmaceutical products. Fortunately, protons are involved in the oxidation mechanism of many organic substances and this causes a continuous potential shift as pH changes. Indeed, a semi-empirical equation has been used
to estimate the ratio between the H+-ions and the electrons involved in an electrochemical reaction
from the slope of peak potential vs. pH plots [27–29]. When voltammetric signals overlap each other, chemometric methods are required [30,31], but the potential shifts caused by pH changes produce data sets quite far from linearity, which demands specific corrections before the application of typically linear methods like principal component analysis (PCA), partial least squares calibration (PLS) or multivariate curve resolution by alternating least squares (MCR-ALS) [32–34].
In this work we have studied by differential pulse voltammetry (DPV) several mixtures of seven characteristic pharmaceutical products that play a crucial role in human life and health: (i) Ascorbic acid (AA): a water-soluble vitamin widely used to complement inadequate dietary intake, to prevent and treat scurvy and also as antioxidant [35]; (ii) Uric acid (UA): an end product of purine metabolism which has been suggested to act as an antioxidant in vivo [36]; (iii) Paracetamol (P): an antipyretic and analgesic drug widely used for fever reduction and pain relief associated with headache, backache, arthritis and postoperative pain [37]; (iv) Acetylsalicylic acid (AS): a drug of the salicylate family used as analgesic, antipyretic and anti-inflammatory; it is also used to treat specific inflammatory conditions such as Kawasaki disease, pericarditis and rheumatic fever, and its long-term use helps prevent further heart attacks, blood clots and ischemic strokes in people with a high level of risk [38]; (v) Trimethoprim (TR): an antibiotic used mainly in the treatment of urinary tract infections; it has also been used for treatment of acute otitis media caused by Streptococcus pneumoniae and Haemophilus influenzae [39]; (vi) Ibuprofen (IB): a nonsteroidal anti-inflammatory drug commonly used for the treatment of inflammation, fever and pain caused by migraines, menstrual cramps and rheumatoid arthritis [37]; and (vii) Caffeine (C): a central nervous system stimulant that is the most commonly used psychoactive substance in the world and whose intakes may protect against some
diseases such as Parkinson's disease [37]. Considered mixtures contain five or six of these products in the same solution. Voltammetric measurements were made with a commercial screen-printed carbon electrode (SPCE) at three concentration levels in solutions of pH ranging from 2 to 12. Then, the evolution of the main parameters of the signals (peak current, peak area, half-peak width and, especially, peak potential) were studied in order to furnish a feasible strategy to identify the analytes from these data. For the exploratory data analysis, PCA was used, whereas different models were tested for the discrimination of substances by partial least squares discriminant analysis (PLS-DA) and supporting vector machine discriminant analysis (SVM-DA). This last approach is based on the supporting vector machine (SVM) methodology, a non-linear strategy that has evolved in the last years as a valuable tool for the analysis of non-linear data [40–42]. In light of these results, some conclusions are drawn about the perspectives of a future methodology for the qualitative sensing of pharmaceutical products mainly in natural waters and wastewaters.
2. Materials and Methods
2.1. Chemicals
Ascorbic acid (AA), uric acid (UA), paracetamol (P), acetylsalicylic acid (AS), trimethoprim (TR), ibuprofen (IB), caffeine (C) and boric acid were supplied by Sigma-Aldrich (St. Louis, MO, USA). Glacial acetic acid, potassium hydroxide and phosphoric acid were provided by Merck (Darmstadt, Germany). Absolute ethanol was purchased from Panreac (Barcelona, Spain). All reagents employed were of analytical grade.
Stock standard solutions of AA, UA, P, AS and C at 10−2 mol L−1 were prepared in ultrapure
water (Milli-Q plus 185 system, Millipore), whereas 5 × 10⁻³ and 10−2 mol L−1 stock standard solutions
of TR and IB, respectively, were prepared in absolute ethanol. All stock solutions were stored at 4 °C in the refrigerator safeguarded from light.
Britton-Robinson (BR) aqueous universal buffer solutions in the pH range of 2–12 consist of a
mixture of acetic acid, boric acid and phosphoric acid at a concentration of 0.04 mol L−1 each, and
adjusted to the desired pH with 1 mol L−1 KOH.
2.2. Apparatus
For differential pulse voltammetry (DPV) an Autolab System PGSTAT12 (EcoChemie, The Netherlands) attached to a VA Stand 663 (Metrohm, Switzerland) was employed. For data acquisition a GPES software version 4.9 (EcoChemie) was used.
The working electrode was a carbon screen-printed electrode (SPCE, 4 mm diameter) provided by Metrohm DropSens (Oviedo, Spain) and connected to the Autolab System by means of a flexible
cable (ref. CAC, Metrohm DropSens). Pt wire auxiliary electrode and Ag/AgCl/KCl (3 mol L−1)
reference electrode were purchased from Metrohm (Switzerland). A Crison micro pH 2000 was used for pH measurements.
2.3. Voltammetric measurements
DPV measurements using SPCE were carried out scanning the potential from −0.2 to 1.6 V using a pulse time of 50 ms, a pulse amplitude of 100 mV, a step potential of 5 mV, and a scan rate of
10 mV s−1. All experiments were performed without any oxygen removal.
DPV measurements of each considered mixture of pharmaceutical products were carried out at
three concentration levels: 10, 25 and 50 mg L−1, and at twenty pH values ranging from 2 to 12 using
a different SPCE unit for each pH value assessed. In this sense, it should be mentioned that a SPCE unit could be used for a large set of measurements (more than 20), enabling the performance of the DPV measurements involved for a single pH value without loss of sensitivity [23]. In addition, every
new SPCE unit was scanned in a 25 mg L−1 control mixture at pH 5.7 to subsequently correct the
possible variability derived from the performance of DPV measurements on different days and using different SPCE units.
2.4. Data treatment
Characteristic parameters of voltammetric signals (peak potential, peak height, peak area and half-peak width) were obtained from experimental voltammograms by means of GPES program by Autolab and also by using home-made programs developed for Matlab® environment [43]. In the chemometric analysis of data by PCA, PLS-DA and SVM-DA, PLS_Toolbox [44] (a toolbox especially designed for Matlab by Eigenvector) was employed.
3. Results and discussion
3.1. Preliminary study
As mentioned in the introduction, seven pharmaceutical products were considered: ascorbic acid (AA), uric acid (UA), paracetamol (P), acetylsalicylic acid (AS), trimethoprim (TR), ibuprofen (IB) and caffeine (C). Three combinations of these substances were considered with the following compositions: (1) AA, P, AS, IB and C; (2) AA, P, AS, TR and C; and 3) AA, UA, P, AS, IB and C. Each
mixture was measured at the three concentration levels (10, 25 and 50 mg L−1) and at twenty pH
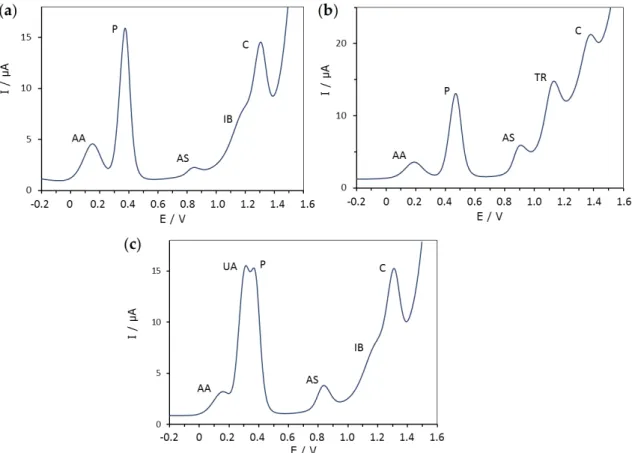
values ranging from 2 to 12. Figure 1 shows the composition of all three mixtures and the position of the corresponding DPV peaks at a concentration and pH value where all signals are visible.
Figure 1. Typical differential pulse voltammograms (DPV) of the three mixtures studied (a–c), which contained different combinations of 25 mg L-1 of ascorbic acid (AA), uric acid (UA), paracetamol (P), acetylsalicylic acid (AS), trimethoprim (TR), ibuprofen (IB) and caffeine (C) at pH 6.01 (a), 4.55 (b) and 6.01 (c).
Figure 2 shows that, as pH increases, all the peaks move to less positive potentials, but the potential shift can be quite different. Moreover, there is a general decrease of the peak height at extreme pH values. In fact, apart from paracetamol, the signals disappear at too low and, especially, too high pH values. As for the baseline, it dramatically increases at alkaline pH, distorting and hiding the peaks which appear at the most positive potentials (Figure 2).
Figure 2. Evolution of the DPV voltammograms as a function of pH in the mixture of AA, P, AS, TR and C at a concentration of 25 mg L−1 of every substance. Baselines have been progressively increased for a better view of the signals. The corresponding pH values are shown close to each voltammogram. Depending on the pH value, some signals can overlap with each other or with the baseline, but most of the time they are reasonably separated. This allowed us to determine the characteristic parameters of the signals and study their evolution with pH. From the preliminary study of these parameters (not shown) it was clear that only the peak potential exhibited a reproducible variation that was very similar at all three concentration levels and in the three mixtures studied, as shown by Figure 3. The correction by using the peak potentials measured with every new electrode in a control mixture at pH 5.7 slightly increased the reproducibility of peak potentials (differences lower than 10 mV in most of cases, very low as compared to the evolution of several hundred mV along the pH). It was also clear that pH values higher than 9 produced too high baselines and caused the disappearance of most of the signals, so that they were discarded for further analysis.
From Figure 3 it is clear that the evolution of peak potentials with pH is a key parameter that can help to discriminate between signals of unknown substances which appear in the same potential region. In the next section, PCA, PLS-DA and SVM-DA methods will be applied for this purpose.
Figure 3. Evolution of the DPV peak potentials as a function of pH for all the pharmaceutical products considered in the three mixtures analyzed (45 peaks in total). The corresponding substances are indicated at the right of every series of points.
3.2. Discrimination of peaks from their evolution with pH
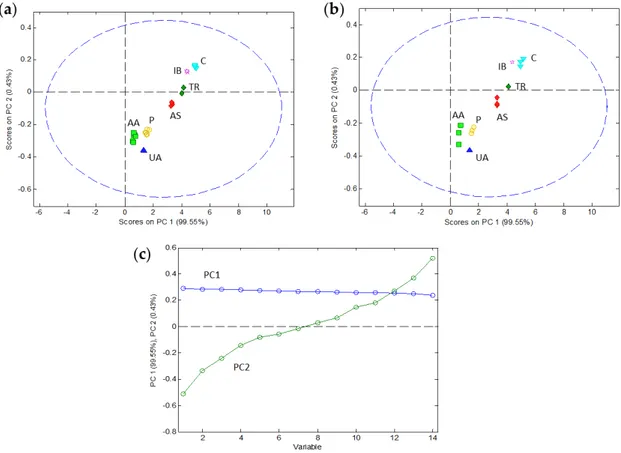
In order to investigate different discrimination strategies, the peak potentials of the signals were organized in a calibration matrix of 30 samples/peaks (in rows) and 14 pH values from 1.94 to 8.76 (in columns) and a validation matrix of 15 samples (in rows) and 14 pH values (in columns). Every set included data from all seven analytes and all three mixtures at different concentrations. Concerning data pretreatment, some usual strategies such as mean centering and autoscale were tried, but they did not provide good results. Therefore, the original values of peak potentials were analyzed without any pretreatment. Only a few values at extreme pH had to be extrapolated by PLS-Toolbox for these analytes whose peak disappeared under these conditions (e.g., IB). Firstly, PCA was used to examine initial patterns in the data. Figure 4 summarizes the results of the application of PCA to the calibration and validation sets. A PCA model was successfully built with two principal components (PC), the first one (PC1) explaining 99.55% of the data variance and the second one (PC2) explaining 0.43% of the variance. The loadings plot (Figure 4c) suggests that the first component represents the ‘average’ position of the peak in the potential axis, whereas the second component is essentially related to the evolution of the peak potential with pH. When we look at the scores plot (Figure 4a) this intuition is confirmed: the substances are ordered along the PC1 axis according to their ‘average’ peak potential or, in other words, with the same distribution along the potential axis that could be seen in the voltammograms of the mixtures (Figure 1). As for the second component, it separates the samples according to the signal evolution with pH being on the upper side of the plot with smaller potential shifts (e.g., IB and C) and on the lower side with higher potential shifts (e.g., AA, UA and P). Although PC2 is far less important than PC1 in explaining the overall data variance (0.43% vs. 99.55%), it is very useful to separate along the vertical axis the scores of the substances with similar peak potentials and, hence, very close in the horizontal (PC1) axis (e.g., UA and P or IB and TR). As Figure 4a shows, the PCA model of two components allows a reasonable separation of the scores corresponding to the seven pharmaceutical products in the calibration set. Additionally, the application of the model (i.e., the PCA loadings) to the validation set produced scores for these products (Figure 4b) very close to those achieved by the same substances in the calibration step.
Figure 4. Results of the principal component analysis (PCA) of the peak potential data as a function of pH. The calibration set with 30 peaks/samples at 14 pH values allowed us to build a PCA model with two principal components (PC) whose scores (a) and loadings (c) are shown. The application of this model to the validation set with 15 peaks/samples at the same 14 pH values produced the scores shown in (b). The identification of each sample in the scores plot is made with characteristic colors and the corresponding acronyms.
The PCA of peak potentials allows a qualitative discrimination of substances, but it lacks a quantitative estimation of the probability of a peak belonging to a certain substance. This is just what PLS-DA can do. Figure 5 shows the results of applying this methodology to the same calibration and validation data sets used in PCA. This has been achieved with a set of seven PLS-DA models with four latent variables (LV) each. Every calibration model is made by assigning the value of 1 to the samples belonging to the class (e.g., peaks of ascorbic acid, AA) and 0 to the samples belonging to other predefined classes (i.e., peaks of other substances). As a result, the model predicts a value for every sample that, if it is close to 1, means that the sample belongs to the class and, if closer to zero, suggests that the sample does not belong to the class. For instance, Figure 5a shows the predictions of the AA model for the samples of the calibration set. The values of the AA samples (in red color) are quite close to 1, while the other samples are closer to zero. The dashed red line shows the threshold value, that clearly separates the samples belonging to the class (above the line) from the samples of other classes (below the line). Figure 5b shows the predictions for the AA samples of the validation set, which are also very good. In both cases, several parameters can be computed to quantify the accuracy of the classification. The most interesting ones are the sensitivity (positive samples identified / total positive samples), the specificity (negative samples identified / total negative samples) and the classification error (percentage of badly classified samples as compared to the total number of samples). The corresponding values for the AA model are 1.0, 1.0 and 0%, which are perfect. Table 1 summarizes these and other relevant parameters for the seven substances considered.
Figure 5. Relevant plots of the partial least squares discriminant analysis (PLS-DA) of the peak potential data as a function of pH. Seven PLS-DA models with 4 latent variables (LV) were built with the calibration set and yielded class predictions for all seven substances. As an example, (a) and (b) show the predictions about the class of ascorbic acid (AA) for the calibration and validation samples, respectively. AA samples are denoted in red and the threshold level is shown with a red dashed line. (c) and (d) show the class assignation to calibration and validation samples, respectively, according to the strict criterion (unassigned samples are denoted with zero). (e) and (f) show the most probable class assignation to calibration and validation samples, respectively.
As it can be seen, not all substances are equally well classified by the PLS-DA models. For instance, relatively high classification errors can be found for substances like P, AS or C which may have eventual problems of overlapping with the baseline or with neighbor peaks. A good evaluation of the overall classification ability of the set of PLS-DA models is the assignment of the samples of a data set to the predefined classes. If the strict assignation criterion is used (Figure 5c,d), only the samples clearly surpassing the threshold are assigned and, hence, several samples remain unassigned. This produces a relatively high overall prediction error (Table 1), especially in the validation set (46.7%). In contrast, the assignment of absolutely all the samples to the most probable class (Figure 5e,f) produce much better results (0% in the calibration set and 20% in the validation set).
As already pointed out, PLS-DA is a linear method, which means that it is based on the hypothesis that all the electroactive substances contribute linearly to the signals. Unfortunately, this is not always true in voltammetric measurements. As this could be the source of some weaknesses of
the PLS-DA approach, we decided to try a more sophisticated, non-linear method such as SVM-DA, also implemented in PLS-Toolbox. Despite its higher complexity, SVM-DA provides results that can be visualized in a similar way as before. Thus, Figure 6a,b show the probability that the calibration and validation samples belong to the AA class (quite high, in agreement with the high values predicted in Figure 5a,b), Figure 6c,d show the ‘strict’ classification and Figure 6e,f show the most probable classification of both calibration and validation samples, respectively.
Figure 6. Relevant plots of the support vector machine discriminant analysis (SVM-DA) of the peak potential data as a function of pH. The overall SVM-DA model predicts the probability of each sample to belong to every predefined class. As an example, (a) and (b) show the predictions about the class of ascorbic acid (AA) for the calibration and validation samples, respectively. AA samples are denoted in red. (c) and (d) show the class assignation to calibration and validation samples, respectively, according to the strict criterion (unassigned samples are denoted with zero). (e) and (f) show the most probable class assignation to calibration and validation samples, respectively.
Table 1. Summary of the main results obtained in the discrimination of samples by PLS-DA of 4 LV and SVM-DA for both the calibration set (Cal.) and the validation set (Val.). The parameters are provided for the individual classification of every substance and for the overall classification in both strict and most probable modes.
Method Data Parameter AA UA P AS TR IB C Overall strict Most probable PLS-DA Cal. Sensitivity 1.00 1.00 1.00 0.83 1.00 1.00 1.00 - - Specificity 1.00 1.00 0.83 0.79 1.00 1.00 1.00 - - Class. error (%) 0.0 0.0 13.3 20.0 0.0 0.0 0.0 26.7 0.0 RMSEC1 0.167 0.211 0.329 0.316 0.204 0.225 0.257 - - Bias −0.003 0.006 −0.007 0.004 0.001 −0.002 0.002 - - R2 0.825 0.285 0.326 0.377 0.329 0.152 0.244 - - Val. Sensitivity 1.00 1.00 0.67 1.00 1.00 0.00 0.67 - - Specificity 1.00 0.93 0.75 0.67 1.00 0.86 0.92 - - Class. error (%) 0.00 3.30 26.70 26.70 0.00 20.00 13.30 46.7 20.0 RMSEP2 0.385 0.226 0.352 0.567 0.203 0.443 0.361 - - Bias −0.069 0.023 −0.011 0.072 −0.002 −0.004 −0.009 - - R2 0.580 0.207 0.241 0.069 0.005 0.267 0.294 - - SVM-DA Cal. Sensitivity 1.00 1.00 1.00 1.00 1.00 1.00 1.00 - - Specificity 1.00 1.00 1.00 1.00 1.00 1.00 1.00 - - Class. error (%) 0.0 0.0 0.0 0.0 0.0 0.0 0.0 23.3 0.0 Val. Sensitivity 1.00 1.00 1.00 1.00 1.00 1.00 0.67 - - Specificity 1.00 1.00 1.00 1.00 1.00 0.93 1.00 - - Class. error (%) 0.00 0.00 0.00 0.00 0.00 3.60 16.70 20.0 0.0 1 Root mean square error of calibration. 2 Root mean square error of prediction.
The qualitative comparison of the plots in Figures 5 and 6 and, especially, the values of the error parameters summarized in Table 1, confirm a significantly better classification when SVM-DA is used (0% of error for both calibration and validation samples when the most probable classification is used).
4. Conclusions
The present work shows that the determination of the peak potentials of DPV signals at different pH values using commercial screen-printed electrodes could be used to discriminate unknown pharmaceutical products, mainly in natural waters and wastewaters samples but also in food products cultivated using reclaimed water, if the data are processed with a chemometric method of discriminant analysis. For this purpose, PCA is a convenient exploratory tool, PLS-DA provides a reasonable classification and SVM-DA appears to be a very promising strategy for the discrimination or even the identification of pharmaceutical products, as it seems to be less affected by the inherent non-linearity of voltammetric data.
Taking into account the large number of pharmaceutical products that are oxidized in the potential region considered in this work, it does not seem feasible to univocally identify individual substances in real samples by using this methodology. Instead, it seems more convenient to determine peak potentials of relevant pharmaceutical products as a function of pH and build an extensive database with them. The use of an inner standard like paracetamol (with a clearly visible signal even at extreme pH values) could help to minimize the variability of peak potentials due to secondary phenomena caused by the presence of other electroactive substances or by matrix effects. Then, the database could be used to build discrimination models (PLS-DA or SVM-DA) to stablish groups of substances of similar behavior and assign unknown analytes to these groups. The application of the model to unknown samples would only require the DPV measurement of the sample in the presence of the inner standard at several pH values, which can be achieved with successive additions of a KOH solution to the acidic form of the Britton–Robinson buffer.
Author Contributions: Conceptualization, N.S. and J.M.D.-C.; experimental methodology, N.S.; software and data analysis, J.M.D.-C.; investigation, J.M.; writing—original draft preparation, N.S. and J.M.D.-C.; writing— review and editing, N.S., C.A. and J.M.D.-C. All authors have read and agreed to the published version of the manuscript.
Funding: This research was funded by the Generalitat of Catalunya (Project 2017SGR311).
Acknowledgments: The authors acknowledge the support of the Water Research Institute (IdRA) and the Faculty of Chemistry of the University of Barcelona for the acquisition of fungible materials needed for this work.
Conflicts of Interest: The authors declare no conflict of interest.
References
1. World Health Organization. Pharmaceuticals in Drinking-Water; World Health Organization: Geneva, Switzerland, 2011.
2. Fatta-Kassinos, D.; Meric, S.; Nikolaou, A. Pharmaceutical residues in environmental waters and wastewater: Current state of knowledge and future research. Anal. Bioanal. Chem. 2011, 399, 251–275, doi:10.1007/s00216-010-4300-9.
3. Verlicchi, P.; Al Aukidy; M.; Zambello, E. Occurrence of pharmaceutical compounds in urban wastewater: Removal, mass load and environmental risk after a secondary treatment—A review. Sci. Total Environ. 2012,
429, 123–155, doi:10.1016/j.scitotenv.2012.04.028.
4. Rivera-Utrilla, J.; Sánchez-Polo, M.; Ferro-García, M.A.; Prados-Joya, G.; Ocampo-Pérez, R.
Pharmaceuticals as emerging contaminants and their removal from water. A review. Chemosphere 2013, 93, 1268–1287, doi:10.1016/j.chemosphere.2013.07.059.
5. Rehman, M.S.U.; Rashid, N.; Ashfaq, M.; Saif, A.; Ahmad, N.; Han, J.I. Global risk of pharmaceutical contamination from highly populated developing countries. Chemosphere 2015, 138, 1045–1055, doi:10.1016/j.chemosphere.2013.02.036.
6. Yang, Y.; Ok, Y.S.; Kim, K.H.; Kwon, E.E.; Tsang, Y.F. Occurrences and removal of pharmaceuticals and personal care products (PPCPs) in drinking water and water/sewage treatment plants: A review. Sci. Total
Environ. 2017, 596, 303–320, doi:10.1016/j.scitotenv.2017.04.102.
7. Mandaric, L.; Diamantini, E.; Stella, E.; Cano-Paoli, K.; Valle-Sistac, J.; Molins-Delgado, D.; Bellin, A.; Chiogna, G.; Majone, B.; Diaz-Cruz, M.S.; et al. Contamination sources and distribution patterns of pharmaceuticals and personal care products in Alpine rivers strongly affected by tourism. Sci. Total
Environ. 2017, 590, 484–494, doi:10.1016/j.scitotenv.2017.02.185.
8. Kantiani, L.; Llorca, M.; Sanchís, J.; Farré, M.; Barceló, D. Emerging food contaminants: A review. Anal.
Bioanal. Chem. 2010, 398, 2413–2427, doi:10.1007/s00216-010-3944-9.
9. Wilkinson, J.L.; Hooda, P.S.; Barker, J. Ecotoxic pharmaceuticals, personal care products, and other emerging contaminants: A review of environmental, receptor-mediated, developmental, and epigenetic toxicity with discussion of proposed toxicity to humans. Crit. Rev. Environ. Sci. Technol. 2016, 46, 336–381, doi:10.1080/10643389.2015.1096876.
10. Jurado, A.; Walther, M.; Díaz-Cruz, M.S. Occurrence, fate and environmental risk assessment of the organic microcontaminants included in the Watch Lists set by EU Decisions 2015/495 and 2018/840 in the groundwater of Spain. Sci. Total Environ. 2019, 663, 285–296, doi:10.1016/j.scitotenv.2019.01.270.
11. Commission Implementing Decision (EU) 2015/495 of 20 March 2015 establishing a watch list of substances for Union-wide monitoring in the field of water policy pursuant to Directive 2008/105/EC of the European Parliament and of the Council. Available online: https://eur-lex.europa.eu/legal-content/EN/ALL/?uri=CELEX%3A32015D0495 (accessed 6 May 2020).
12. Petrovic, M.; Hernando, M.D.; Díaz-Cruz, M.S.; Barceló, D. Liquid chromatography-tandem mass spectrometry for the analysis of pharmaceutical residues in environmental samples: A review. J.
Chromatogr. A 2005, 1067, 1–14, doi:10.1016/j.chroma.2004.10.110.
13. Buchberger, W.W. Current approaches to trace analysis of pharmaceuticals and personal care products in the environment. J. Chromatog. A 2011, 1218, 603–618, doi:10.1016/j.chroma.2010.10.040.
14. Patrolecco, L; Ademollo, N.; Grenni, P.; Tolomei, A.; Caracciolo, A.B.; Capri, S. Simultaneous determination of human pharmaceuticals in water samples by solid phase extraction and HPLC with UV-fluorescence detection. Microchem. J. 2013, 107, 165–171, doi:10.1016/j.microc.2012.05.035.
15. Kim, C.; Ryu, H.D.; Chung, E.G.; Kim, Y.; Lee, J.K. A review of analytical procedures for the simultaneous determination of medically important veterinary antibiotics in environmental water: Sample preparation, liquid chromatography, and mass spectrometry. J. Environ. Manag. 2018, 217, 629–645, doi:10.1016/j.jenvman.2018.04.006.
16. Gupta, V.K.; Jain, R.; Radhapyari, K.; Jadon, N.; Agarwal, S. Voltammetric techniques for the assay of pharmaceuticals—A review. Anal. Biochem. 2011, 408, 179–196, doi:10.1016/j.ab.2010.09.027.
17. Amiri-Aref, M.; Raoof, J.B.; Ojani, R. A highly sensitive electrochemical sensor for simultaneous voltammetric determination of noradrenaline, acetaminophen, xanthine and caffeine based on a flavonoid nanostructured modified glassy carbon electrode. Sens. Actuators B Chem. 2014, 192, 634–641, doi:10.1016/j.snb.2013.11.006.
18. Cernat, A.; Tertiş, M.; Săndulescu, R.; Bedioui, F.; Cristea, A.; Cristea, C. Electrochemical sensors based on carbon nanomaterials for acetaminophen detection: A review. Anal. Chim. Acta 2015, 886, 16–28.
19. Li, M.; Li, Y.T.; Li, D.W.; Long, Y.T. Recent developments and applications of screen-printed electrodes in environmental assays—A review. Anal. Chim. Acta 2012, 734, 31–44, doi:10.1016/j.aca.2015.05.044.
20. Couto, R.A.S.; Lima, J.L.F.C.; Quinaz, M.B. Recent developments, characteristics and potential applications of screen-printed electrodes in pharmaceutical and biological analysis. Talanta 2016, 146, 801–814, doi:10.1016/j.talanta.2015.06.011.
21. Mohamed, H.M. Screen-printed disposable electrodes: Pharmaceutical applications and recent developments. Trends Anal. Chem. 2016, 82, 1–11, doi:10.1016/j.trac.2016.02.010.
22. Rahi, A.; Karimian, K.; Heli, H. Nanostructured materials in electroanalysis of pharmaceuticals. Anal.
Biochem. 2016, 497, 39–47, doi:10.1016/j.ab.2015.12.018.
23. Serrano, N.; Castilla, O.; Ariño, C.; Diaz-Cruz, M.S.; Díaz-Cruz, J.M. Commercial screen-printed electrodes based on carbon nanomaterials for a fast and cost-effective voltammetric determination of paracetamol, ibuprofen and caffeine in water samples. Sensors 2019, 19, 4039, doi:10.3390/s19184039.
24. Khairy, M.; Khorshed, A.A.; Rashwan, F.A.; Salah, G.A.; Abdel-Wadood, H.M.; Banks, C.E. Simultaneous voltammetric determination of antihypertensive drugs nifedipine and atenolol utilizing MgO nanoplatelet modified screen-printed electrodes in pharmaceuticals and human fluids. Sens. Actuators B Chem. 2017, 252, 1045–1054, doi:10.1016/j.snb.2017.06.105.
25. Zhang, Y.; Jiang, X.; Zhang, J.; Zhang, H.; Li, Y. Simultaneous voltammetric determination of acetaminophen and isoniazid using MXene modified screen-printed electrode. Biosens. Bioelectron. 2019,
130, 315–321, doi:10.1016/j.bios.2019.01.043.
26. Ortiz-Aguayo, D.; Bonet-San-Emeterio, M.; del Valle, M. Simultaneous voltammetric determination of acetaminophen, ascorbic acid and uric acid by use of integrated array of screen-printed electrodes and chemometric tools. Sensors 2019, 19, 3286, doi:10.3390/s19153286.
27. Slattery, S.J.; Blaho, J.K.; Lehnes J.; Goldsby, K.A. pH-Dependent metal-based redox couples as models for proton-coupled electron transfer reactions. Coord. Chem. Rev. 1998, 174, 391, doi:10.1016/S0010-8545(98)00143-X.
28. Stumm, W.; Morgan, J.J. Aquatic Chemistry, 2nd ed.; Wiley: New York, NY, USA, 1981; Chapter 7. 29. Heyrovsky, J.; Kuta, J. Principles of Polarography; Academic Press: New York, NY, USA, 1966; p. 161. 30. Brown, S.; Tauler, R.; Walczak, B. (Eds.) Comprehensive Chemometrics; Elsevier: Oxford, UK, 2009.
31. Díaz-Cruz, J.M.; Esteban, M.; Ariño, C. Chemometrics in Electroanalysis; Inside ‘Monographs in Electrochemistry’; Scholz, F., Ed.; Springer Nature: Cham, Switzerland, 2019, doi:10.1007/978-3-030-21384-8.
32. Alberich, A; Díaz-Cruz, J.M.; Ariño, C.; Esteban, M. Potential shift correction in multivariate curve resolution of voltammetric data. General formulation and application to some experimental systems.
Analyst 2008, 133, 112–125, doi:10.1039/B715667G.
33. Alberich, A.; Díaz-Cruz, J.M.; Ariño, C.; Esteban, M. Combined use of the potential shift correction and the simultaneous treatment of spectroscopic and electrochemical data by multivariate curve resolution: Analysis of a Pb(II)-phytochelatin system. Analyst 2008, 133, 470–477, doi:10.1039/B718285F.
34. Díaz-Cruz, J.M.; Sanchís, J.; Chekmeneva, E.; Ariño, C.; Esteban, M. Non-linear multivariate curve resolution analysis of voltammetric pH titrations. Analyst 2010, 135, 1653–1662, doi:10.1039/C0AN00088D. 35. Fact Sheet for Health Professionals—Vitamin C. Office of Dietary Supplements, US National Institutes of Health. Available online: https://ods.od.nih.gov/factsheets/VitaminC-HealthProfessional (accessed on 27 May 2020).
36. Kaur, H.; Halliwell, B. Action of biologically-relevant oxidizing species upon uric acid. Identification of uric acid oxidation products. Chem. Biol. Interact. 1990, 73, 235–247, doi:10.1016/0009-2797(90)90006-9. 37. Brunton L.L.; Lazo J.S.; Parker K.L. Goodman & Gilman’s the Pharmacological Basis of Therapeutics, 11th ed.;
Mc Graw Hill: New York, NY, USA, 2006.
38. Aspirin. AHFS DI Monographs of the American Society of Health-System Pharmacists. Available online: https://www.drugs.com/monograph/aspirin.html (accessed on 27 May 2020).
39. Trimethoprim. AHFS DI Monographs of the American Society of Health-System Pharmacists. https://www.drugs.com/monograph/trimethoprim.html (accessed on 27 May 2020).
40. Brereton, R.G.; Lloyd, G.R. Support vector machines for classification and regression. Analyst 2010, 135, 230–267, doi:10.1039/B918972F.
41. Luts, J.; Ojeda, F.; van de Plas, R.; de Moor, B.; van Huffel, S.; Suykens, J.A. A tutorial on support vector machine-based methods for classification problems in chemometrics. Anal. Chim. Acta 2010, 665, 129–145, doi:10.1016/j.aca.2010.03.030.
42. Nguyen, L. Tutorial on support vector machine. Appl. Comput. Math. 2017, 6, 1–15, doi:10.11648/j.acm.s.2017060401.11.
43. Matlab, version R2009b ed.; Mathworks Inc.: Natick, MA, USA, 2009.
44. PLS Toolbox Version 7.8.2; Eigenvector Research Inc.: Wenatchee, WA, USA, 2014.
© 2020 by the authors. Licensee MDPI, Basel, Switzerland. This article is an open access article distributed under the terms and conditions of the Creative Commons Attribution (CC BY) license (http://creativecommons.org/licenses/by/4.0/).