i
Effects of anthropogenic activities on life cycle and abundance of Penaeus (Melicertus) kerathurus in the Adriatic Sea.
A dissertation submitted in partial fulfillment of the requirements for the
degree of
Doctor of Philosophy
Università Politecnica delle Marche
2016
CURRICULUM: MARINE BIOLOGY AND ECOLOGY Student: Luca Bolognini Tutor: Prof. Ike Olivotto
ii UNIVERSITÀ POLITECNICA DELLE MARCHE
Effects of anthropogenic activities on life cycle and abundance of Penaeus (Melicertus) kerathurus in the Adriatic Sea.
Luca Bolognini
Academic tutor:
External co-tutor:
External co-tutor:
Thesis on the biology and ecology of caramote prawn in the Northern-Central Adriatic Sea in relation to human activities, with particular attention to reproductive biology, the effects of breakwaters in the biological cycle of the species and the main population parameters.
Professor Ike Olivotto
Dipartimento di Scienze della Vita e dell’Ambiente
Dr. Alessandro Lucchetti Consiglio Nazionale delle Ricerche – Istituto di Scienze Marine
Dr. Carlo Froglia
Consiglio Nazionale delle Ricerche – Istituto di Scienze
iii UNIVERSITÀ POLITECNICA DELLE MARCHE
Luca Bolognini
Abstract
Effects of anthropogenic activities on life cycle and abundance of Penaeus (Melicertus) kerathurus in the Adriatic Sea.
Penaeus kerathurus is a widespread species on Mediterranean sandy-muddy seabeds; in the Adriatic Sea it was reported since 1863.
The data indicate that in the Adriatic Sea landing of this species increased from 167 t in 2004 to 550 tonnes in 2010. This work was performed in order to identify the causes that led such an increase of this stock.
The study of reproductive biology has shown that 53% of the specimens was represented by females. The size at first sexual maturity was 40.3 mm (LC) for females and 19.7 mm LC for males The gonado-somatic index revealed a peak in July, while gonadal development was made up of 5 stages: previtellogenesis, early and late vitellogenesis, mature eggs and atresia. The profile of the gonadal lipid content and the GSI trends are well correlated. The environmental characterization of a sea area protected by breakwaters showed the presence of juveniles P. kerathurus in the summer months, with a peak in August, showing high densities.
In addition, the lengths frequency distribution revealed a marked sexual dimorphism; the sizes of males showed a range between 17 and 38 mm while for females between 17 and 58 mm LC.
Therefore, the study area seem to represent a possible nursery area for various species, including P. kerathurus, which has been regularly surveyed during the summer period of three years of sampling. This suggests that the construction of breakwater barriers may have changed the habitat, forming a sort of man-made lagoon, with thermal/hydrodynamic characteristics ideal for prawn juveniles. These particular areas seem to positively act opn the species growth.
The study also highlighted the high reproductive capacity of the species and the pronounced reproductive seasonality.
iv Effetti di attività antropogeniche sul ciclo vitale e abbondanza di Penaeus (Melicertus) kerathurus nel mare Adriatico.
Riassunto
Penaeus kerathurus è una specie diffusa su fondali sabbio-fangosi Mediterranei; in Adriatico fu segnalata a partire dal 1863.
I dati degli sbarcati indicano che in Adriatico questa specie è passata dalle 167 t del 2004 alle 550 t del 2010. Il presente lavoro è stato svolto al fine di identificare le cause che hanno portato all’aumento di questo stock.
Lo studio della biologia riproduttiva ha evidenziato che il 53% degli esemplari è rappresentato da femmine. La taglia di prima maturità sessuale è di 40,3 mm (LC) per le femmine e di 19,7 mm LC per i maschi. L’indice gonado-somatico ha rivelato un picco nel mese di luglio, mentre lo sviluppo gonadico è risultato composto da 5 stadi: previtellogenesi, vitellogenesi iniziale e avanzata, ovociti maturi ed atresia. Il profilo del contenuto lipidico delle gonadi e il trend dell’IGS sono risultati significativamente correlati.
La caratterizzazione ambientale di un tratto di mare protetto da frangiflutti ha dimostrato la presenza di esemplari giovanili di P. kerathurus nei mesi estivi, con un picco in agosto 2013, durante il quale la specie ha raggiunto elevate densità.
Inoltre la distribuzione di frequenza delle lunghezze ha evidenziato uno spiccato dimorfismo sessuale; i maschi hanno mostrato un range di taglie compreso tra 17 e 38 mm e compreso tra 17 e 58 mm LC le femmine.
Pertanto, l’area di studio sembra connotarsi come una possibile area di nursery per varie specie, tra cui P. kerathurus, che è stata regolarmente censita durante il periodo estivo dei tre anni di campionamento. Ciò lascia supporre che la costruzione di barriere frangiflutto possa aver modificato l’habitat, andando a formare una sorta di laguna artificiale, con caratteristiche termiche/idrodinamiche idonee ad essere sfruttate dalle fasi giovanili della mazzancolla, che in questo ambiente trovano le condizioni ambientali idonee per accrescersi.
Lo studio ha inoltre evidenziato l’elevata capacità riproduttiva della specie e la netta stagionalità riproduttiva.
1
TABLE OF CONTENTS
Abstract ... iii
Riassunto ... iv
1. Biology of the caramote prawn ... 4
1.1 Morphology ... 4
1.2 Ecology ... 6
1.2.1 Geographical and bathymetric distribution ... 6
1.2.2 Habitat ... 6
1.2.3 Diet... 7
1.3 Biology ... 8
1.3.1 Growth ... 8
1.3.2 Sexual maturity and reproduction ... 11
1.3.3 Recruitment ... 14
1.4 Evaluation ... 14
1.5 Exploitation ... 16
1.5.1 Fishery ... 16
1.5.2 Exploitation pattern ... 18
1.6 Captures trends of P. kerathurus at different spatial and time scale ... 19
1.6.1 Global capture ... 19
1.6.2 National capture ... 20
1.6.3 Capture in GSA 17: Northern Adriatic Sea ... 21
1.6.4 Regional capture in the Adriatic Sea ... 24
1.6.5 Local capture of P. kerathurus... 26
2. Hypothesis and purpose of the study ... 29
3. Reproductive biology ... 31
3.1 Introduction ... 31
3.2 Materials and Methods ... 34
3.2.1 Sampling ... 34
3.3 Results ... 38
3.3.1 Sex-ratio ... 38
3.3.2 Female LFD-Monthly Frequency of Spermatophores ... 38
3.3.2 Size at First Sexual Maturity ... 41
3.3.4 Gonado Somtic Index (GSI) ... 41
3.3.5 Histology ... 43
3.3.6 Lipid Profile ... 47
3.4 Discussion ... 59
4. identification of nursery areas of P. kerathurus in northern and central Adriatic sea ... 64
2
4.1 Introduction ... 64
4.2 Materials and Methods ... 66
4.2.1 Study Area ... 66
4.2.2 Control Site ... 67
4.2.3 Natural Lagoon ... 68
4.2.4 Temperature Monitoring in the Study Area ... 69
4.2.5 Sampling of P. kerathurus ... 72 4.2.6 Laboratory Analysis ... 76 4.2.7 Data Analysis ... 77 4.3 Results ... 80 4.3.1 Study Area ... 80 4.3.1.2 Abundance... 88 4.3.1.3 Dominance ... 95
4.3.1.4 Total Species Richness ... 97
4.3.1.5 Average Richness ... 98
4.3.1.6 Shannon - Wiener’s Diversity Index ... 99
4.3.2 Study area, control site and natural Marano Lagoon in summer 2015 ... 103 4.4 Marine Litter ... 107 4.5 Discussion ... 109 5. Population parameters ... 113 5.1 Introduction ... 113 5.2 Results ... 118 5.2.1 Morphometry ... 118
5.2.2 Length-Weight Relationship of P. kerathurus ... 120
5.2.3 Von Bertalanffy Growth Function Parameters ... 125
5.2.4 Total Mortality Rate Z ... 129
5.3 Discussion ... 130
6. Conclusion ... 134
3
Penaeus kerathurus
(Forskål, 1775)
IT: mazzancolla; EN: caramote prawn; FR: caramote; ES: langostino
FAO-3alphacode: TGS MEDITS code: PENAKER
4
1. BIOLOGY OF THE CARAMOTE PRAWN
1.1 Morphology
Commonly known as caramote prawn, Penaeus kerathurus belongs to the Penaeidae family. It has a light coloration with transversal pink-light orange bands or spots (Fig. 1).
The rostrum is quite short and slightly exceeds the eyes; the lower edge shows a single tooth and this is a distinguishing mark of the species with respect to other penaeids, whilst it has a dozen teeth, reaching half carapace, on the upper edge. From this last point, another typical characteristics of the species can be observed: a deep and narrow furrow reaching the posterior edge, originated by a doubling of rostral carina. A crest runs parallel to this furrow and reaches the rostrum point, thus delimiting another furrow. The carapace is well calcified, with carinas and furrows between the supra-orbital and hepatic spine, in the anterior lateral half. A spine can be found on the coxopodite and basipodite of the Ist and IInd pair of pereio-pods. Posterior abdominal segments show a more marked dorsal carina, from the IVth segment, terminating in a spine in the VIth segment (Zariquiey Alvarez 1968).
5 Fig. 1. Lateral (above) and upper (below) view of P.
6
1.2 Ecology
1.2.1 Geographical and bathymetric distribution
The caramote prawn can be found in all Italian seas, in the Mediterranean and Eastern Atlantic, from England to Angola (Palomares & Pauly 2015), on soft bottoms of the continental shelf, typically at depths lower than 60 m (Froglia et al. 2013). This crustacean, which is an indigenous species of the Mediterranean Sea, is reported in different sectors and areas with different names. However, the caramote prawn was unknown in the Adriatic sea till the second half of the last century and was reported for the first time only in 1863 (Heller 1863); Pesta in 1918 still expressed some doubts about its presence in the Northern Adriatic sea (Pesta 1918).
1.2.2 Habitat
P. kerathurus spends most of the day burried in the sediment where it lives; it gets out mainly during the night in order to feed and, during the reproduction season, to mate. It is a euryhaline species; during the breeding season it migrates in coastal waters and toward the river mouths. It can also be found in brackish water lagoons (Falciai & Minervini 1992). It is a typically resident species, and migrates towards and from the coast only to favor reproduction (Lumare et al.
7 1971). Adults can be found in typically marine salt waters, whilst during their post-larval and juvenile stages, the species favors low salinity environments, such as estuaries and lagoons, due to the abundance of preys. Its marked euryhalinity is due to an efficient osmoregulatory mechanism, which allows it to expel water in hypohaline environments and ions in hyperhaline environments (Palmeggiano 1983). This complicated osmoregulating system is negatively affected by temperature and determines winter migration towards the open sea, where temperature is more constant (Palmeggiano 1983).
1.2.3 Diet
This species has extremely varied feeding habits, mostly influenced by seasonal availability of benthic preys, mainly crustaceans, annelids and mollusks. Samples taken in the Central Adriatic sea (Prato et al. 2011), showed that amphipods represented the most abundant feeding resource, followed by mollusks and anellids. Among amphipods, the most represented genus, is Ampelisca, followed by Corophium and Gammarus. The same authors reported a prevalence of mollusks and amphipods in stomach contents, during summer and of anellids, mollusks and foraminifera during winter.
Several species, among which, nematodes and ophiurids are observed as occasional preys. Besides active predation, which is performed mainly during
8 the night, the caramote prawn does not disdain organic remains, which represent a necrophagous component of its diet. Juveniles (~60 mm CL) seem to feed mainly on amphipods and bivalves, as well as gasteropods and crustaceans (Prato et al. 2011), which are abundant in estuary and lagoon brackish waters.
1.3 Biology 1.3.1 Growth
Like most penaeids, also P. kerathurus shows a clear sexual dimorphism, due above all to the larger sizes of females which, in the Mediterranean, may reach a maximum total length of 225 mm, whilst in males the maximum size is of 180 mm (Holthuis 1980; Fig. 2). Anyway, the most common size in commercial landings is within a range of 110-140 mm TL for males and 130-170 mm TL for females (Holthuis 1980).
Fig. 2. Example of total length (TL), carapace length (CL) and tail length in a crustacean.
9 Growth is fast in the first months of life, and continues in the following months thanks also to good climatic conditions and abundance of food in coastal waters; seasonal differences, strictly associated with temperature can be observed. The average age is of about 20 months (Rodriguez 1987) and only a few specimens can reach their third year of life (Vitale et al. 2010; Froglia et al. 2013). In particular, in Italian seas, sizes of 63.3 mm CL for females and 52.7 mm CL for males were reported in western waters of the South of Sicily (Vitale et al. 2010) and 63 mm CL for females and 43 mm CL for males in Tuscani waters (Righini et al. 1998). Von Bertalanffy growth function parameters reported in literature for different Geographical sub-areas (GSA) of the Mediterranean Sea (Fig. 3) are shown in Tab. I.
Fig. 3. Geographical sub-division of the Mediterranean Sea (FAO Statistical Division, red lines; GFCM Geographical Sub-Area, black lines)
10 The Geographical Sub-Areas (Fig. 3) were established by the General Fisheries Commission for the Mediterranean area division, through resolution GFCM/33/2009/2.
Tab. I. Von Bertalanffy growth function parameters. GSA: Geographical Sub-Area.
A study carried out by Vitale et al. (2010) off south-western coast of Sicily estimated a relationships between length/age (Tab. II), highlighting, through a length distribution analysis, that population was made up of two dominant modes, represented by one or two years old specimens, and only by a few three years old specimens. Another survey conducted along Tuscan coasts estimated size/age values smaller than the previous ones (Righini et al. 1998), as specified in Tab. II.
Tab. III shows parameters of the length-weight relationship = !"# (Bolognini 2015).
GSA/Area Method Sex L∞ (CL, mm) k t0 Reference
GSA 9
Ligurian & North Tyrrhenian Sea LFD
F 64.90 0.70 -
(Righini et al. 1998)
M 46.00 0.90 -
GSA 16
South of Sicily LFD C 72.00 0.78 - (Vitale et al. 2010)
GSA 20
Eastern Ionian Sea LFD
F 69.70 1.06 - (Conides et al. 2006) C 59.69 1.05 - M 62.70 1.25 - GSA 4 Algeria LFD F 64.14 0.80 - (El Mekki 1994) M 45.50 1.00 - GSA 13 Gulf of Hammamet LFD F 54.25 0.60 - (Ben Mariem 2004) M 37.46 0.78 -
11 Tab. II. P. kerathurus length at age.
Tab. III. P. kerathurus length-weight relationship parameters.
1.3.2 Sexual maturity and reproduction
P. kerathurus sexual activity is strongly affected by water temperature (Holthuis 1980). Actually, gonadal maturation takes place during spring/summer (Lumare et al. 1971). June and July are the months with the highest percentage of mature females (about 85%): in this period all females have spermatophores adhering to their thelycum, as reported by Lumare et al. (2011) in south Adriatic. Usually,
GSA/Area Sex Age I Age II Age III Reference
GSA 9
Ligurian & North Tyrrhenian Sea
F 32.7 48.90 57.00
(Righini et al. 1998)
M 27.3 38.40 42.90
GSA 16
South of Sicily C 39.0 56.87 65.07 (Vitale et al. 2010)
GSA/Area Sex a b Units Reference
GSA 9
Ligurian & North Tyrrhenian Sea
F 0.0029 2.54 LC mm, W g (Righini et al. 1998) M 0.0037 2.47 LC mm, W g F 0.0036 2.48 LC mm, W g (Carbonara et al. 2012) M 0.0015 2.71 LC mm, W g C 0.0025 2.57 LC mm, W g GSA 10
South & Central Tyrrhenian Sea C 0.0064 2.33 LC mm, W g
GSA 18 Southern Adriatic Sea
F 0.0027 2.55 LC mm, W g
M 0.0017 2.69 LC mm, W g
C 0.0031 2.51 LC mm, W g
GSA 19 Western Ionian Sea
F 0.0043 2.42 LC mm, W g (Carbonara et al. 2012) M 0.0021 2.63 LC mm, W g C 0.0053 2.36 LC mm, W g GSA 13 Gulf of Hammamet F 0.0036 2.48 LC mm, W g (Ben Mariem 1995) M 0.0047 2.41 LC mm, W g
Gulf of Cádiz F 7.36 10-6 3.00 LC mm, W g (Rodriguez 1987)
12 mating occurs during the night, between a non-exuviating male and an exuviating female (Scovacricchi 1994). A male lays 2 winged spermatophores into female’s thelycum. The spawning takes place during the night and usually has a short duration. The number of eggs varies according to animal size (Scovacricchi 1994). Upon spawning, eggs have an average diameter of about 0.2-0.3 mm. Hatching begins in around 16-30 hours (Heldt 1938) and, larval succession entails three different phases: nauplius, zoea and mysis (Fig. 4). This species performs the typical larval succession of decapod penaeidae crustaceans. The first larval stage (nauplius) moves towards the surface where phytoplankton is more abundant. A nauplius exuviates several times, and grows up till full transformation in protozoea and, then, in zoea. The latter actively feeds on phytoplankton and it is strongly attracted by light and brackish water environments (estuaries and lagoons) where it can find extremely favorable trophic and thermal conditions, above all during spring-summer. Once it reaches the last larval stage of mysis, it starts feeding on zooplankton. Benthic post-larvae go on developing in brackish waters and coastal environments until they reach a juvenile stage. At the end of summer season juveniles leave coastal areas, and settle on infralittoral sandy bottoms, where waters are less affected by surface temperature variations (Scovacricchi 1994; Fig. 4).
13 According to Rodriguez (1987), size at first maturity of females is estimated to be around 120 mm TL, whilst Lumare et al. (2011) estimates such size in 31.4 mm CL for males and 45.5 mm CL for females ( Tab. IV).
Righini et al. (1998) reported females/males ratio at 0.9 during spring, 1.2 during summer, 1.0 during autumn and 1.1 during winter, therefore slightly in favor of females, as observed by Rodriguez (1977) in the Gulf of Cǎdiz. Lumare et al. (2011) reported a males/females ratio in southern Adriatic sea of 1.44, with fluctuations comprised between 0.61 and 2.70.
Fig. 4. Biological cycle of P. kerathurus (from Palmeggiano 1983, modified by Author, Bolognini 2015). Reproduction coastal water (spring) Deep water (winter) Nauplius Zoea Mysis Brackish water (summer) Larval succession:
14 Tab. IV. P. kerathurus reproductive period and size
at first maturity.
1.3.3 Recruitment
Lumare (2009) reports that caramote prawn reproduction takes place in coastal waters, close to the shore (June-July). Within one or two months at a weight around 0.25-1.50 g juveniles migrate into lagoons. At the end of summer (September-October), due to temperature decrease and a reduction of trophic resources, young caramote prawns migrate in the opposite direction, from lagoon to the open sea (Fig. 4).
1.4 Evaluation
Caramote prawn is extremely appreciated by consumers, with a high commercial value at the markets (Lumare & Scordella 2001). However, catches of this species were not important, from an economical point of view, until a few years ago, considering modest landings; indeed, it appeared in FAO statistics only in 2005. Although caramote prawn occurs in all Italian seas, it
GSA/Area Spawning period Sex Size at 50% maturity (CL, mm) Reference
GSA 17
Central & Northern Adriatic Sea Jun-Jul
F 45.56
(Lumare et al. 2011)
15 does not represent a targeted species but it is a high-valuable by-catch of bottom trawl fishery. This species is caught also with passive nets, particularly during summer in southern Adriatic (Lumare et al. 2011) and during autumn in Tuscan waters (Righini et al. 1998).
In the Mediterranean Sea the assessment of demersal resources is carried out in the framework of “MEDITS project”. The MEDITS survey programme (International bottom trawl survey in the Mediterranean) intends to produce basic information on benthic and demersal species in terms of population distribution as well as demographic structure, on the continental shelves and along the upper slopes at a global scale in the Mediterranean Sea, through systematic bottom trawl surveys. However, density and biomass indexes obtained within MEDITS surveys are not indicative of the real abundance of such species because of the type of sampling gear and sampling protocol. In fact, data coming from the exploratory fishing surveys in the framework of SoleMon project (AdriaMed 2011) carried out with rapido trawl (a towed trawl net with a rigid frame with rakes at mouth) in the GSA 17, showed higher biomass and density indexes than those obtained during MEDITS survey, although fluctuating between 85.9 and 314.4 ind./km2 (Fig. 5).
16
1.5 Exploitation 1.5.1 Fishery
Official commercial landing data for the period 2004-2013, highlighted the importance gained by this species in recent years, above all in the GSAs 9, 17 and 18. For example, in GSA 17 landings increased from 167 t in 2004 up to 550 t in 2010 (Tab. V; Bolognini 2015). In this latter area, a peak of catch is recorded in the last quarter of the year, ascribable to migration of the new generation born during summer, towards the open sea, when recruitment into fishery takes place (Froglia et al. 2013). Anyway, the high price of caramote prawns, independently of landing quantitative values, makes this resource important for fishery in certain period (Froglia et al. 2013; Righini et al. 1998).
0 100 200 300 400 500 2005 2006 2007 2008 2009 2010 N . in d ./ k m 2
Fig. 5. P. kerathurus. Temporal evolution of the density index (No. ind./km2±standard deviation) in GSA 17 (SoleMon, late-fall surveys; AdriaMed, 2011, modified).
17 Tab. V. P. kerathurus official landings (tons) in the
Italian GSAs from 2004 to 2013 (source MIPAAF).
GSA/Area 2004 2005 2006 2007 2008 2009 2010 2011 2012 2013
GSA 9
Ligurian & North Tyrrhenian Sea 30.7 86.5 59.7 82.1 85.6 124.9 142.6 128.3 145.5 73.6 GSA 10
South Tyrrhenian Sea 2.7 7.3 21.8 25.6 13.9 17.8 15.7 22.9 22.7 69.4 GSA 16
South of Sicily 19.2 18.2 23.1 7.4 1.7 13.1 1.3 0.9 2.1 0.4 GSA 17
Northern Adriatic Sea 169.0 179.0 317.9 690.5 501.7 515.2 550.3 545.9 324.1 386.2 GSA 18
Southern Adriatic Sea 5.2 1.4 7.2 32.5 30.5 111.1 116.8 28.3 75.3 100.7 GSA 19
18
1.5.2 Exploitation pattern
In Italy P. kerathurus is mainly caught by bottom trawling (both otter- and rapido trawl), and to a marginal extent, by small-scale fishing gears and polyvalent passive gears. National statistics (MIPAAF: Ministero delle Politiche Agricole Alimentari e Forestali; IREPA: Istituto di Ricerche Economiche per la Pesca e l’acquacoltura) show a general increase of caramote prawn catches in the period 2004-2012. Comparing catches trends obtained by different gears, bottom trawl showed an increase during the time, although a slight decline was recorded in the last years; vice-versa, catches produced by small-scale fishery showed a decreasing trend in the investigated period; finally, catches obtained with polyvalent passive gears had a minor importance
0 100 200 300 400 500 600 700 800 900 2004 2005 2006 2007 2008 2009 2010 2011 2012 C atc h ( to n s)
Bottom trawl Small-scale fishery Polyvalent passive gear
Fig. 6. P. kerathurus landing evolution (tons) in the period 2004-2012 for different gears in the Italian seas (source MIPAAF-IREPA).
19 (Bolognini 2015; Fig. 6). By way of example, Fig. 7 shows distribution according to size-frequency of P. kerathurus landings, obtained during SoleMon surveys, in GSA 17 in the period 2005-2010.
1.6 Captures trends of P. kerathurus at different spatial and time scale 1.6.1 Global capture
Due to its economic importance, P. kerathurus is caught in inshore water along all the Mediterranean coasts; instead, along the West African coast the species is of minor importance. 0 10 20 30 40 50 60 70 80 90 12 16 20 24 28 32 36 40 44 48 52 56 60 64 68 72 N · km -2 CL (mm) Penaeus kerathurus 2005 2006 2007 2008 2009 2010
Fig. 7. P. kerathurus length-frequency distribution of the
20 An overview of global catches of caramote prawn shows an increasing growth, more evident from 1970's until now (Fig. 8; FAO 2015).
1.6.2 National capture
Fishery statistics point out that catches of this species has become important in Italy only recently; in fact it appeared for the first time in 2005.
It is possible to remark a rapid growth, with maximum catches (over 850 tons) in 2007 and 2010 (Fig. 9; FAO, 2015).
Fig. 8. Global capture production (tonnes) for P.
kerathurus (1950-2013; FAO 2015). 0 2000 4000 6000 8000 19 50 19 53 19 56 19 59 19 62 19 65 19 68 19 71 19 74 19 77 19 80 19 83 19 86 19 89 19 92 19 95 19 98 20 01 20 04 20 07 20 10 20 13 T o n n es
21
1.6.3 Capture in GSA 17: Northern Adriatic Sea
A careful analysis of catches, comparing 2004 with 2012, highlights a significant decrease in landings and revenues, for the whole Geographical sub-area 17 "Northern Adriatic" (Fig. 10).
This phenomenon reflects what has been observed on a large scale in the whole Mediterranean basin. In detail, in the Geographical sub-area 17 some species showed a decrease that exceeded 50% both in landings and in revenues (Fig. 11). Only the caramote prawn showed an opposite trend, with an increase of
Fig. 9. Italian capture production (tonnes) for
Melicertus kerathurus (1950-2013; FAO , 2015) 0 200 400 600 800 1000 1950 1957 1964 1971 1978 1985 1992 1999 2006 2013 T o n n es
22 91.7% in landings (155 tons) and of 41.8% in revenues (1683 thousands of euro; source: Mipaaf – Irepa; Tab. VI).
0 10000 20000 30000 40000 T h o u sa n d s o f € 2004 2012
Fig. 11 Revenues (thousands of €) of some demersal stocks in GSA 17 – Northern Adriatic Sea, in 2004 and 2012. 0 2000 4000 6000 T o n n es 2004 2012
23 Tab. VI. Comparison between years 2004 and 2012 of some demersal target species expressed in tonnes (t) and thousands of euro (000 €) in Geographical Sub-Area 17 "Northern Adriatic" (source Mipaaf - IREPA).
t 000 € t 000 € t t % 000 € 000 € % Red mullet 3883 16262 1926 6251 -1342 -50.4% -10011 -61.6% Hake 3045 24335 1794 14251 -658 -41.1% -10084 -41.4% Common sole 2639 34531 1821 26264 -287 -31.1% -8267 -23.9% Tub gurnard 908 2767 588 2008 -215 -35.2% -759 -27.4% Angler fish 480 4691 350 3778 -152 -27.1% -913 -19.5% 10955 82586 6479 52552 -2654 -40.9% -30034 -36.4% European squid 932 11717 382 5320 -211 -59.0% -6397 -54.6% Musky octopus 1839 9285 766 4089 -451 -58.3% -5196 -56.0% Common cuttlefish 4439 30217 2609 19131 -450 -41.2% -11086 -36.7% Shortfin squid 951 3955 680 2711 -184 -28.5% -1244 -31.5% 8161 55174 4437 31251 -1296 -45.6% -23923 -43.4% Caramote prawn 169 4028 324 5711 155 +91,7% 1683 +41,8%
Spottail mantis shrimp 5013 28709 3150 22487 -1863 -37.2% -6222 -21.7%
Norway lobster 1904 28036 803 16037 -382 -57.8% -1999 -42.8%
7086 60773 4277 44235 -125 -39.6% -16538 -27.2%
26202 198533 15193 128038 -4075 -42.0% -70495 -35.5% Geographical Sub-Area 17 "Northern Adriatic"
Demersal target species
2004 2012 Variation Variation
Grand Total
Source: Mipaaf - IREPA
F i s h Tot. Fish M o l l u s c Tot. Mollusc C r u s t a c e a n s Tot. Crustaceans
24
1.6.4 Regional capture in the Adriatic Sea
In the last few years (2004 - 2013), fishing data from the trawl fleets of the Adriatic regions, show significant regional differences in terms of fishing effort (expressed in kilowatts, KW), total catch (expressed in tonnes, t) and catch per unit of effort (KgKW-1, CPUE). Also for prawn was just the same. Emilia Romagna was the most productive region in terms of catch per unit effort (8.4 kgKW-1 in 2007 and 4.7 kgKW-1 average of the period). Marche region was one with the highest catches totaled 298 t in 2010 and 177.5 t average of the period (Tab. VII).
Generally, since their appearance in the national statistics, catches of caramote prawn in the Adriatic Sea exhibited strong growth, with a peak that exceeded 700 tonnes in 2007. Although in recent years the catches of this species have remained at lower values, their trend appears evidently growing (Fig. 12), contrariwise from the trend observed for many groundfish species in this basin.
25 Tab. VII. Total effort (KW), total catches (t) and Total Catch per Unit Effort (kgKW-1), and catches and Catch per Unit Effort of caramote prawn for the Italian Adriatic regions, for the Geographical sub-area 17 and for the whole Adriatic Sea (data from Puglia region of 2013 refer only to the Adriatic side; source: Mipaaf-IREPA).
Region 2004 2005 2006 2007 2008 2009 2010 2011 2012 2013 KW 7656 7370 9047 8345 8344 8171 8101 7807 6521 3563 7492.5 t 1013 1056 1564 1986 1253 1381 1074 834 1033 424 1161.8 kg/KW 132 143 173 238 150 169 133 107 158 119 152 t 1 1 4 34 2 4 1 1 1 1 5 kg/KW 0.1 0.1 0.4 4.1 0.2 0.5 0.1 0.1 0.2 0.3 0.6 KW 47959 49186 45170 43025 41277 40260 41312 41230 38899 25334 41365.2 t 8215 7314 7060 7857 6207 6221 4894 3917 4096 7136 6291.7 kg/KW 171 149 156 183 150 155 118 95 105 282 156 t 2 6 15 98 39 31 24 18 14 13 26.0 kg/KW 0.0 0.1 0.3 2.3 0.9 0.8 0.6 0.4 0.4 0.5 0.6 KW 41513 32758 33599 31482 31754 32190 31209 34640 32925 28346 33041.6 t 8963 6377 5683 6434 6084 5679 4737 4706 4326 2595 5558.4 kg/KW 216 195 169 204 192 176 152 136 131 92 166 t 83 76 164 264 190 189 164 233 117 47 152.7 kg/KW 2.0 2.3 4.9 8.4 6.0 5.9 5.3 6.7 3.6 1.7 4.7 KW 61648 56412 48777 44410 44082 45361 44654 40345 41015 33827 46053.1 t 9968 11457 11666 10763 9326 8902 8693 7138 5892 6073 8987.8 kg/KW 162 203 239 242 212 196 195 177 144 180 195 t 59 78 123 257 213 235 298 211 132 169 177.5 kg/KW 1.0 1.4 2.5 5.8 4.8 5.2 6.7 5.2 3.2 5.0 4.1 KW 39773 29106 23454 20410 20107 20800 22385 22055 22818 22326 24323.4 t 7064 6121 5375 4078 3393 3873 3109 3001 3140 3186 4234.0 kg/KW 178 210 229 200 169 186 139 136 138 143 173 t 12 9 3 8 25 22 25 30 6 84 22.4 kg/KW 0.3 0.3 0.1 0.4 1.2 1.1 1.1 1.4 0.3 3.8 1.0 KW 7692 7859 8762 9034 9190 9584 9277 9046 7263 8634.0 t 1188 981 1377 1584 1508 1594 1573 1349 918 1341.3 kg/KW 154 125 157 175 164 166 170 149 126 154 t 12 10 9 28 32 34 38 52 54 53 32.2 kg/KW N.A. 1.3 1.1 3.2 3.5 3.7 4.0 5.6 6.0 7.3 4.0 KW 198549 182524 167906 156434 154598 155972 157245 155354 151224 120659 160046.4 t 35223 33513 32329 32495 27847 27564 24101 21169 19836 20332 27440.9 kg/KW 177 184 193 208 180 177 153 136 131 169 171 t 169 180 318 689 501 515 550 545 324 367 415.8 kg/KW 0.9 1.0 1.9 4.4 3.2 3.3 3.5 3.5 2.1 3.0 2.7 KW 106512 103210 100761 95523 95865 96207 95633 84788 81982 68035 92851.6 t 22.713 19.937 21.751 17.720 16.618 19.128 16.280 13.962 12.059 15.647 17581.5 kg/KW 213 193 216 186 173 199 170 165 147 230 189 t 5 1 7 32 30 111 117 28 76 101 50.8 kg/KW 0.0 0.0 0.0 0.3 0.3 1.2 1.2 0.3 0.9 1.5 0.6 KW 305061 285734 268667 251957 250463 252179 252878 240142 233206 188694 252898.1 t 57936 53450 54080 50215 44465 46692 40381 35131 31895 35979 45022.4 kg/KW 190 187 201 199 178 185 160 146 137 191 177 t 174 181 325 721 531 626 667 573 400 468 466.6 kg/KW 0.6 0.6 1.2 2.9 2.1 2.5 2.6 2.4 1.7 2.5 1.9 M a r c h e Tot. Caramote prawn P u g l i a A b r u z z o Tot. Caramote prawn M o l i s e V e n e t o Tot. Caramote prawn E m i l i a Tot. Caramote prawn Year Average period F r i u l i Tot. Caramote prawn Tot. Caramote prawn G S A 1 7 Tot. Caramote prawn Tot. Caramote prawn A d r i a t i c S e a Tot. Caramote prawn
26
1.6.5 Local capture of P. kerathurus
The statistics of P. kerathurus landings are not available prior to 1980 because at that time the common practice at the fish markets entailed the selling of few specimens in mixed boxes. Only at the end of 80's, when landings significantly increased, the caramote prawn catches were recorded separately in the statistics for product auctioned (Froglia et al. 2013). Data available for the Northern Adriatic fishing harbor as Chioggia (Fig. 13; Clodia database, 2013) and Central
2004 2005 2006 2007 2008 2009 2010 2011 2012 2013 Friuli 1 1 4 34 2 4 1 1 1 1,0 Veneto 2 6 15 98 39 31 24 18 14 13 Emilia 83 76 164 264 190 189 164 233 117 47 Marche 59 78 123 257 213 235 298 211 132 169 Abruzzo 12 9 3 8 25 22 25 30 6 84 Molise 12 10 9 28 32 34 38 52 54 53 Puglia 5 1 7 32 30 111 117 28 76 101 Adriatic Sea 174 181 325 721 531 626 667 573 400 468 0 100 200 300 400 500 600 700 800 T o n n es
Fig. 12. Catches of caramote prawn (t) in the Adriatic regions (coloured lines), in the whole Adriatic Sea (black line) and its trend (dashed line) in the period 2004-2012.
27 Adriatic as Ancona (Fig. 14; Froglia et al. 2013) point out a general increase in caramote prawn landings in the observed period.
Fig. 13. P. kerathurus landings (t) of Chioggia fishing harbor (Northern Adriatic Sea) from 1980 to 2013 (Clodia database, 2013) 0 10 20 30 40 50 T o n n es
28 Fig. 14. Catch of P. kerathurus landings (t)
auctioned by the trawlers fleet based in the Ancona fishing harbor (Central Adriatic Sea) from 2000 to 2012 (Froglia et al. 2013).
29
2. HYPOTHESIS AND PURPOSE OF THE STUDY
The presence of P. kerathurus in the Adriatic Sea appears to be relatively recent, dating the first uncertain records on the second half of 800's - early 900's from the southern side. At the beginning, this species bypassed the fishery statistics, because of the marketing practices in the Adriatic markets (see Froglia et al. 2013). However, the increased catches in recent years have made this species an object of interest, with the remarkable retail assessment of 36 €kg-1 (personal observation, 2015). In addition, the recent crisis of the fisheries sector and general decrease of fisheries resources leaded a growing interest for this species. Froglia et al. (2013) reported that the increase of P. kerathurus in certain areas and periods was linked to warmer waters and to a general decrease of other crustaceans such as the norway lobster Nephrops norvegicus, typical of cold-temperate waters.
The same authors refer to the P. kerathurus stock increase as another example of "meridionalization", a northward expansion of Mediterranean species in the past restricted to the southern sectors as a consequence of the Mediterranean Sea warming (Axaopoulos P. 2010).
These authors hypothesized the synergical action of at least two factors: 1) The Italian annual trawling ban for 30-45 days at the end of the summer.
30 2) An extension of nursery ground due to the construction of breakwaters, which could enhance recruitment.
The first factor, in force since 1987, aims at reducing fishing effort exerted by towed gears in the recruitment period of several species having a commercial interest. P. kerathurus could have benefit to this effort reduction in coastal water. This species is characterized by fast growth, reproduction at the end of first year of life and short life-span (max. <3 years).
As concerns the breakwaters, they represent a man-made structures that have been built in the last 50 years at 100-200 m from shoreline, parallel to the shore, to reduce erosion of sandy beaches (Dugan J.E. et al. 2011), a problem that plagues the Western Adriatic coast.
The purpose of this study is to investigate the biology and ecology of the caramote prawn in order to understand possible causes of the stock growth in the Adriatic, in contrast with the decreasing trends observed for other stocks already exploited by the commercial fishery. Based on the information reported on literature for this species, we want to elucidate if and how the construction of breakwaters can influence the biological cycle of the selected species, the role of water temperature, as well as filling some gaps on its reproductive biology and on the main parameters of the population in the selected area. The ultimate goal is to define how the biotic, abiotic and anthropogenic factors can affect the stock of P. kerathurus in Northern and Central Adriatic Sea.
31
3. REPRODUCTIVE BIOLOGY
3.1 Introduction
To better formulating proper management practices for fishery science, one of the main issue is reproductive biology. To understand the dynamics of a stock is crucial the relation between size and reproduction event, such as mating and sexual maturity (Perdichizzi et al. 2012).
One of the most important factor determining the reproductive potential of a species is the reproductive pattern, therefore the importance to understand the reproductive biology (ovarian development), such as for future domestication of the species in local waters (Kücükdermenci & Lok 2011).
In addition, standardization criteria for evaluating sexual maturity in target species was strongly recommended by International Council for the Exploitation of the Sea (ICES) and General Fisheries Council for the Mediterranean (GFCM). An Expert Group of ICES, recently (2010) has highlighted the need for a common system for classification of maturity stages in Crustaceans, which also pointed out the importance of histology as a tool for obtaining the highest accuracy in these type of studies (Perdichizzi et al. 2012). The reproductive cycle of penaeids are affected by many factors as seasonal rainfall, temperature regime, and depth, exhibiting a rather complex life history (Dall et al. 1990; Crocos et al. 2001). Typically, a bimodal seasonal spawning
32 patterns was exhibit by tropical and subtropical penaeids, while spawning becomes unimodal in penaeids that inhabit temperate latitudinal zones, characterized by only one well-defined recruitment period (Dall et al. 1990; Staples 1991; Crocos & van der Velde 1995).
During the reproductive cycle of crustaceans decapod, the ovarian development is accompanied by changes in color and size (Adiyodi & Subramonian 1983; Arculeo et al. 1995; Cavalli et al. 1997). In some species these changes in color are easily visualized and result from carotenoids content differences, which play an important role during embryogenesis (Goodwin 1951; Dall et al. 1995; Liñán-Cabello et al. 2002).
In recent years increased attention has been reported to the ovarian development of penaeid shrimp, and the macroscopic and histological characterization have been studied for various species, such as Melicertus japonicas (Yano 1988), Melicertus vannamei (Arcos et al. 2005), Melicertus semisulcatus (Badawi 1975), Melicertus kerathururs (Medina et al. 1996; Kücükdermenci & Lok 2011), Melicertus monodon (Tan-Fermin 1991; Quinitio et al. 1993), Litopenaeus setiferus (King 1948), Penaeus indicus (Subrahmanyam 1965), Melicertus aztecus (Caillouet 1972), Fenneropenaeus merguiensis (Crocos & Kerr 1983), Lucifer orientalis (Oka & Shirata 1965) and Melicertus plebejus (Kelemec & Smith 1980).
33 As suggested by many works, a crucial role during natural and induced sexual maturation of various shrimp species is exerted by lipid deposition that occurs in the ovary (Gehring 1974; Teshima & Kanazawa 1983; Galois 1984; Teshima, Kanazawa, Horinouchi, et al. 1988; Teshima, Kanazawa, Koshio, et al. 1988; Jeckel et al. 1989; Teshima et al. 1989; Bray et al. 1990). Several authors have suggested that successful maturation is dependent on diet (Brown, A. et al. 1979; Lawrence et al. 1980; Cahu & Quazuguel 1989). Relatively lipid richness of ovaries and eggs compared to the adult shrimp is due to the limited capacity since juvenile for de novo phospholipid synthesis and inability to synthesis cholesterol ( Teshima 1982; Teshima et al. 1986), then the quality of the dietary lipid source may be of great importance in maturation. There are very limited information on the quantitative changes that occur in the different lipid classes and their fatty acids during the maturation period.
The present study was focused on gametogenic cycle of caramote prawn in the northern and central Adriatic Sea. The current study aimed to contribute to characterizing reproduction in P. kerathurus using qualitative techniques such as histology of the ovaries and testis; quantitative parameters such as morphometry (carapace length CL, total length TL, body weight W, gender and gonado somatic index GSI) and combined technique (quali-quantitative) such as lipid composition profile of the ovary during maturation. An important role is played by lipids as sources of energy and as cell constituents in the processes
34 of spawning, embryogenesis, hatching and early development of crustacean larvae. The present study also aimed for the first time in Mediterranean Sea at explaining the variation in the lipid contents of the ovary during sexual maturation in wild P. kerathurus, based on the most recent analysis techniques.
3.2 Materials and Methods 3.2.1 Sampling
Specimens of wild P. kerathurus were monthly captured (when possible) from August 2013 to September 2015 from northern and central Adriatic Sea, Italy (Fig. 15). Specimens were collected from 39 sampling activities, 22 of them were scientific surveys and 17 of them were commercial fishery. Due to characteristic species migration, samples by commercial fishery were mainly obtained from trawlers in the period fall-winter and by artisanal fisheries in spring.
35
3.2.2 Prawn Measurement
Using a Vernier calliper with an accuracy of 0.01 mm, the carapace length (CL) of each specimens collected was measured from the eye orbit to rear dorsal end of the carapace (Fig. 16). Body wet weight was measured to the nearest 0.1 g (electronic balance Mettler PL 3000). Females were dissected; ovaries were gently removed and weighted at 0.0001 g (electronic analytical balance Mettler Toledo ML 204).
GSI was expressed as the percentage of the ovarian weight in relation to the total body weight (Medina et al. 1996) and calculated as:
GSI= !"#$%&'()*
!"#$%+'+),- !"#$%&'()*× 100 Fig. 15. P. kerathurus sampling area in northern and central Adriatic Sea, Italy.
36
3.2.3 Histology
After removal, ovaries were preserved in Dietrich solution (900 ml of distilled water, 450 ml of 95% ethanol, 150 ml of 40% formaldehyde and 30 ml of acetic acid) for histological analyses. Histological analyses were carried out on 31 female samples to evaluate gonadal development throughout the reproductive season and to validate the macroscopic stage attribution.
All samples, conserved in the fixative for at least 20 days, were embedded in paraplast, cut in transverse serial sections (7 µm) and mounted on slides. An
TL
CL
Fig. 16. Schematic representation of P. kerathurus measurements recorded: carapace length (CL) and total length (TL).
37 increasing alcohol concentration protocol was adopted for dehydration. Slides were then stained with Harrys’ hematoxylin and eosin (Pearse 1985).
Also male are dissected; deferent are gently removed and their content immediately examined under optical microscope (Wild M20; 40x) to check presence-absence of spermatozoids.
3.2.4 Lipid Profile
Sample Treatment - From February to September 2015, ovary of five
specimens per month were collected in order to define lipid composition. Ovaries were homogenized and lyophilized (lyophilized by sublimation to -80° C in very high vacuum) until constant weight. Lipids were extracted through microwave extraction with petroleum ether and acetone in a ratio of 2:1 (v/v; Ramalhosa et al. 2012). Methyl esters of fatty acids (FAMEs) were obtained from total lipid extraction adding 1% of sodium methylate in methanol (Carreau & Dubacq 1978).
FAMEs Analysis – Methyl ester of fatty acids analysis were performed with
gas chromatograph Agilent-6890 equipped with an Agilent-5973N quadrupole mass selective detector. Helium (He) has been used as carrier gas, at inlet temperature of 250° C; the injection volume was 1 µl; split ratio 1/50. The temperature program adopted was: 100° C (1 min.) to 150° C at 25° C/min., to 200° C at 5° C/min., to 230° C at 1° C/min.; transfer line 250° C. The mass
38 selective detector (MSD) parameters were: ion source at 230° C, quad MS at 150° C and SIM mode with 2 min. of solvent delay. Main ions fragment were recorded and for fatty acids identification a database of mass spectrum of reference has been used (NIST, National Institute of Standards and Technology, Gaithersburg, MD 2002).
3.3 Results 3.3.1 Sex-ratio
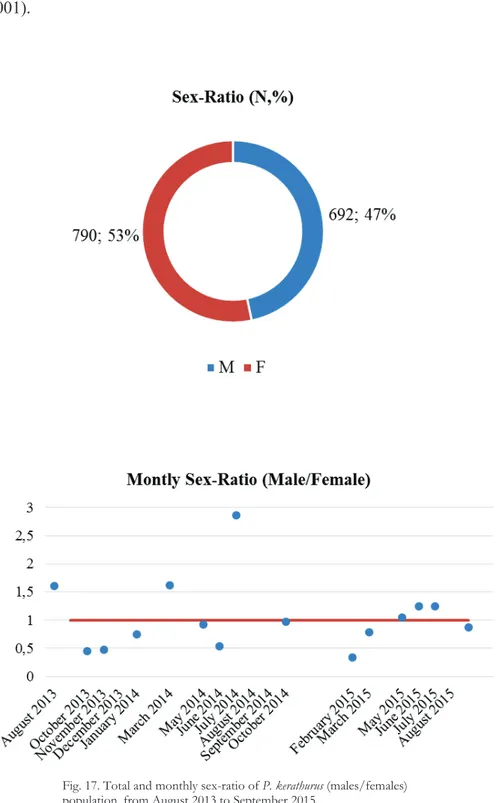
From August 2013 to September 2015 a total of 1482 P. kerathurus specimens were collected, 790 of these were female (53%) and 692 were male (47%; Fig. 17). The monthly analysis of sex-ratio shows an equilibrium condition with an average value of 1.05 (±0.65) males/females, and a minimum value of 0.34 in February 2015 and a maximum value of 2.85 in July 2014 (Fig. 17).
3.3.2 Female LFD-Monthly Frequency of Spermatophores
On a total of 789 females examined, 285 were found to be inseminated (36.12%). Their size ranged between 29 and 58 mm CL with a mean (±sd) of 44.31±5.28 while not inseminated showed a wider size range, with dominant smaller size classes with a mean of 37.90±7.28 mm CL, and ranged between 21 and 60 mm CL (Fig. 18). Significant differences for medians and size frequency distribution between this two groups have been observed (Mann-Whitney test:
39 U=33569, p<0.001; two-sample Kolmogorov-Smirnov test: D=0.46007, p<0.001).
Fig. 17. Total and monthly sex-ratio of P. kerathurus (males/females) population, from August 2013 to September 2015.
40 Fig. 18. Length-frequency distribution of P.
kerathurus females with and without spermatophores.
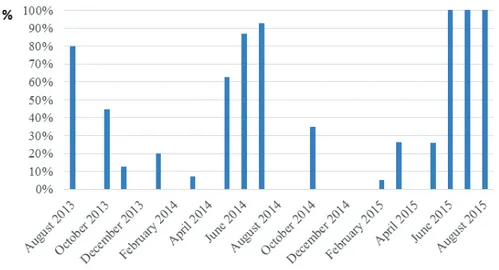
The monthly frequency of inseminated females shows highest percentage value during summer seasons, in particular June, July and August. These months exhibited values ranged from 87% in June 2014 to 100% in June and July 2015, while showed lower and variable values in October (44.8% in 2013 and 34.8% in 2014) and in May (62.5% in 2014 and 26.1% in 2015). Values under 26% of inseminated females were recorded in the remaining months (Fig. 19).
Values of August are not significant due to low number of specimens available because trawling ban is in place in that month.
41
3.3.2 Size at First Sexual Maturity
Size at first maturity based on the presence of spermatophores in female (CL50 Female) and based on well-developed sperms in male (CL50 Male) were estimated,
by logistic equation as described by King (1995), respectively in 40.3 mm CL for female (Fig. 21) and in 19.7 mm CL for male (Fig. 20).
3.3.4 Gonado Somtic Index (GSI)
Regarding variation of GSI for monthly-pooled data, a pronounced seasonality was exhibited. The minimum value was recorded on December (0.80±0.34) and in general, under 1.6 in winter months; a very pronounced increased values started from May (2.93±2.45) until July (11.24±5.72), followed by a decrease until October (2.23±2.70; Fig. 22).
Fig. 19. Monthly frequency of spermatophores (%) in P. kerathurus females, from August 2013 to September 2015.
42 Fig. 21. Logistic curve for the estimation of length at first maturity (on the left) based on
the occurrence of insemination in P. kerathurus females (on the right). Logistic equation: y=0.59515/(1+5.3185E09*exp(-0.5961x).
Fig. 20. Logistic curve for the estimation of length at first maturity (on the left) based on the occurrence of well-developed sperms in P. kerathurus males (on the right). Logistic equation: y=1.0144/(1+8.45E13*exp(-1.617x).
43 Fig. 22. Box and Whiskers plot of monthly variation
of GSI of P. kerathurus females.
3.3.5 Histology
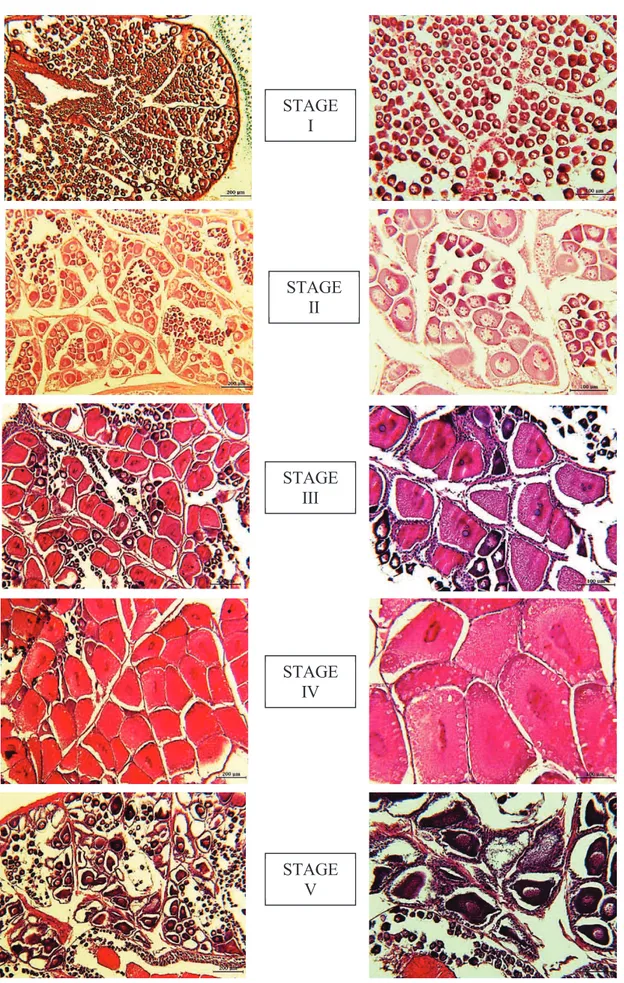
According to literature, five stages of ovarian development of P. kerathurus were identified, based on most advanced oocyte stage. Stages were:
STAGE I (PREVITELLOGENIC) – Macroscopically gonad are very small and not visible through the exoskeleton. The ovary contained mainly two categories of previtellogenic oocytes: the smaller oocytes (17-26 µm) at the center of the ovary and larger oocytes (26-65 µm) appear located more peripherally. Oogonia measured from 34 to 53 µm in diameter (Fig. 23, Fig. 24, Fig. 25).
STAGE II (EARLY VITELLOGENIC) – By naked eye, developing ovaries can be easily differentiated from other tissues. They are flaccid and white-ivory. Mainly represented by previtellogenic oocytes (80-100 µm in diameter) with presence of late vitellogenic oocytes. Cytoplasm increase in size and becomes
0 2 4 6 8 10 12 14 16 18 20 GSI
44 more basophilic. These oocytes, when are relatively small, are gradually surrounded by follicle cells. Central basophilic nucleus within cytoplasm with one or two nucleoli, that appear in perinucleus stage (Fig. 23, Fig. 24, Fig. 25). STAGE III (LATE VITELLOGENIC) – Fresh ovaries are large and visible through the exoskeleton and yellow to pale-olive. Ovaries contain large oocytes (90-150 µm), yolky, acidophilic, whereas the nucleolus is basophilic (Fig. 23, Fig. 24, Fig. 25).
STAGE IV (MATURE) – Ripe stage is recognized by large and turgid ovaries visible through the exoskeleton, from yellow to green intense color. Mature oocytes exceeds 150-200 µm and a conspicuous cortical rods at the cell periphery represents a typically distinctive feature (Fig. 23, Fig. 24, Fig. 25). STAGE V (SPENT) – Gonads were small, flaccid, and invisible through the exoskeleton. Ovaries are spent or had a resorbed appearance with presence of atretic (degenerating) oocites, nucleus disappears and germinal vesicle breakdown; cortical rods elongate and extending radially inward (Fig. 23, Fig. 24, Fig. 25).
Fig. 23. Female gonad of P. kerathurus after (left) and before dissection (right).
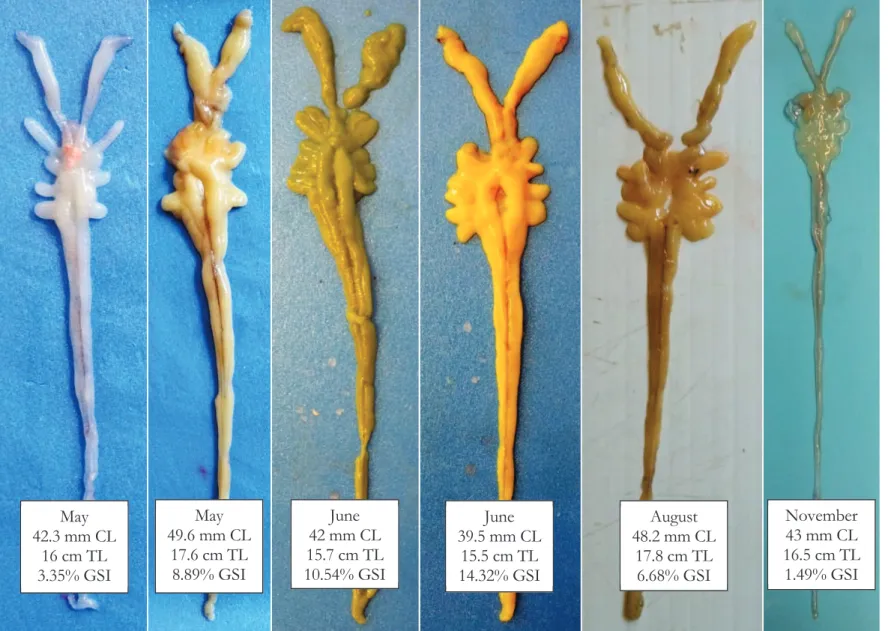
45 May 42.3 mm CL 16 cm TL 3.35% GSI May 49.6 mm CL 17.6 cm TL 8.89% GSI June 42 mm CL 15.7 cm TL 10.54% GSI June 39.5 mm CL 15.5 cm TL 14.32% GSI August 48.2 mm CL 17.8 cm TL 6.68% GSI November 43 mm CL 16.5 cm TL 1.49% GSI
Fig. 24. Macroscopic temporal variation of female gonad of P. kerathurus, from May to November (CL= carapace length, TL= total length, GSI= gonado-somatic index).
46 STAGE I STAGE II STAGE III STAGE IV STAGE V
Fig. 25. Histological sections of five stages of female gonad maturation of P. kerathurus (scale bars: 200 µm on the left, 100 µm on the right).
47
3.3.6 Lipid Profile
From February to September 2015 (except for April when samples are not available) mean value of extract lipids was 16.01±4.84 mg, corresponding to 7.1% of gonad sample dry weight. The minimum value was recorded in August (11.1 mg; 5.5%) and maximum in June (22.1; 8.8%).
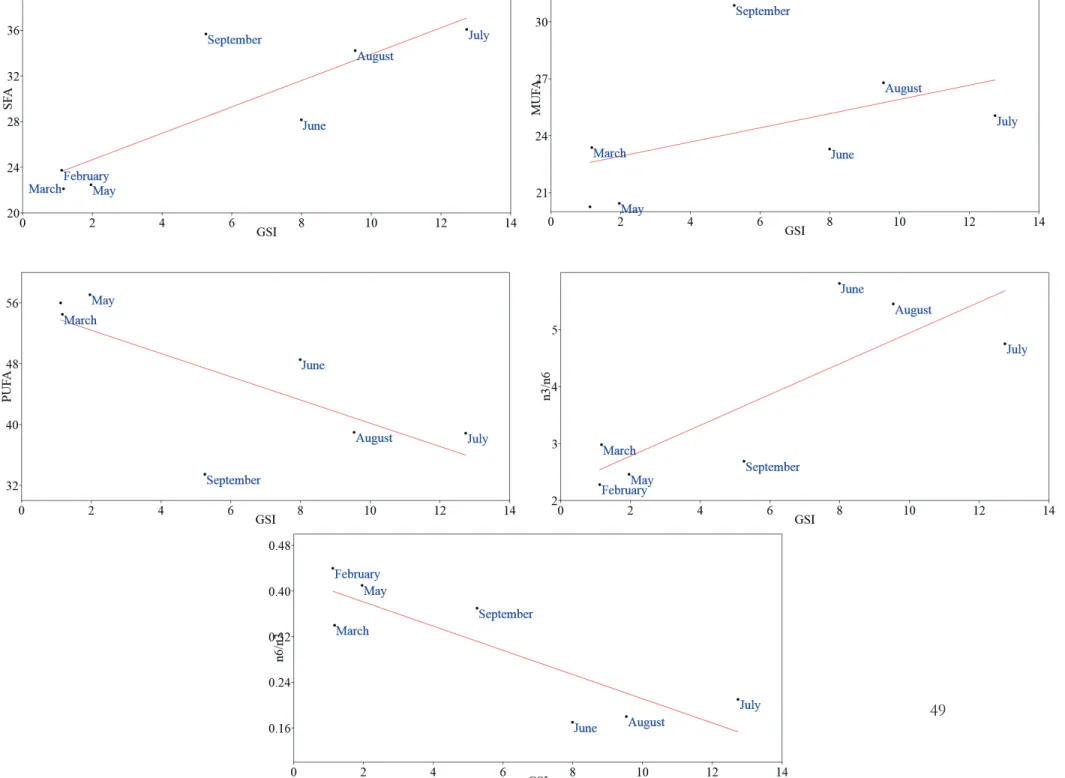
During this study, polyunsatured fatty acid (PUFA: ranged from 56.01% in February to 33.46% in September) showed higher values than satured fatty acid (SFA: from 22.12% in March to 36.08% in July) and monounsatured fatty acid (MUFA: from 20.26% in February to 30.86% in September), to exception for September, when SFA exceed PUFA value. In general, PUFA represented the main fraction in winter-spring season while it was comparable with SFA and MUFA in summer season. About essential fatty acids (EFAs), ratio between n3/n6 (ω3/ω6) PUFAs shows values in favor of n3, and ranged from 2.28 in February to 5.81 in June. Statistical analysis revealed significance correlations between SFA and n3/n6 PUFA ratio with GSI of sub-sample (respectively p=0.019 and p=0.024), as well as GSI of sub-sample of ovaries intended to lipid content showed high statistical significance with GSI of total females sample collected (p=0.0013; Tab. X; Fig. 26).
48 Tab. VIII. Total lipid contents in ovaries of P.
kerathurus from February to September 2015
expressed as mg and percentage, mean ± standard deviation.
Tab. IX. Percentage of satured fatty acid (SFA), monounsatured fatty acids (MUFA), poliunsatured fatty acid (PUFA), and n3/n6 ratio in ovarian of P.
kerathurus, from February to September 2015.
Tab. X. Correlation and linear regression parameters between GSI of sub-sample and satured fatty acid (SFA), monounsatured fatty acid (MUFA), polyunsatured fatty acis (PUFA), n3/n6 ratio and GSI of total sample (*=p<0.05; **=p<0.01).
Lipid February March May June July August September Mean ±sd
mg 13.8 12.5 14.0 22.1 15.0 11.1 23.6 16.0 4.8489
% 6.87 7.87 6.27 8.83 6.95 5.50 7.50 7.1 1.0854
February March May June July August September
SFA 23,74 22,12 22,47 28,16 36,08 34,23 35,68 MUFA 20,26 23,38 20,44 23,3 25,06 26,79 30,86 PUFA 56,01 54,5 57,09 48,54 38,86 38,98 33,46 n6/n3 0,44 0,34 0,41 0,17 0,21 0,18 0,37 n3/n6 2,28 2,98 2,46 5,81 4,75 5,45 2,69 Variable Slope (a) Intercept (b) r R 2 p SFA 1.1556 22.358 0.83393 0.69543 0.019699 * MUFA 0.37389 22.174 0.45953 0.21117 0.29957 PUFA -1.5299 55.472 -0.72649 0.52779 0.064429 n6/n3 -0.02122 0.42345 -0.85263 0.72699 0.014766 * n3/n6 0.27002 2.2397 0.81713 0.6677 0.024824 * GSI Tot 1.1287 -0.68743 0.9444 0.89189 0.001356 **
49
Fig. 26. Linear regression of GSI of sub-sample and satured fatty acid (SFA), monounsatured fatty acid (MUFA), polyunsatured fatty acid (PUFA), n3/n6,
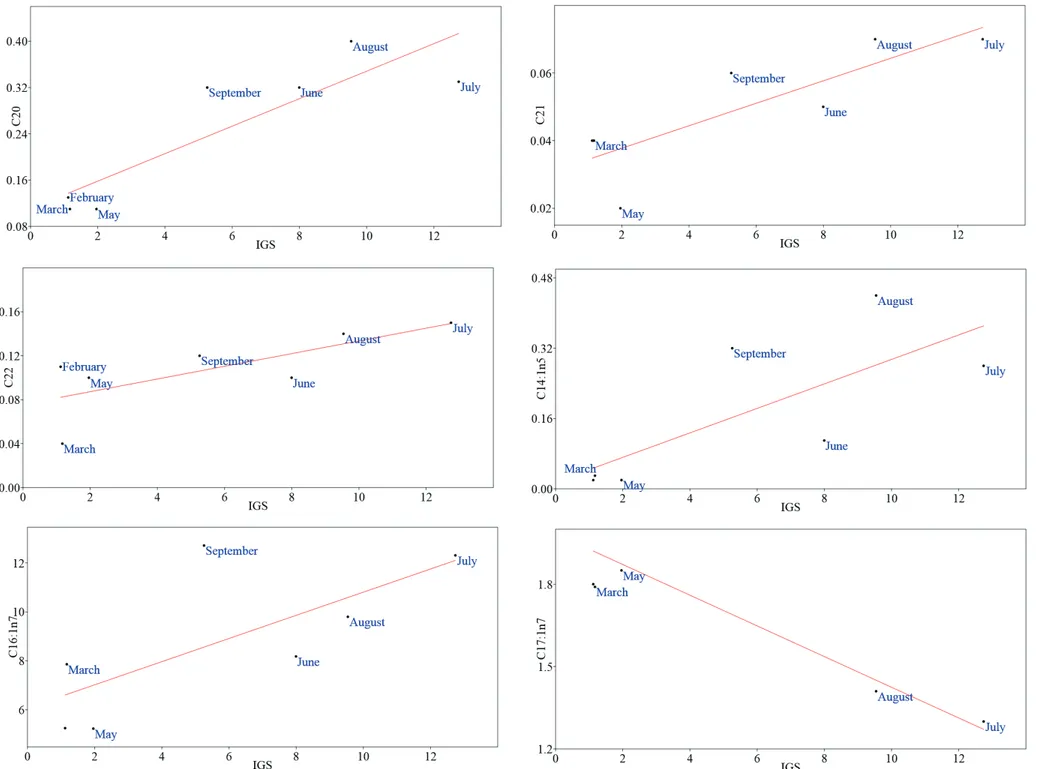
50 Lipid composition reflect gonad maturation during reproductive season. In more detail, some SFAs as the myristic acid (C12), palmitic acid (C16), heneicosylic acid (C21) and MUFAs as cis-vaccenic acid (C18:1 n7), euricic acid (C22:1 n9), and PUFAs as eicosapentaenoic acid (C20:5 n3; EPA), linoleic acid (C18:2 n6) and arachidonic acid (C20:4 n6; AA), have shown a statistical significant correlation with GSI of sub-sample (Tab. XI; Tab. XII; Tab. XIII). The multivariate linear regression revealed a positive relation between myristic, palmitic, heneicosylic, erucic acids and GSI and negative relation between cis-vaccenic, eicosapentaenoic (EPA), linoleic, arachidonic (AA) acids and the same GSI (Tab. XIII; Fig 27). High statistical significance correlation have been demonstrate for two SFAs as margaric acid (C17; p=0.0096) and arachidic acid (C20; p=0.0097); negative linear relation have shown the margaric acid and positive linear relation the arachidic acid (Tab. XIII; Fig 27). These last SFAs exhibited a strong fluctuation particularly evident in reproductive months, with minimum value in July (1.15±0.05) and maximum in February (2.42±0.06) the first, and minimum in March – May (both 0.11±0.01) and maximum in August (0.4±0.01) the second (Tab. XII).
51 Tab. XI. Classification of fatty acids extracted in the
sub-sample; satured fatty acid (SFA), monounsatured fatty acid (MUFA), polyunsatured fatty acid (PUFA), essential fatty acid (EFA), n3 (ω3), n6 (ω6).
Carbon Chain Common Name
SFA C12 Lauric acid C14 Myristic acid C15 Pentadecylic acid C16 Palmitic acid C17 Margaric acid C18 Stearic acid C20 Arachidic acid C21 Heneicosylic acid C22 Behenic acid MUFA C14:1n5 Myristoleic acid C16:1n7 Palmitoleic acid C17:1n7 Heptadecanoic acid C18:1n7 cis-vaccenic acid C18:1n9 Oleic acid C20:1n9 Eicosenoic acid C22:1n9 Erucic acid PUFA C16:2n7 EFA (n3)
C18:3n3 α-linolenic acid (ALA) C20:3n3 Eicosatrienoic acid (ETE) C20:5n3 Eicosapentaenoic acid (EPA) C22:6n3 Docosahexaenoic acid (DHA)
EFA (n6)
C18:2n6 Linoleic acid
C18:3n6 γ-linolenic acid (GLA)
C20:2n6 Eicosadienoic acid
C20:3n6 Dihomo-γ-linolenic acid (DGLA)
52
Tab. XII. Fatty acids content in P. kerathurus ovaries from February to September 2015, expressed as means ± standard deviation of dry weight.
February March May June July August September
C12 0,04 ± 0 0,32 ± 0,01 0,04 ± 0 0,63 ± 0,02 0,64 ± 0,54 1,21 ± 0,06 0,8 ± 0,09 C14 0,67 ± 0,02 1,65 ± 0,05 0,66 ± 0,02 2,91 ± 0,09 4,9 ± 0,24 6,12 ± 0,27 4,66 ± 0,49 C14:1n5 0,02 ± 0 0,03 ± 0 0,02 ± 0 0,11 ± 0 0,28 ± 0,2 0,44 ± 0,02 0,32 ± 0,03 C15 0,91 ± 0,03 1,08 ± 0,03 0,95 ± 0,02 0,99 ± 0,03 1,18 ± 0,01 1,35 ± 0,07 1,71 ± 0,17 C16 12,12 ± 0,2 12,02 ± 0,61 11,13 ± 0,18 16,2 ± 0,35 21,04 ± 0,76 16,22 ± 0,66 20,33 ± 2,31 C16:1n7 5,25 ± 0,17 7,86 ± 0,36 5,23 ± 0,09 8,18 ± 0,22 12,31 ± 0,45 9,8 ± 0,46 12,71 ± 1,26 C16:2n7 0,12 ± 0,01 0,15 ± 0 0,14 ± 0 0,13 ± 0 0,16 ± 0,01 0,14 ± 0,01 0,15 ± 0,01 C17 2,42 ± 0,06 1,83 ± 0,03 2,37 ± 0,04 1,17 ± 0,02 1,15 ± 0,05 1,39 ± 0,08 1,66 ± 0,14 C17:1n7 1,8 ± 0,11 1,79 ± 0,04 1,85 ± 0,03 1,12 ± 0,01 1,3 ± 0,06 1,41 ± 0,07 2,39 ± 0,22 C18 7,17 ± 0,13 4,94 ± 0,07 6,55 ± 0,11 5,76 ± 0,03 6,55 ± 0,25 7,26 ± 0,26 5,95 ± 0,41 C18:1n9 6,48 ± 0,11 6,86 ± 0,18 6,41 ± 0,11 7,67 ± 0,05 9,46 ± 0,32 9,66 ± 0,48 10,22 ± 0,79 C18:1n7 4,65 ± 0,07 5,17 ± 0,12 4,81 ± 0,08 4,37 ± 0,03 0,05 ± 0 3,85 ± 0,21 3,65 ± 0,27 C18:2n6 1,33 ± 0,04 1,41 ± 0 1,24 ± 0,06 1,23 ± 0,02 0,74 ± 0,03 0,84 ± 0,06 0,9 ± 0,07 C18:3n6 0,03 ± 0 0,08 ± 0 0,04 ± 0 0,13 ± 0 0,1 ± 0 0,1 ± 0 0,09 ± 0,01 C18:3n3 0,17 ± 0 0,27 ± 0,01 0,18 ± 0,04 0,57 ± 0,01 0,3 ± 0,02 0,36 ± 0,02 0,3 ± 0,03 C20 0,13 ± 0 0,11 ± 0,01 0,11 ± 0,01 0,32 ± 0,02 0,33 ± 0,01 0,4 ± 0,01 0,32 ± 0,03 C20:1n9 1,95 ± 0,04 1,58 ± 0,06 2,03 ± 0,12 1,72 ± 0,06 1,5 ± 0,03 1,43 ± 0,05 1,4 ± 0,08 C20:2n6 1,19 ± 0,04 2,42 ± 0,07 1,2 ± 0,36 1,48 ± 0,03 1,32 ± 0,03 1,22 ± 0,05 1,33 ± 0,09 C20:3n6 0,25 ± 0,02 0,3 ± 0,01 0,25 ± 0,04 0,34 ± 0,01 0,24 ± 0 0,23 ± 0,01 0,21 ± 0,03 C21 0,04 ± 0 0,04 ± 0 0,02 ± 0 0,05 ± 0 0,07 ± 0 0,07 ± 0 0,06 ± 0,01 C20:4n6 14,26 ± 0,15 9,42 ± 0,61 13,73 ± 0,2 3,93 ± 0,04 4,33 ± 0,14 3,63 ± 2,67 6,49 ± 0,39 C20:3n3 0,17 ± 0,02 0,17 ± 0,01 0,16 ± 0,01 0,34 ± 0,01 0,23 ± 0,01 0,23 ± 0,01 0,17 ± 0,01 C20:5n3 24,22 ± 0,42 24,3 ± 0,12 23,83 ± 0,18 18,2 ± 0,07 13,87 ± 2,48 17,71 ± 0,6 13,5 ± 0,68 C22 0,11 ± 0,02 0,04 ± 0 0,1 ± 0 0,1 ± 0,01 0,15 ± 0,01 0,14 ± 0,02 0,12 ± 0,03 C22:1n9 0,07 ± 0,01 0,04 ± 0,01 0,06 ± 0 0,11 ± 0,02 0,13 ± 0,01 0,1 ± 0,01 0,13 ± 0,03 C22:6n3 14,27 ± 0,32 15,98 ± 1,31 16,32 ± 0,42 22,18 ± 0,75 17,58 ± 0,33 14,51 ± 0,37 10,32 ± 7,59
53 Tab. XIII. Detailed correlation and linear regression
parameters between GSI of sub-sample and recorded satured fatty acids (SFAs), monounsatured fatty acids (MUFAs), polyunsatured fatty acisds (PUFAs), n3/n6 ratio and GSI of total sample (*=p<0.05; **=p<0.01). FAs Slope (a) Intercept (b) r R 2 p SFA C12 0.068063 0.13891 0.73227 0.53622 0.061289 C14 0.39899 0.81394 0.83204 0.69229 0.020242 * C15 0.020207 1.0523 0.32615 0.10637 0.47528 C16 0.7094 11.548 0.80338 0.64542 0.029524 * C17 -0.10104 2.2871 -0.87634 0.76797 0.009653 ** C18 0.044748 6.0571 0.24829 0.06165 0.59135 C20 0.023763 0.11067 0.87579 0.767 0.009758 ** C21 0.003326 0.031099 0.8321 0.6924 0.020223 * C22 0.00578 0.075726 0.73763 0.54409 0.058454 MUFA C14:1n5 0.027868 0.01591 0.74416 0.55378 0.055092 C16:1n7 0.47325 6.0733 0.71262 0.50783 0.072316 C17:1n7 -0.05588 1.9833 -0.59911 0.35894 0.15515 C18:1n7 -0.30914 5.5497 -0.81457 0.66352 0.025666 * C18:1n9 0.26351 6.611 0.73756 0.54399 0.058489 C20:1n9 -0.0328 1.8449 -0.59755 0.35706 0.15652 C22:1n9 0.006218 0.056091 0.80414 0.64664 0.029252 * PUFA C16:2n7 0.001277 0.13417 0.43361 0.18802 0.33108 EFA (n3) C18:3n3 0.016219 0.21497 0.55134 0.53267 0.19953 C20:3n3 0.008665 0.16076 0.61319 0.376 0.14313 C20:5n3 -0.84974 24.205 -0.81363 0.66199 0.025977 * C22:6n3 0.23082 14.568 0.29212 0.085334 0.52497 EFA (n6) C18:2n6 -0.04893 1.3766 -0.8421 0.70913 0.017444 * C18:3n6 0.005644 0.049356 0.72984 0.53267 0.062599 C20:2n6 -0.0315 1.6304 -0.32775 0.10742 0.47299 C20:3n6 -0.00118 0.26673 -0.12091 0.014618 0.79624 C20:4n6 -0.86109 12.864 -0.86023 0.74 0.012991 *
54
Fig. 27. Multivariate linear regressions between recorded fatty acids (FAs) and gonado somatic index (GSI) in the ovaries of P. kerathurus female from February to September.
55
Fig. 28 following. Multivariate linear regressions between recorded fatty acids (FAs) and gonado somatic index (GSI) in the ovaries of P. kerathurus female from February to September.
56
Fig. 29 following. Multivariate linear regressions between recorded fatty acids (FAs) and gonado somatic index (GSI) in the ovaries of P. kerathurus female from February to September.
57
Fig. 30 following. Multivariate linear regressions between recorded fatty acids (FAs) and gonado somatic index (GSI) in the ovaries of P. kerathurus female from February to September.
58
Fig. 31 following. Multivariate linear regressions between recorded fatty acids (FAs) and gonado somatic index (GSI) in the ovaries of P. kerathurus female from February to September.
59
3.4 Discussion
Within the present study valid information on reproductive biology of P. kerathurus were obtained. In more detail, a variable sex-ratio was observed during the study and also size at first sexual maturity, estimated in 40.3 mm of CL for female and 19.7 mm CL for male. While the female values were comparable with those reported in literature, the male values were well below to whatever so far reported. In more detail, 40.7 mm of CL for female and 39.2 mm of CL for male were the size at first sexual maturity estimated for P. kerathurus by Kevrekidis & Thessalou-Legaki (2012) in Thermaikos Gulf (N. Aegean Sea), instead, were estimated in 45.5 mm of CL for female and 31.4 mm of CL for male by Lumare et al. (2011) for the same species in South-Eastern coast of Italy. In addition, presence of spermatophore adhering to telycum in female have been strongly connected with seasonality and size of the specimen, indicating summer season as the best period for insemination, but, unlike what has been reported in Thermaikos Gulf by Kevrekidis & Thessalou-Legaki (2012), in the present study the percentage of inseminated female that exceed 50% were recorded only in summer months. The GSI ranged from 0.8 (December) to 11.2 (July), indicated July as a peak of the total reproductive season (summer, from May to September), as confirmed by histological analysis of ovarian maturation.