1
Article
Agnostic pathway/gene set analysis of genome-wide association data identifies associations for pancreatic cancer
Naomi Walsh*$1, Han Zhang*2, Paula L. Hyland^2,3, Qi Yang2, Evelina Mocci4,
Mingfeng Zhang5, 6, Erica J. Childs4, Irene Collins5, Zhaoming Wang5,7, Alan A.
Arslan8,9,10, Laura Beane-Freeman2, Paige M. Bracci11, Paul Brennan23, Federico Canzian12, Eric J. Duell13, Steven Gallinger14, Graham G. Giles15,16,17, Michael Goggins43, Gary E. Goodman18, Phyllis J. Goodman19, Rayjean J. Hung14, Charles Kooperberg18, Robert C. Kurtz53, Núria Malats55,56,Loic LeMarchand20, Rachel E.
Neale21, Sara H. Olson22, Ghislaine Scelo23, Xiao O. Shu24, Stephen K. Van Den
Eeden25, Kala Visvanathan26, Emily White18,27, Wei Zheng24, (for the PanScan and PanC4 consortia) Stephen Chanock2, Patricia Hartge2, Robert Hoover2, William
Wheeler70 Peter Kraft35,73, Donghui Li74, Eric J. Jacobs58, Gloria M. Petersen29, Brian
M. Wolpin28, Harvey A. Risch54, Laufey T. Amundadottir5, Kai Yu2, Alison P. Klein4,43,
Rachael Z. Stolzenberg-Solomon$2
For PanScan and PanC4 consortia:
Demetrius Albanes2, Gabriella Andreotti2, Ana Babic28, William R. Bamlet29, Sonja I.
Berndt2, Ayelet Borgida14, Marie Christine Boutron-Ruault30, Lauren Brais28, Bas
Bueno de-Mesquita31,32,33, Julie Buring34,35, Kari G. Chaffee29, Sean Cleary36,
Michelle Cotterchio37,38, Lenka Foretova39, Charles Fuchs40, J. Michael M.
Gaziano41,42, Edward Giovannucci28, Thilo Hackert44, Christopher Haiman45, Manal
Hasan46, Kathy J. Helzlsouer47, Joseph Herman48, Ivana Holcatova49, Elizabeth A.
Holly11, Vladimir Janout50,51, Eric A. Klein52, Daniel Laheru4, I-Min Lee34,35, Lingeng
Lu54, Satu Mannisto57, Roger L. Milne15,16, Ann L. Oberg29, Irene Orlow22, Alpa V.
Patel58, Ulrike Peters18, Miquel Porta59,60, Francisco X. Real56,61,62 Nathaniel
Rothman2, Howard D. Sesso34,35, Gianluca Severi15,16,30, Debra Silverman2, Oliver
Strobel44, Malin Sund63, Mark D. Thornquist18, Geoffrey S. Tobias2, Jean
Wactawski-Wende64, Nick Wareham65, Elisabete Weiderpass66-69, Nicolas
2
1. National Institute for Cellular Biotechnology, Dublin City University, Glasnevin, Dublin, Ireland. 2. Division of Cancer Epidemiology and Genetics, National Cancer Institute, National Institutes of
Health, Bethesda, MD 20892, USA.
3. Division of Applied Regulatory Science, Office of Translational Science, Center for Drug Evaluation & Research, U.S. Food and Drug Administration, Silver Spring, MD 20993, USA.
4. Department of Oncology, Sidney Kimmel Comprehensive Cancer Center, Johns Hopkins School of Medicine, Baltimore, MD, USA.
5. Laboratory of Translational Genomics, Division of Cancer Epidemiology and Genetics, National Cancer Institute, National Institutes of Health, Bethesda, MD, USA
6. Division of Epidemiology II, Office of Surveillance and Epidemiology, Center for Drug Evaluation & Research, U.S. Food and Drug Administration, Silver Spring, MD 20993, USA.
7. Department of Computational Biology, St Jude Children’s Research Hospital, Memphis, Tennessee, USA
8. Department of Obstetrics and Gynecology, New York University School of Medicine, New York, NY 10016, USA
9. Department of Environmental Medicine, New York University School of Medicine, New York, NY 10016, USA
10. Department of Population Health, New York University School of Medicine, New York, NY 10016, USA
11. Department of Epidemiology and Biostatistics, University of California, San Francisco, CA 94158, USA.
12. Genomic Epidemiology Group, German Cancer Research Center (DKFZ), Heidelberg, Germany 13. Unit of Nutrition and Cancer, Cancer Epidemiology Research Program, Bellvitge Biomedical
Research Institute (IDIBELL), Catalan Institute of Oncology (ICO), Barcelona, Spain
14. Lunenfeld-Tanenbaum Research Institute of Mount Sinai Hospital, Toronto, Ontario, Canada. 15. Cancer Epidemiology and Intelligence Division, Cancer Council Victoria, Melbourne, Victoria,
Australia.
16. Centre for Epidemiology and Biostatistics, Melbourne School of Population and Global Health, The University of Melbourne, Victoria, Australia
17. Department of Epidemiology and Preventive Medicine, Monash University, Melbourne, Victoria, Australia
18. Division of Public Health Sciences, Fred Hutchinson Cancer Research Center, Seattle, Washington, USA
19. SWOG Statistical Center, Fred Hutchinson Cancer Research Center, Seattle, Washington, USA 20. Cancer Epidemiology Program, University of Hawaii Cancer Center, Honolulu, HI 96813, Hawaii. 21. Population Health Department, QIMR Berghofer Medical Research Institute, Brisbane, Australia 22. Department of Epidemiology and Biostatistics, Memorial Sloan Kettering Cancer Center, New
York, NY, 10065, USA.
3
24. Division of Epidemiology, Department of Medicine, Vanderbilt Epidemiology Center, Vanderbilt-Ingram Cancer Center, Vanderbilt University School of Medicine, Nashville, TN, 37232, USA. 25. Division of Research, Kaiser Permanente Northern California, Oakland, CA 94612, USA
26. Department of Epidemiology, Johns Hopkins Bloomberg School of Public Health, Baltimore, MD 21205, USA
27. Department of Epidemiology, University of Washington, Seattle, Washington, USA
28. Department of Medical Oncology, Dana-Farber Cancer Institute, Boston, MA, 02215, USA. 29. Department of Health Sciences Research, Mayo Clinic College of Medicine, Rochester,
Minnesota, USA.
30. Centre de Recherche en Épidémiologie et Santé des Populations (CESP, Inserm U1018), Facultés de Medicine, Université Paris-Saclay, UPS, UVSQ, Gustave Roussy, Villejuif, France.
31. Department for Determinants of Chronic Diseases (DCD), National Institute for Public Health and the Environment (RIVM), 3720 BA, Bilthoven, The Netherlands
32. Department of Epidemiology and Biostatistics, School of Public Health, Imperial College London, London, United Kingdom
33. Department of Social & Preventive Medicine, Faculty of Medicine, University of Malaya, Kuala Lumpur, Malaysia
34. Division of Preventive Medicine, Brigham and Women's Hospital, Boston, MA
35. Department of Epidemiology, Harvard T.H. Chan School of Public Health, Boston, MA 36. Division of Hepatobiliary and Pancreas Surgery, Mayo Clinic, Rochester, MN
37. Cancer Care Ontario, University of Toronto, Toronto, Ontario, Canada.
38. Dalla Lana School of Public Health, University of Toronto, Toronto, Ontario, Canada.
39. Department of Cancer Epidemiology and Genetics, Masaryk Memorial Cancer Institute, Brno, Czech Republic
40. Yale Cancer Center, New Haven, CT 06510, USA
41. Division of Aging, Brigham and Women's Hospital, Boston, MA 02115, USA 42. Boston VA Healthcare System, Boston, MA 02132, USA
43. Department of Pathology, Sol Goldman Pancreatic Cancer Research Center, Johns Hopkins School of Medicine, Baltimore, Maryland, USA.
44. Department of General Surgery, University Hospital Heidelberg, Heidelberg, Germany.
45. Department of Preventive Medicine, Keck School of Medicine, University of Southern California, Los Angeles, California.
46. Department of Epidemiology, University of Texas MD Anderson Cancer Center, Houston, Texas, USA.
47. Division of Cancer Control and Population Sciences, National Cancer Institute, National Institutes of Health, Bethesda, MD 20892
48. Department of Radiation Oncology, Sidney Kimmel Comprehensive Cancer Center, Johns Hopkins School of Medicine, Baltimore, Maryland, USA
49. Institute of Public Health and Preventive Medicine, Charles University, 2nd Faculty of Medicine, Prague, Czech Republic
4
50. Department of Epidemiology and Public Health, Faculty of Medicine, University of Ostrava, Czech Republic
51. Faculty of Medicine, University of Olomouc, Olomouc, Czech Republic
52. Glickman Urological and Kidney Institute, Cleveland Clinic, Cleveland, Ohio, USA.
53. Department of Medicine, Memorial Sloan Kettering Cancer Center, New York, New York, USA. 54. Department of Chronic Disease Epidemiology, Yale School of Public Health, New Haven,
Connecticut, USA.
55. Genetic and Molecular Epidemiology Group, Spanish National Cancer Research Center (CNIO), Madrid, Spain
56. CIBERONC, 28029, Madrid, Spain
57. Department of Public Health Solutions, National Institute for Health and Welfare, 00271, Helsinki, Finland
58. Epidemiology Research Program, American Cancer Society, Atlanta, Georgia, USA 59. CIBER Epidemiología y Salud Pública (CIBERESP), Barcelona, Spain
60. Hospital del Mar Institute of Medical Research (IMIM), Universitat Autònoma de Barcelona, Spain 61. Epithelial Carcinogenesis Group, Spanish National Cancer Research Centre-CNIO, Madrid, Spain 62. Departament de Ciències Experimentals i de la Salut, Universitat Pompeu Fabra, Barcelona,
Spain
63. Department of Surgical and Perioperative Sciences, Umeå University, Sweden
64. Department of Epidemiology and Environmental Health, University at Buffalo, Buffalo, New York, USA
65. MRC Epidemiology Unit, University of Cambridge, UK
66. Department of Research, Cancer Registry of Norway, Institute of Population-Based Cancer Research, Oslo, Norway
67. Department of Medical Epidemiology and Biostatistics, Karolinska Institutet, Stockholm, Sweden 68. Genetic Epidemiology Group, Folkhälsan Research Center and Faculty of Medicine, University of
Helsinki, Helsinki, Finland
69. Department of Community Medicine, Faculty of Health Sciences, University of Tromsø, The Arctic University of Norway, Tromsø, Norway
70. Information Management Systems, Silver Spring, MD, USA
71. Cancer Epidemiology Program, University of Hawaii Cancer Center, Honolulu, Hawaii, USA 72. Perlmutter Cancer Center, New York University School of Medicine, New York, NY 10016, USA 73. Department of Biostatistics, Harvard School of Public Health, Boston, MA 02115, USA
74. Department of Gastrointestinal Medical Oncology, University of Texas MD Anderson Cancer Center, Houston, TX, 77030, USA.
*equally contributing first authors ^ Second author
5 Naomi Walsh, Ph.D., M.P.H
Senior research fellow
National Institute for Cellular Biotechnology Dublin City University
Glasnevin Dublin 9 Ireland E-mail: [email protected] Rachael Stolzenberg-Solomon, Ph.D., M.P.H., R.D. Senior Investigator
Division of Cancer Epidemiology and Genetics National Cancer Institute, NIH, DHHS
9609 Medical Center Drive NCI Shady Grove, Room 6E420 Rockville, Maryland 20850 E-mail: [email protected]
6
Abstract Background
Genome-wide association studies (GWAS) identify associations of individual SNPs with cancer risk but usually only explain a fraction of the inherited variability.
Pathway analysis of genetic variants is a powerful tool to identify networks of susceptibility genes.
Methods
We conducted a large agnostic pathway-based meta-analysis of GWAS data using the summary-based adaptive rank truncated product (sARTP) method to identify gene sets and pathways associated with pancreatic ductal adenocarcinoma (PDAC) in 9,040 cases and 12,496 controls. We performed expression quantitative trait loci (eQTL) analysis and functional annotation of the top SNPs in genes contributing to the top associated pathways and gene sets. All statistical tests were two-sided.
Results
We identified 14 pathways and gene sets associated with PDAC at FDR < 0.05. After Bonferroni correction (P-value ≤ 1.3x10⁻⁵), the strongest associations were
detected in five pathways and gene sets, including maturity onset diabetes of the young (MODY), regulation of beta cell development, role of epidermal growth factor (EGF) receptor transactivation by G-protein-coupled receptors in cardiac hypertrophy pathways, and the Nikolsky breast cancer chr17q11-q21 amplicon and Pujana ATM Pearson correlation coefficient (PCC) network gene sets. We identified and validated rs876493 and three correlating SNPs (PGAP3) and rs3124737 (CASP7) from the Pujana ATM PCC gene set as eQTLs in two normal derived pancreas tissue datasets.
7
Conclusion
Our agnostic pathway and gene set analysis integrated with functional annotation and eQTL analysis provides insight into genes and pathways that may be biologically relevant for risk of PDAC, including those not previously identified.
8
Introduction
Although pancreatic ductal adenocarcinoma (PDAC) only accounts for approximately 3% of all cancer, it’s the third leading cause of cancer-related death in the USA, and its incidence is increasing.1 PDAC is among the most fatal cancers worldwidefor
which there are few established preventable risk factors beyond cigarette smoking, diabetes, being overweight and obesity.2 There are no effective screening methods
for the detection of PDAC; therefore, most people are diagnosed with advanced disease, which contributes to the dismal five-year survival of 8.2%.1 Understanding
the biology underlying the development of PDAC could be useful in developing new treatments or to identify those at high risk for surveillance or targeted for an
intervention.
Over the past decade, genome-wide associations studies (GWAS) have identified 20 genomic loci associated with PDAC susceptibility in European populations.3–8 Although GWAS have provided valuable insights into the genetic
basis of PDAC, the susceptibility loci identified do not fully account for the genetic heritability of this disease because of the relative small effect sizes associated with individual Single Nucleotide Polymorphisms (SNPs) and the multiple testing
correction required for GWAS. Thus, it is likely that many important susceptibility genes may remain unidentified. Pathway-based analyses applied to GWAS have the potential to detect associations that may be overlooked by standard single-marker approaches and can be a complementary method to identify groups of genes or biological pathways enriched with disease-associated SNPs.9,10 Pathway analysis,
which jointly considers multiple variants in interacting genes and multiple genes in a pathway, may also allow more meaningful biologic interpretation.
9
We previously conducted a pathway analysis of genes in 23 candidate biological pathways hypothesized a priori to be associated with PDAC.10
PDAC-associated pathways identified included pancreatic development, Helicobacter pylori lactor/neolacto, hedgehog, Th1/Th2 immune response and apoptosis. This study was limited by the number of participants and pathways/genes examined, suggesting a larger study with a more comprehensive approach may detect associations not previously considered in PDAC. Consequently, in the present study, we included 3,795 human canonical pathways and gene sets from the Broad Institute Molecular Signatures Database (MSigDB) using an agnostic data driven approach to identify genes and pathways associated with PDAC susceptibility within the Pancreatic Cancer Cohort Consortium (PanScan I, II, III) and the Pancreatic Cancer Case Control Consortium (PanC4) GWAS.
Methods
Study population and data
Methods for GWAS studies have previously been described.3–6,8 The study sample included 9,040 primary pancreatic adenocarcinoma cases (ICD-O-3 code C250-C259) and 12,496 control participants of European genetic ancestry from summary data from previous PanScan and PanC4 GWAS.3–8 All participants gave informed consent and all studies were approved by the Institutional Review Board of each participating institution and the National Cancer Institute.
10
A total of 3,795 human derived gene sets and canonical pathways from The Broad Institute MSigDB v5.0 database
(http://software.broadinstitute.org/gsea/msigdb/collections.jsp) were used for the analysis. Canonical pathways (n=1,369) included BioCarta; Hallmark; Kyoto Encyclopedia of Genes and Genomes (KEGG); Pathway Interaction Database (National Cancer Institute and Nature Publishing Group); Reactome; Signaling Gateway (SIG); Signaling Transduction KE and Sigma Aldrich. Gene sets (n=2,426) included studies with expression signatures (or changes in expression levels)
following genetic and chemical perturbations. Gene sets represented genes induced (upregulated) and repressed (downregulated) by the perturbation. The size of gene sets and pathways ranged from 2-1668 genes. SNPs were mapped within a
genomic region encompassing 20 kb upstream and downstream of each gene. We conducted a meta-analysis using summary statistics from the four GWAS using an inverse variance fixed effects model (λ=1.07). An initial analysis on all SNPs resulted in 112 pathways or genes sets associated with PDAC below the Bonferroni statistical significance threshold (P-value=1.3x10⁻⁵, 0.05/3,795) (data not
shown). Most were driven by one or more previously identified GWAS variant, not a pathway association. Therefore, to identify pathway or gene set associations that were jointly driven by novel SNPs, we excluded previously published GWAS PDAC cancer risk signals at 1q32.1 (NR5A2), 2p13.3 (ETAA1), 3q29 (TP63), 5p15.33 (CLPTM1L-TERT), 7p13 (SUGCT), chr8q24.21 (MYC), 7q32.2 (LINC-PINT), 9q34.2 (ABO), 13q12.2 (PDX1), 13q22.1 (KLF5/KLF12), 16q23.1 (BCAR1), 17q25.1
(LINC00673) and 22q12.1 (ZNRF3)3–7 and SNPs with meta-analysis at GWAS threshold P-value < 5x10⁻⁸ (signal at 7p12 (TNS3)) from our analysis plus
11
could be caused by linkage disequilibrium (LD)11. In total, 207 genes were excluded
using these criteria. We excluded SNPs with minor allele frequency (MAF) < 1% and applied LD filtering to highly correlated SNP pairs (r2 > 0.81).
We conducted gene- and pathway meta-analyses using the summary based adaptive rank truncated product (sARTP) method, which combines SNP-level associations across SNPs in a gene or a pathway.11 The signals from up to two of
the most associated SNPs in a gene were accumulated. The sARTP method adjusted for the size of genes and pathways (i.e., number of SNPs in a gene and number of genes in a pathway) through a resampling procedure to control for false positives. The P-values of gene- and pathway-level associations were estimated from the resampled null distribution generated from one hundred million resampling steps. A panel of 503 European subjects (population codes: CEU, TSI, FIN, GBR, IBS) in the 1000 Genomes Project (phase 3, v5, 2013/05/024) was used in sARTP to estimate the LDs between SNPs. To eliminate the impact of population stratification, the genomic control inflation factor was adjusted by using √1.07 to rescale the standard error of the estimated log odds ratio at each SNP. We considered a false discovery rate (FDR) adjusted pathway-level P-value ≤ 0.05 statistically significant, however discuss pathways and gene sets below the Bonferroni adjusted α-level of P-value=1.3x10⁻⁵ (0.05/3,795). All statistical tests are two-sided.
Functional annotation and eQTL analysis
Experimental data from ENCODE12 custom tracks on the UCSC Genome Browser
and Roadmap,13 and information from Ensembl,14 RegulomeDB v1.1,15 LDlink16 and
HaploReg v4.117 were used to evaluate the regulatory relevance of SNP (and SNPs
12
performed to evaluate effects on expression and tissue specificity for the most statistically significant SNPs using publicly available data from the NIH Genotype-Tissue Expression (GTEx) v718 in pancreas tissue samples (n = 220). Potential eQTLs from this analysis (P < 0.05) were then taken forward for further analysis.
Expression QTL analysis of selected SNPs (n = 53 SNPs mapped to 69 genes) (identified by one or more features including SNP P-value, RegulomeDB score, and GTEx eQTL result) were validated using data from histologically normal pancreas tissue samples (n= 95) from the Laboratory of Translational Genetics (LTG) as previously described.19 P-values for SNP-gene tests were adjusted for multiple
comparisons using Bonferroni correction (P-value=0.05/69 = 7.25x10⁻⁴).
Results
Pathway and gene set-based analyses
Fourteen pathways and gene sets were associated with PDAC at FDR < 0.05, of which two gene sets and three pathways remaining statistically significant after the Bonferroni correction (Table 1); including Maturity Onset Diabetes of the Young (MODY) (P-value=5.10x10⁻⁷), regulation of beta cell development (P-value=1.92x10 -6), Nikolsky breast cancer 17q11-q21 amplicon (P-value=2.00x10⁻⁶), role of EGF
receptor transactivation by GPCRs in cardiac hypertrophy (P-value=3.79x10⁻⁶) and
Pujana ATM PCC network (P-value=1.25x10⁻⁵).
The MODY pathway which contained 1,448 SNPs across 23 genes was the most statistically significant pathway. The genes with the strongest association in this pathway and the corresponding top SNP(s) were HNF1A (rs1169296, rs2244608),
13
HNF1B (rs12951345, rs7223387), HNF4A (rs1853150), HNF4G (rs1913641, rs2943547) and PAX4 (rs118117270, rs62483175) (Figure 1, Supplementary
Table 1). Four of 28 genes (2,057 SNPs) contributed to the regulation of beta cell
development pathway, HNF1A, HNF1B, HNF4A and HNF4G, had the same corresponding SNPs selected by sARTP as in the MODY pathway (Figure 1,
Supplementary Table 1). This suggests an overlap in signals between these two
pathways, however the PAX4 gene was only present in MODY pathway.
The role of EGF receptor transactivation by GPCRs in cardiac hypertrophy pathway included 2,133 SNPs across 17 genes. EDNRA (rs35232409, rs6537481) and AGT (rs1326889) were the top genes with P-values = 5.47x10⁻⁶ and 9.21x10⁻⁵,
respectively (Figure 2, Supplementary Table 2).
The Nikolsky breast cancer 17q11-q21 amplicon gene set included 131 genes (3,320 SNPs) and the association was driven by 36 genes (Figure 3,
Supplementary Table 3). The top five genes were PGAP3, PNMT, TCAP, ERBB2,
and STARD3 (gene P-values < 3.00x10⁻⁵), all corresponding to two SNPs rs876493
(P-value=1.27x10⁻⁶) and rs3764351 (P-value=1.27x10⁻⁵). Additional genes
contributing to this pathway included HNF1B (rs12951345, rs7223387), IGFBP4 (rs7225411, rs76592685), TNS4 (rs7225411, rs113557550), MED24/THRA
(rs8078692, rs113520394), and FBXL20 (rs62074998, rs12453796) (gene P-values < 0.001). The SNPs selected by the sARTP method in the top 36 genes (gene P-value <0.04) were not all in high LD with each other (r2 range 0.002 to 0.6),
suggesting multiple signals in this region may be associated with PDAC.
In the Pujana ATM PCC network, 67 of 1,350 genes were selected by sARTP as contributing the most to the PDAC association (Figure 4, Supplementary Table
14
(rs876493, rs3764351), and HNF1B (rs12951345, rs7223387). Other notable genes (gene P-value < 0.01) in this gene set included HNF1A (rs1169291, rs1169297), GRP (rs57791062), ACTR2 (rs2160263, rs7579797), THRA (rs8078692,
rs113520394), HNF4G (rs1913641, rs2943547), HEXA (rs11636684, rs201611588), TAB1 (rs34825318), MED1 (rs113897737, rs7212868) and CASP7 (rs3124737). The full list of genes and sARTP selected SNPs which contributed to the Bonferroni statistically significant pathways/ and the overlap across pathways/gene sets are summarized in Supplementary Table 5.
Some of our findings were supported by recent consortia effort in conducting GWAS meta-analysis on PDAC risk.8By combing the four GWAS used in our study with an additional replication data of selected SNPs (2,737 cases; 4,752 controls), four new GWAS signals were identified.8As our analysis was conducted prior to this, we further excluded these GWAS signal regions at 1p36.33 (NOC2L), 8q21.11 (HNF4G), 17q12 (HNF1B), and 18q21.32 (GRP).8 Eight of the 14 FDR statistically
significant pathways or gene sets included these regions and were attenuated after their exclusion (Supplementary Table 6, P-values < 0.01); however, the Nikolsky breast cancer chr17q11-q21 amplicon gene set remained statistically significant (P-value = 5.71x10⁻⁶) after Bonferroni correction. The ATM PCC network, MODY and
regulation of beta cell development had P-values of 3.59x10⁻⁴, 5.49x10⁻⁴, and 0.001,
respectively. The other six pathways/gene sets did not include these regions and were unaffected.
Expression QTL and functional annotation
We present the functional annotations and eQTL results from GTEx tissues and replication in an independent eQTL histologically normal pancreas dataset (LTG)19
15
for the five Bonferroni statistically significant pathways and gene sets (Table 2 and
Supplementary Tables 7 and 8). Top SNP rs876493-A was present in both the
Nikolsky breast cancer chr17q11-q21 amplicon and Pujana ATM network gene sets, and was associated with lower PGAP3 expression in normal pancreatic tissue in GTEx (P-value =3.9x10⁻⁷, β=-0.24) and in the LTG (P-value =1.16x10⁻⁵, β=-0.43). In
addition, we identified and validated three additional SNPs, rs3764351-A,
rs4795393-T and rs12453507-G in LD with rs876493-A that also act as eQTLs for PGAP3 in both data sets (Table 2). These SNPs were also associated with lower PGAP3 expression in other tissues (Supplementary Table 7). The linkage
disequilibrium (LD) between these four SNPs on chr17 may indicate the same signal is contributing to the associations.
In the Pujana ATM PCC network, we observed that the risk allele rs3124737-G (CASP7) was associated with higher expression of the CASP7 gene in normal pancreatic tissue using GTEx (P-value =2.5x10⁻⁸; β=0.48) and LTG (P-value =0.02;
β=0.28) (Table 2). We also observed this eQTL effect in multiple tissues from GTEx including thyroid, subcutaneous adipose, and whole blood (Supplementary Table
7). The two SNPs (rs876493-A (PGAP3) and rs3124737-G (CASP7) supported by
eQTL were not identified or in LD with signals from the recent GWAS meta-analysis and remained statistically significant after exclusion of the new GWAS regions.8
Discussion
We identified fourteen pathways and gene sets associated with PDAC, five of which met the Bonferroni correction for multiple testing. The strongest pathways associated with PDAC included genes involved in susceptibility to MODY, pancreatic beta cell
16
development, cardiac hypertrophy, breast cancer chr17q11-q21 amplicon, and a network of genes correlated with ATM gene expression.
Our PDAC associations for the MODY and pancreatic beta cell development pathways add evidence and reinforce previous epidemiologic findings based on candidate genes, pleiotropy, and GWAS approaches5,7,8,10,20–22. The genes in these pathways are important components for transcriptional networks governing
embryonic pancreatic development, differentiation and pancreatic homeostasis23,24.
MODY accounts for 2% of all diabetes and is caused by genetic mutations that affect islet beta-cell function.25 We found no evidence that the variants linked to the genes
in these pathways act as eQTLs in normal adult pancreas tissues. However, functional annotation showed that rs2244608-G (HNF1A) maps to an active
transcription start site (TSS) in normal pancreas and islet cell tissue. PAX4 identified in the MODY pathway has not previously been implicated in PDAC. PAX4 is
essential for islet development and adult β-cells survival and expansion.24
Mutations and germline polymorphisms in PAX4 are associated with Type 1 and Type 2 diabetes and MODY type 9.25
The EDNRA (endothelin receptor type A) and AGT (angiotensinogen) genes were the top genes in the EGF cardiac pathway, a pathway which has not previously been implicated in PDAC susceptibility. This pathway describes cardiac hypertrophy (thickening of the heart muscle) through activation of the EGFR (epidermal growth factor receptor) by GPCRs (G protein-coupled receptors). GPCRs transactivate EGFR in numerous cell types and cancers, resulting in downstream activation of biological processes.26,27 EDNRA is a GPCR for endothelin (ET-1), a potent
vasoconstrictor that may play a role in obesity and insulin resistance.28
17
EDNRA demonstrated anti-angiogenic and anti-proliferative activity in pancreatic cancer cell lines.33 AGT encodes an angiotensin precursors, a potent vasoconstrictor
involved in blood pressure regulation and a potential cell growth stimulator.34,35
Variant rs1326889 in AGT (SNP P-value=4.21x10⁻⁷) is associated with renal cell
carcinoma, with stronger associations observed for overweight/obese or hypertensive participants.34
The Nikolsky breast cancer chr17q11-q21 amplicon gene set represents genes that exhibit copy number alterations in 191 breast carcinomas.36 The
strongest associated SNP rs876493 (P-value= 1.27x10⁻⁶) and three additional
correlated SNPs (r2 range 0.3-0.6) rs3764351, rs4795393 and rs12453507 were
associated with decreased PGAP3 (post GPI attachment to proteins 3) expression in both the GTEx and LTG pancreas tissue datasets and all four variants may
represent the same signal (Table 2). PGAP3, also known as PERLD1, is an oncogene in breast and gastric cancer, and is frequently co-amplified with ERBB2 and CDK12.37 Co-silencing of STARD3, GRB7, PSMD3, PGAP3 together with ERBB2 led to an additive inhibition of cell viability and apoptosis in vitro.38 The
SNPs rs876493 and rs3764351 were also present in the Pujana ATM PCC network gene set. Our observed PDAC association for this breast cancer derived gene set may suggest common genetic susceptibility for both cancers.
The Pujana ATM PCC network gene set is based on gene expression
integrated with functional genomic and proteomic data from human tissues and cell lines to classify networks associated with ATM.39 Numerous genes across multiple
chromosomes contributed to the statistical significance of this gene set with PDAC, including but not limited to the MODY genes HNF1A, HNF1B, HNF4G, and PAX4. The ATM protein is a serine/threonine kinase involved in repair of DNA
double-18
strand breaks.40 Mutations in ATM are responsible for ataxia-telangiectasia.40
Germline mutations in ATM are known to be associated with 2-3% of familial PDAC41–43 and have recently been found in a case series of sporadic PDAC patients.44 Our analysis identified rs7859034 (SMC2) (SNP P-value=3.07x10⁻⁷) as
top signal in this gene set. SMC2 is a central component of the condensin complex required for converting interphase chromatin into mitotic-like condense
chromosomes. SMC2 in cooperation with MYCN can transcriptionally regulate DNA damage response genes.45 In this gene set, we additionally identified eQTL and
functional annotation evidence for variants in the CASP7 gene (rs3124737, SNP P-value=3.329x10⁻⁵) in pancreas tissue. CASP7 is critical in apoptosis induction, acts
as a candidate for susceptibility to insulin-dependent diabetes; inactivating mutations in CASP7 have been reported to contribute to the pathogenesis of some human solid cancers.46 This gene set represents a biologic network not previously considered for
sporadic PDAC that should be further researched and could have clinical application for classifying those at high risk.
Four of the 5 Bonferroni statistically significant pathways or gene sets that we observed contained recently published GWAS signal regions.8 When we excluded
these regions, the Nikolsky chr17q11-q21 gene set remained Bonferroni statistically significant and the others had P-values <0.001. Although we do not have a
replication study for our analysis, the fact that the four SNPS in these regions replicated in the meta-analysis GWAS study,8adds to the validity of our pathway findings. Klein et al.8 also identified four suggestive variants, rs6537481 (EDNRA), rs2417487 (SMC2), rs1182933 (HNF1A) and rs6073450 (HNF4A) that did not reach genome-wide statistical significance however, were in LD with signals (or
19
the same SNP (EDNRA)) which contributed to the biologically relevant pathways and gene sets of multiple smaller association signals observed in our study.
Strengths of our study are its large sample size for PDAC and agnostic pathway and gene set-based statistical approach using GWAS data. Combined with a sophisticated statistical method, sARTP maximized our ability for detecting genetic associations that would not be discovered by the single-marker analysis conducted in conventional GWAS. The sARTP method also uses GWAS summary data, which facilitates consortia collaboration in sharing data for large-scale pathway analyses. We excluded reported GWAS SNPs, signals with P-value threshold < 5x10⁻⁸ and
regions within +/- 500 kb to identify genetic contributions to PDAC susceptibility beyond the traditional GWAS threshold. The strongest contributing genes and
selected SNPs observed within the statistically significant pathways and gene sets in our study may be identified in future GWAS with larger sample sizes.
Limitations of our study include the LD filtering threshold of r2 > 0.81 used to exclude
highly correlated SNPs, meaning potential variants in LD (r2 < 0.81), could be
selected for a gene that represents one signal. However, the sARTP method
identifies SNPs and genes contributing the most to the overall pathway associations in a data-driven manner which may help with biologically meaningful result
interpretation and has proven to be a powerful and effective strategy to analyze pathways.11 An additional limitation may be the distance (kb) used to map SNPs to genes. Although, there is no agreed exact distance to assign SNPs to their relevant genes47, it is known that some genetic variants can affect RNA expression through
cis or trans mechanisms.48 In our study, we mapped SNPs 20 kb upstream and
downstream of each gene in order to identify candidate SNPs that may play a regulatory role in gene expression. We and others have previously used this
20
distance in annotating SNPs-genes in pathway analysis,11 as studies have shown
functional variants are located approximately 16-20 kb within transcription start sites.47–49 Ultimately, approaches using causal SNPs based on chromatin interactions, cis or trans-eQTL functional data for assigning SNPs to genes will increase the precision of the associations and understanding of the biology beyond the functional annotations we performed using publicly available data and eQTL analyses in two normal pancreas tissue independent datasets.
In conclusion, translating GWAS data into biologically relevant pathways and gene sets expands our knowledge of the potential mechanisms underlying PDAC carcinogenesis, as well as providing evidence for the future development of
clinically-relevant multi-genic predictors for identifying individuals at high risk. Further population, clinical and laboratory research is needed to confirm our findings.
Strategies to accelerate functional biological follow-up may include replication, fine mapping, experimental studies such as whole transcriptomic sequencing, reporter assays and DNA methylation/epigenetic regulations on gene expression50 to fully
understand the biology and functional nature of the loci contributing to the pathways and gene sets associated with PDAC.
Funding
This work was supported by the Intramural Research Program, Division of Cancer Epidemiology and Genetics, National Cancer Institute, National Institutes of Health. This publication has emanated from research supported in part by a Grant from Science Foundation Ireland under Grant number [15/SIRG/3482](NW) and Health Research Board/Irish Cancer Society (CPFPR-2012-2)(NW). This work was also supported by RO1 CA154823 and federal funds from the National Cancer Institute (NCI), US National Institutes of Health (NIH) under contract number
21
HHSN261200800001E. Please see the Supplementary Materials for a complete list of funding acknowledgements.
Notes
The funders had no role in the design of the study; the collection, analysis, and interpretation of the data; the writing of the manuscript; and the decision to submit the manuscript for publication.
All authors declare no competing interests. The co-author, Dr. Mingfeng Zhang is currently an employee of the US Food and Drug Administration. Dr. Mingfeng Zhang was involved in this study when she was a postdoctoral fellow at National Cancer Institute. The views expressed in this article are those of the authors and not necessarily those of the Food and Drug Administration.
References
1. Jemal A, Ward EM, Johnson CJ, et al. Annual Report to the Nation on the Status of Cancer, 1975–2014, Featuring Survival. JNCI J Natl Cancer Inst. 2017;109(9):1827-1839.
2. Stolzenberg-Solomon RZ, Amundadottir LT. Epidemiology and Inherited Predisposition for Sporadic Pancreatic Adenocarcinoma. Hematol Oncol Clin North Am. 2015;29(4):619-640.
3. Amundadottir L, Kraft P, Stolzenberg-Solomon RZ, et al. Genome-wide association study identifies variants in the ABO locus associated with susceptibility to pancreatic cancer. Nat Genet. 2009;41(9):986-990.
22
4. Petersen GM, Amundadottir L, Fuchs CS, et al. A genome-wide association study identifies pancreatic cancer susceptibility loci on chromosomes 13q22.1, 1q32.1 and 5p15.33. Nat Genet. 2010;42(3):224-228.
5. Wolpin BM, Rizzato C, Kraft P, et al. Genome-wide association study identifies multiple susceptibility loci for pancreatic cancer. Nat Genet. 2014;46(9):994-1000.
6. Childs EJ, Mocci E, Campa D, et al. Common variation at 2p13.3, 3q29, 7p13 and 17q25.1 associated with susceptibility to pancreatic cancer. Nat Genet. June 2015.
7. Zhang M, Wang Z, Obazee O, et al. Three new pancreatic cancer
susceptibility signals identified on chromosomes 1q32.1, 5p15.33 and 8q24.21. Oncotarget. 2016;7(41):66328-66343.
8. Klein AP, Wolpin BM, Risch HA, et al. Genome-wide meta-analysis identifies five new susceptibility loci for pancreatic cancer. Nat Commun. 2018;9(1):556. 9. Wei P, Tang H, Li D. Insights into pancreatic cancer etiology from pathway
analysis of genome-wide association study data. PLoS One. 2012;7(10):e46887.
10. Li D, Duell EJ, Yu K, et al. Pathway analysis of genome-wide association study data highlights pancreatic development genes as susceptibility factors for pancreatic cancer. Carcinogenesis. 2012;33(7):1384-1390.
11. Zhang H, Wheeler W, Hyland PL, et al. A Powerful Procedure for Pathway-Based Meta-analysis Using Summary Statistics Identifies 43 Pathways Associated with Type II Diabetes in European Populations. PLOS Genet. 2016;12(6):e1006122.
23
elements in the human genome. Nature. 2012;489(7414):57-74.
13. Kundaje A, Meuleman W, Ernst J, et al. Integrative analysis of 111 reference human epigenomes. Nature. 2015;518(7539):317-330.
14. Yates A, Akanni W, Amode MR, et al. Ensembl 2016. Nucleic Acids Res. 2016;44(D1):D710-D716.
15. Boyle AP, Hong EL, Hariharan M, et al. Annotation of functional variation in personal genomes using RegulomeDB. Genome Res. 2012;22(9):1790-1797. 16. Machiela MJ, Chanock SJ. LDlink: a web-based application for exploring
population-specific haplotype structure and linking correlated alleles of possible functional variants. Bioinformatics. 2015;31(21):3555-3557. 17. Ward LD, Kellis M. HaploReg v4: systematic mining of putative causal
variants, cell types, regulators and target genes for human complex traits and disease. Nucleic Acids Res. 2016;44(D1):D877-81.
18. Ardlie KG, Deluca DS, Segre A V., et al. The Genotype-Tissue Expression (GTEx) pilot analysis: Multitissue gene regulation in humans. Science (80- ). 2015;348(6235):648-660.
19. Zhang M, Lykke-Andersen S, Zhu B, et al. Characterising cis-regulatory variation in the transcriptome of histologically normal and tumour-derived pancreatic tissues. Gut. June 2017:gutjnl-2016-313146.
20. Pierce BL, Ahsan H. Genome-wide “pleiotropy scan” identifies HNF1A region as a novel pancreatic cancer susceptibility locus. Cancer Res.
2011;71(13):4352-4358.
21. Luo Z, Li Y, Wang H, et al. Hepatocyte nuclear factor 1A (HNF1A) as a possible tumor suppressor in pancreatic cancer. PLoS One.
24
22. Hoskins JW, Jia J, Flandez M, et al. Transcriptome analysis of pancreatic cancer reveals a tumor suppressor function for HNF1A. Carcinogenesis. 2014;35(12):2670-2678.
23. Maestro MA, Cardalda C, Boj SF, Luco RF, Servitja JM, Ferrer J. Distinct Roles of HNF1β, HNF1α, and HNF4α in Regulating Pancreas Development, β-Cell Function and Growth. In: Development of the Pancreas and Neonatal Diabetes. Vol 12. Basel: KARGER; 2007:33-45. do
24. Zhang J, Qin X, Sun Q, et al. Transcriptional control of PAX4-regulated miR-144/451 modulates metastasis by suppressing ADAMs expression. Oncogene. 2015;34(25):3283-3295.
25. Timsit J, Saint-Martin C, Dubois-Laforgue D, Bellanné-Chantelot C. Searching for Maturity-Onset Diabetes of the Young (MODY): When and What for? Can J Diabetes. 2016;40(5):455-461.
26. Ullrich A, Prenzel N, Zwick E, et al. EGF receptor transactivation by G-protein-coupled receptors requires metalloproteinase cleavage of proHB-EGF. Nature. 402(6764):884-888.
27. Fischer OM, Hart S, Gschwind A, Ullrich A. EGFR signal transactivation in cancer cells. Biochem Soc Trans. 2003;31(Pt 6):1203-1208.
28. Weil BR, Westby CM, Van Guilder GP, Greiner JJ, Stauffer BL, Desouza CA. Enhanced endothelin-1 system activity with overweight and obesity. Am J Physiol Hear Circ Physiol. 2011;301:689-695.
29. Laurberg JR, Jensen JB, Schepeler T, Borre M, Ørntoft TF, Dyrskjøt L. High expression of GEM and EDNRA is associated with metastasis and poor outcome in patients with advanced bladder cancer. BMC Cancer.
25
in breast cancer: regulation by estradiol and cobalt-chloride induced hypoxia. Int J Oncol. 2005;26(4):951-960.
31. Nie S, Zhou J, Bai F, Jiang B, Chen J, Zhou J. Role of endothelin A receptor in colon cancer metastasis: in vitro and in vivo evidence. Mol Carcinog. 2014;53 Suppl 1(S1):E85-91.
32. Cook N, Brais R, Qian W, Chan Wah Hak C, Corrie PG. Endothelin-1 and endothelin B receptor expression in pancreatic adenocarcinoma. J Clin Pathol. 2015;68(4):309-313.
33. Bhargava S, Stummeyer T, Hotz B, et al. Selective Inhibition of Endothelin Receptor A as an Anti-angiogenic and Anti-proliferative Strategy for Human Pancreatic Cancer. J Gastrointest Surg. 2005;9(5):703-709.
34. Andreotti G, Boffetta P, Rosenberg PS, et al. Variants in blood pressure genes and the risk of renal cell carcinoma. Carcinogenesis. 2010;31(4):614-620. 35. Wegman-Ostrosky T, Soto-Reyes E, Vidal-Millán S, Sánchez-Corona J. The
renin-angiotensin system meets the hallmarks of cancer. J Renin-Angiotensin-Aldosterone Syst. 2015;16(2):227-233.
36. Nikolsky Y, Sviridov E, Yao J, et al. Genome-wide functional synergy between amplified and mutated genes in human breast cancer. Cancer Res.
2008;68(22):9532-9540.
37. Singh RR, Patel KP, Routbort MJ, et al. Clinical massively parallel
next-generation sequencing analysis of 409 cancer-related genes for mutations and copy number variations in solid tumours. Br J Cancer. 2014;111(10):2014-2023.
38. Sahlberg KK, Hongisto V, Edgren H, et al. The HER2 amplicon includes several genes required for the growth and survival of HER2 positive breast
26
cancer cells. Mol Oncol. 2013;7(3):392-401.
39. Pujana MA, Han J-DJ, Starita LM, et al. Network modeling links breast cancer susceptibility and centrosome dysfunction. Nat Genet. 2007;39(11):1338-1349. 40. Lavin MF. Ataxia-telangiectasia: from a rare disorder to a paradigm for cell
signalling and cancer. Nat Rev Mol Cell Biol. 2008;9(10):759-769. 41. Thompson D, Duedal S, Kirner J, et al. Cancer Risks and Mortality in
Heterozygous ATM Mutation Carriers. JNCI J Natl Cancer Inst. 2005;97(11):813-822.
42. Marabelli M, Cheng S-C, Parmigiani G. Penetrance of ATM Gene Mutations in Breast Cancer: A Meta-Analysis of Different Measures of Risk. Genet
Epidemiol. 2016;40(5):425-431.
43. Roberts NJ, Jiao Y, Yu J, et al. ATM mutations in patients with hereditary pancreatic cancer. Cancer Discov. 2012;2(1):41-46.
44. Shindo K, Yu J, Suenaga M, et al. Deleterious Germline Mutations in Patients With Apparently Sporadic Pancreatic Adenocarcinoma. J Clin Oncol.
2017;35(30):3382-3390.
45. Murakami-Tonami Y, Kishida S, Takeuchi I, et al. Inactivation of SMC2 shows a synergistic lethal response in MYCN -amplified neuroblastoma cells. Cell Cycle. 2014;13(7):1115-1131.
46. Wang M-Y, Zhu M-L, He J, et al. Potentially Functional Polymorphisms in the CASP7 Gene Contribute to Gastric Adenocarcinoma Susceptibility in an Eastern Chinese Population. PLoS One. 2013;8(9):e74041.
47. Wang L, Jia P, Wolfinger RD, Chen X, Zhao Z. Gene set analysis of genome-wide association studies: methodological issues and perspectives. Genomics. 2011;98(1):1-8.
27
48. Fagny M, Paulson JN, Kuijjer ML, et al. Exploring regulation in tissues with eQTL networks. Proc Natl Acad Sci U S A. 2017;114(37):E7841-E7850. 49. Veyrieras J-B, Kudaravalli S, Kim SY, et al. High-Resolution Mapping of
Expression-QTLs Yields Insight into Human Gene Regulation. PLoS Genet. 2008;4(10):e1000214.
50. Freedman ML, Monteiro ANA, Gayther SA, et al. Principles for the post-GWAS functional characterization of cancer risk loci. Nat Genet. 2011;43(6):513-518.
28
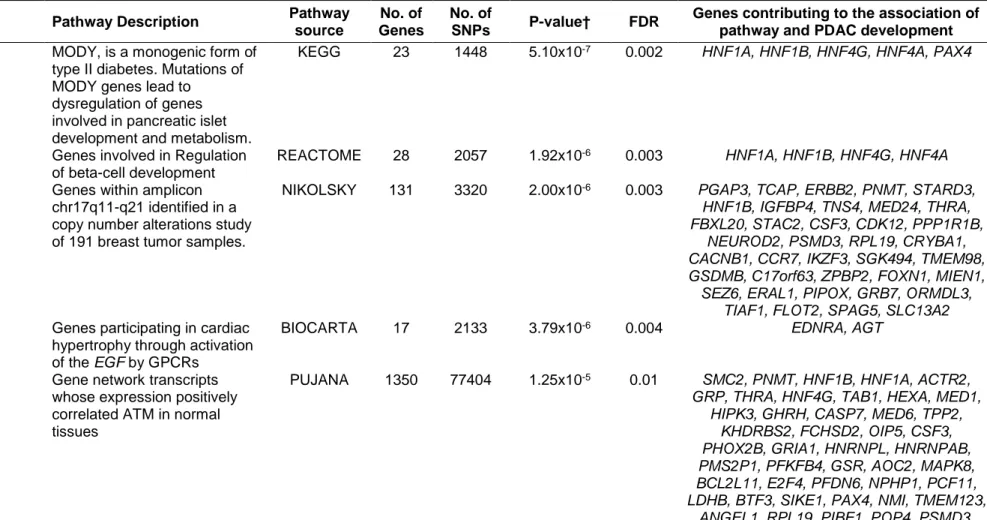
Table 1: Pathways and gene sets associated with risk of pancreatic ductal adenocarcinoma (false discovery rate, FDR < 0.05)*
Gene set Pathway Description Pathway
source
No. of Genes
No. of
SNPs P-value† FDR
Genes contributing to the association of pathway and PDAC development Maturity onset diabetes of the
young‡ MODY, is a monogenic form of type II diabetes. Mutations of MODY genes lead to
dysregulation of genes involved in pancreatic islet development and metabolism.
KEGG 23 1448 5.10x10⁻⁷ 0.002 HNF1A, HNF1B, HNF4G, HNF4A, PAX4
Regulation of Beta cell development‡
Genes involved in Regulation of beta-cell development
REACTOME 28 2057 1.92x10⁻⁶ 0.003 HNF1A, HNF1B, HNF4G, HNF4A Breast Cancer chr17q11-q21
amplicon‡, Genes within amplicon chr17q11-q21 identified in a copy number alterations study of 191 breast tumor samples.
NIKOLSKY 131 3320 2.00x10⁻⁶ 0.003 PGAP3, TCAP, ERBB2, PNMT, STARD3,
HNF1B, IGFBP4, TNS4, MED24, THRA, FBXL20, STAC2, CSF3, CDK12, PPP1R1B,
NEUROD2, PSMD3, RPL19, CRYBA1, CACNB1, CCR7, IKZF3, SGK494, TMEM98, GSDMB, C17orf63, ZPBP2, FOXN1, MIEN1, SEZ6, ERAL1, PIPOX, GRB7, ORMDL3,
TIAF1, FLOT2, SPAG5, SLC13A2
Role of EGF Receptor Transactivation by GPCRs in Cardiac Hypertrophy‡
Genes participating in cardiac hypertrophy through activation of the EGF by GPCRs
BIOCARTA 17 2133 3.79x10⁻⁶ 0.004 EDNRA, AGT ATM PCC NETWORK‡ Gene network transcripts
whose expression positively correlated ATM in normal tissues
PUJANA 1350 77404 1.25x10⁻⁵ 0.01 SMC2, PNMT, HNF1B, HNF1A, ACTR2,
GRP, THRA, HNF4G, TAB1, HEXA, MED1, HIPK3, GHRH, CASP7, MED6, TPP2,
KHDRBS2, FCHSD2, OIP5, CSF3, PHOX2B, GRIA1, HNRNPL, HNRNPAB, PMS2P1, PFKFB4, GSR, AOC2, MAPK8, BCL2L11, E2F4, PFDN6, NPHP1, PCF11, LDHB, BTF3, SIKE1, PAX4, NMI, TMEM123,
ANGEL1, RPL19, PIBF1, POP4, PSMD3, USP19, GPR3, SP2, CD47, RPL30, KIF20B,
29
BRCA1, NSL1, SNRNP27, BAZ1A, TAF5, ITGBL1, NR2C1, ATXN3, TACR3, TELO2,
TRA2B, NAE1, FBL, USP4, CDC123, FAM53B, CR1, PDAP1, CD52, TNFAIP8, F2RL3, ATP5G2, CAMK4, RHOH, PPIP5K2,
CHAF1B, XRCC2, KIAA0922, CDH8, GPR171, RAB30, SGPL1, PPM1A, ARID1A,
PAICS, DRD1, MR1, SPI1, CYP2C18, TTYH2, ROBO1, POLE, ELF1, IFI44
Developmental biology Genes involved in the process of developmental biology including processes of transcriptional regulation and differentiation.
REACTOME 367 37631 1.40x10⁻⁵ 0.01 ERRB2, HNF1A, HNF1B, MED24, HNF4G,
MED1, MED6, HNF4A, SRGAP1, NCOR1, EZR, EVL, ROCK1P1, RHOC, HFE2, SMA3E, FES, FURIN, UNC5A, CACNB1,
NR2F2, MYL8P, PLXND1, TCF4, MET, KIAA1598, MED21, SDCBP, MED13L, CACNA1I, DPYSL4, ROBO1, HSP90AB1
Response to prostaglandin E2 down
Genes down-regulated in CD4+ T lymphocytes after stimulation with prostaglandin E2.
CHEMNITZ 365 36942 1.93x10⁻⁵ 0.01 ARL6IP6, PIK3C3, DEGS2, NUS1, ZFP3,
WDR48, CNKSR3, PRR15L, BBS4, EZR, LMO7, ANXA11, PKHD1, GORASP1, CD200, FAM60A, OSBPL10, TXNIP, RND2,
GALNT11, CHDH, RBMS2, TNFSF13, C19orf46, SENP3, IFT140, CNTN4, MET, FUT3, SLC35E2B, CDKN1A, MITF, PPM1A,
CRAMP1L
Breast Cancer ERBB2 UP Genes up-regulated in the erbb2 subtype of breast cancer samples, characterized by higher expression of ERBB2
SMID 139 9279 3.89x10⁻⁵ 0.020 PNMT, PGAP3, ERBB2, STARD3, MED24,
CDK12, MED1, GRB7, ELL2, PSMD3, CAMP, LBP, DUSP6, GSDMB, FUT3,
SCGB2A2
Breast cancer cluster8 Cluster 8: selected ERBB2 amplicon genes clustered together across breast cancer samples
FARMER 7 159 4.40x10⁻⁵ 0.02 PNMT, PGAP3, ERBB2, CDK12, MED1,
GRB7, GSDMB
Regulation of gene expression in beta cells
Transcriptional network controlling pancreatic development and beta cell function.
30
*Pathway-based meta-analysis used the sARTP method which combines SNP-level association statistics across SNPs in a gene or a pathway. Each statistically significant contributing gene includes up to two SNPs. The sARTP method adjusts for the size of genes (i.e., number of SNPs in a gene) and the size of pathways (i.e., number of genes in a pathway) through a resampling
procedure. sARTP, summary based adaptive rank truncated product; SNP, single nucleotide polymorphism; FDR, false discovery rate; PDAC, pancreatic ductal adenocarcinoma; EGF, epithelial growth factor; GPCR, G protein-coupled receptor; PGR,
Progesterone; HCP, high CpG-density promoters;
† The pathway-level association P-values were estimated from the resampled null distribution through up to one hundred million resampling steps as described in methods section. All statistical tests were two-sided.
‡ Statistical significant pathways/gene sets at Bonferroni adjusted α-level of P-value =1.3x10⁻⁵ (0.05/3795)
Breast cancer basal down Genes down-regulated in basal subtype of breast cancer samples
SMID 668 60051 6.14x10⁻⁵ 0.02 PGAP3, IGFBP4, PNMT, STARD3, ERBB2,
GRP, MED24, CAPN9, CDK12, CXXC4, BBS4, EVL, SLC19A2, KRT8, CANT1, BAI2,
IFT140, CAMP, ITGA7, HPGD, SLC48A1, CSF3R, C9orf116, RAPGEF3, ITGBL1, TMEM143, UBA7, C5orf30, RARA, RHOH, MED13L, RAB27B, SCGB2A2, VAV3, SIX1,
CNR1
PGR positive meningioma down Genes down-regulated in meningioma samples positive for PGR compared to those without the receptor
CLAUS 12 1195 8.32x10⁻⁵ 0.03 EDNRA, HEG1
Prostate Cancer HCP with H3K27ME3
Genes with high histone H3 trimethylation mark at K27 (H3K27me3) in PC3 cells (prostate cancer) by ChIP-chip assay on a 12K CpG array (high-CpG-density promoters, HCP)
KONDO 93 10820 9.39x10⁻⁵ 0.03 HNF1B, NKX2-3, SAMD11, LINC00273,
LIMCH1, KIAA1109, TRIM16, ZNF438, RNASE11
Breast Cancer copy no. up Genes from common regions of gains observed in more than 15% of 148 primary breast cancer tumors
31
Table 2: Expression quantitative trait loci (eQTLs) for pathway SNPs in normal pancreatic tissue from GTEx and an independent replication set
Pathway Gene Chr R 2 with rs876493* SNP eQTL gene GTEx pancreas (n=220) Independent LTG pancreas (n=95)
P-Value† Effect size ‡ P-Value† Effect size‡
ERBB2, PGAP3 17 N/A rs876493 §, || PGAP3 3.9x10⁻⁷ -0.24 1.16x10⁻⁵ -0.43
TCAP, STARD3, PNMT 17 0.636 rs3764351 §,|| PGAP3 5.7x10⁻⁹ -0.30 9.70x10⁻⁵ -0.47
GRB7, MIEN1 17 0.3508 rs4795393§ PGAP3 4.0x10⁻¹⁰ -0.30 3.83x10⁻⁵ -0.45
GSDMB, ZPBP2 17 0.3046 rs12453507§ PGAP3 2.7x10⁻⁷ -0.22 2.80x10⁻⁵ -0.45
CASP7 10 - rs3124737|| CASP7 2.5x10⁻⁸ 0.42 0.02 0.28
*Linkage Disequilibrium r2 values are derived from LDLink EUR population data. Chr, chromosome; SNP, single nucleotide
polymorphism; eQTL, expression quantitative trait loci; LTG, Laboratory of Translational Genomics; FDR, false discovery rate; TSS, transcription start site.
† eQTL in pancreas FDR (≤ 0.05) using +/- 1 Mb cis-window around TSS. Statistical test was two-sided. ‡ eQTL directional effect for risk allele.
§ SNP in the Nikolsky breast cancer chr17 amplicon gene set || SNP in the Pujana ATM PCC network gene set
32
Figure legends
Figure 1: Genes associated with PDAC in the KEGG maturity onset diabetes of the young (small circles, P-value=5.10x10⁻⁷) and Reactome regulation of beta
cell development (large circles, P-value=1.92x10⁻⁶). Red highlighted circles are genes selected by sARTP as contributing to the most to each pathway-PDAC association. HNF1A, HNF1B, HNF4G and HNF4A contributed to both pathways (gene P-value < 0.006) and PAX4 (gene P-value=0.02 contributed to the MODY pathway. All statistical tests were two-sided.
PDAC, pancreatic ductal adenocarcinoma; sARTP, summary based adaptive rank truncated product.
Figure 2: Genes associated with PDAC in the Biocarta Role of EGF receptor transactivation by GPCRs in cardiac hypertrophy (P-value = 3.79x10⁻⁶). EDNRA and AGT genes (highlighted in red, P-value < 9.21x10⁻⁵) were selected by sARTP as
contributing the most to the pathway-PDAC association. All statistical tests were two-sided.
PDAC, pancreatic ductal adenocarcinoma; EGF, epithelial growth factor; GPCRs, G protein-coupled receptors; sARTP, summary based adaptive rank truncated product.
Figure 3: Genes associated with PDAC in the Nikolsky breast cancer chr17q11-q21 amplicon gene set (P-value=2.00x10⁻⁶). 36 genes (red circles, P-value < 0.04) were selected by sARTP as contributing the most to the gene set-PDAC association. All statistical tests were two-sided.
PDAC, pancreatic ductal adenocarcinoma; sARTP, summary based adaptive rank truncated product.
33
Figure 4: Genes associated with PDAC in the Pujana ATM Pearson correlation coefficient (PCC) network gene set (P-value=1.25x10⁻⁶). 67 genes (red circles, P-value < 0.02) were selected by sARTP as contributing the most to the gene set-PDAC association. All statistical tests were two-sided.
PDAC, pancreatic ductal adenocarcinoma; sARTP, summary based adaptive rank truncated product.