D. De Domenico et alii, Frattura ed Integrità Strutturale, 29 (2014) 209-221; DOI: 10.3221/IGF-ESIS.29.18
209
Focussed on: Computational Mechanics and Mechanics of Materials in Italy
Limit analysis on FRP-strengthened RC members
D. De Domenico, A.A. Pisano, P. Fuschi
University Mediterranea of Reggio Calabria, Department PAU
[email protected], [email protected], [email protected]
Dedicated to Professor Castrenze Polizzotto on the occasion of his 90th birthday
ABSTRACT. Reinforced concrete (RC) members strengthened with externally bonded fiber-reinforced-polymer
(FRP) plates are numerically investigated by a plasticity-based limit analysis approach. The key-concept of the present approach is to adopt proper constitutive models for concrete, steel reinforcement bars (re-bars) and FRP strengthening plates according to a multi-yield-criteria formulation. This allows the prediction of concrete crushing, steel bars yielding and FRP rupture that may occur at the ultimate limit state. To simulate such limit-state of the analysed elements, two iterative methods performing linear elastic analyses with adaptive elastic parameters and finite elements (FEs) description are employed. The peak loads and collapse mechanisms predicted for FRP-plated RC beams are validated by comparison with the corresponding experimental findings. KEYWORDS. Finite element modelling; Multi-yield-criteria limit analysis; Reinforced concrete elements;
FRP-strengthening systems.
INTRODUCTION
any existing steel-reinforced concrete structures, including decks and beams in highway bridges as well as beams, slabs and columns in buildings, are being assessed as having insufficient load carrying capacity due to their deterioration, ageing, poor initial design and/or construction, lack of maintenance, corrosion of steel reinforcement or underestimated design loads. In other cases they no longer comply with the current standards and requirements because of changed load conditions or modification of structural system for some reason. It is both economically and environmentally preferable to upgrade these structures rather than replace/rebuild them, even more if rapid, simple and effective strengthening techniques are employed. In this context, flexural and/or shear repair and rehabilitation of RC structures with externally bonded fiber reinforced polymer sheets, strips and fabrics is generally viewed as a valid and viable solution. Moreover, these techniques can be carried out while the structure is still in use as well as they can be targeted at where the structural deficiency is more marked [1, 2]. On the other hand, to estimate the actual efficacy of the strengthening system, without performing expensive laboratory tests, as well as to design the proper repair interventions to reach a given gain in load carrying capacity, analytical tools and predictive numerical models are highly needed.
Experimental investigations confirm that, after the application of such FRP techniques [3], a significant increase in flexural/shear capacity of the RC elements (up to about 125%) is achieved. Experiments also show the enhancement of the confinement effect exerted on concrete by the FRP laminates, resulting in shifting the failure mode of the strengthened elements from brittle concrete crushing to more ductile steel yielding and/or FRP rupture [4]. In fact, the FRP strengthening system mitigates crack development and, as a result, increases the overall ductility of the RC element. The above considerations make indeed a limit analysis plasticity-based numerical approach, among many others presented in
M
D. De Domenico et alii, Frattura ed Integrità Strutturale, 29 (2014) 209-221; DOI: 10.3221/IGF-ESIS.29.18
210
the relevant literature (see e.g. [5–8]), both applicable and effective, especially when primary interest is in determining the limit (peak) load of FRP-strengthened RC elements. It is worth noting that all the phenomena arising just after a state of
incipient collapse, such as delamination [9], debonding [10], damage in a wider sense, are not treatable and this consistently
with the spirit of a limit analysis approach. Accurate treatment of such post-elastic phenomena is prosecutable only with more accurate step-by-step FE nonlinear analyses. Aware of such limitation, the methodology here proposed should then be viewed only as a preliminary design tool to gain a quick insight into the bearing capacity evaluation of the analyzed elements by determination of the peak load value, the prediction (but not the description) of failure mode as well as the detection of critical zones within the addressed FRP-strengthened RC elements.
The numerical methodology here referred, already used by the authors to predict the limit-state solution of RC elements (see e.g. [11, 12]) and of pinned-joint orthotropic composite laminates (see e.g. [14, 15]), is quite versatile and is based on iterative linear FE analyses carried out on the structure endowed with spatially varying moduli and, if necessary, given initial stresses. Such quantities, viewed as pertaining to a fictitious material substituting the real one, are iteratively adjusted in such a way as to build, with reference to the assumed yield criteria, a collapse mechanism and an admissible stress field for the real structure so as to apply the kinematic and the static approaches of limit analysis, respectively. If a nonstandard nature of the constitutive behaviour has to be postulated, the peak load value of the analysed elements can, in fact, be numerically detected by predicting an upper and a lower bound to it.
In the present study a very general multi-yield-criteria formulation of the above-mentioned limit analysis methodology is presented to appropriately describe the behaviour at collapse of structural elements of engineering interest strengthened by FRP techniques. Precisely, to simulate the behaviour at a state of incipient collapse of the three main constituent materials, concrete is described by a Menétrey–Willam-type yield criterion endowed with cap in compression, steel reinforcement bars are handled by the von Mises yield criterion, FRP strengthening laminates are governed by a Tsai–Wu-type criterion and the quoted methodology is applied in concomitance to the three yield criteria.
To demonstrate the actual capabilities of the proposed approach, large-scale prototypes of a few FRP-strengthened RC beams, experimentally tested up to collapse [4, 16], are numerically investigated.
THEORETICAL BACKGROUND AND FUNDAMENTALS
Constitutive models of concrete, steel and FRP
oncrete is assumed as an isotropic, nonstandard material obeying a plasticity model derived from the Menétrey– Willam (M–W) failure criterion [17]. The latter provides a three parameter failure surface having the following expression: 2 ' ' ' ( , , ) 1.5 ( , ) 1 0 6 3 c c c f m r e f f f (1) where '2 '2 2 2 2 ' ' 2 2 2 2 4(1 ) cos (2 1) ( , ) ; 3 1 2(1 ) cos (2 1) 4(1 ) cos 5 4 c t c t f f e e e r e m e f f e e e e e (2)
Eq. (1) is expressed in terms of the three stress invariants , , known as the Haigh–Westergaard (H–W) coordinates (i.e. hydrostatic and deviatoric stress invariants and Lode angle); m is the friction parameter of the material depending, as shown in Eq. (2), on the compressive strength '
c
f , the tensile strength '
t
f as well as the eccentricity parameter e. The eccentricity e, whose value governs the convexity and smoothness of the elliptic function r( , ) e , describes the out-of-roundness of the M–W deviatoric trace and it strongly influences the biaxial compressive strength of concrete. The failure surface (1) is open along the direction of triaxial compression; therefore, to limit the concrete strength in high hydrostatic regime, a cap in compression closing the surface (1) is adopted. The cap is formulated in the H–W coordinates as follows:
( , ) ( , ) ( ) for / ( ) MW b a CAP a a b b a b 2 2 2 2 0 3 (3) where MW( , ) a
is the explicit form of the parabolic meridian of the M–W surface easily obtainable from Eq. (1). The values a and b entering Eq. (3), namely the hydrostatic stress values corresponding to the intersection of the cap
surface with the M–W surface and the hydrostatic axis, respectively, locate the cap position and can be calibrated
C
D. De Domenico et alii, Frattura ed Integrità Strutturale, 29 (2014) 209-221; DOI: 10.3221/IGF-ESIS.29.18
211 according to experimental results [18]. Due to the dilatancy of concrete, a non-associated flow rule is postulated for the adopted M–W-type yield surface.
Steel is modelled as an isotropic, perfectly plastic material obeying the well-established von Mises yield criterion. For a multi-axial loading scenario the von Mises yield condition is expressed as:
( i j) ( i j) y
f f 0 (4)
where ( i j) is the von Mises effective stress and fy is the yield strength. Since in the FE-model the steel reinforcement
are modelled by 1D truss elements, a uniaxial stress condition is considered in the following and Eq. (4) applies in the simpler shape r fy, r being the stress in the re-bar longitudinal direction.
Finally, the FRP strengthening plates are modelled as orthotropic laminates in plane stress conditions obeying a Tsai–Wu-type yield criterion [19]. For a unidirectional lamina in plane stress case the Tsai–Wu polynomial criterion has the following form:
F 2F 2F 2 F F F
11 1 22 2 66 6 2 12 1 2 1 1 2 2 1 (5)
where 1 and 2 denote the principal directions of orthotropy (the fibres are directed along the material axis 1) and 6 12 in the contracted notation. The coefficients Fi and Fi j ( ,i j1, 2,6) entering Eq. (5) are functions of the strength
parameters of the unidirectional lamina:
: ; : ; : ; : ; : ; : t c t c t c t c F F F F F F F F X X Y Y X X Y Y S 1 2 11 22 66 2 12 11 22 1 1 1 1 1 1 1 1 2 (6)
with: Xt, Xc the lamina longitudinal tensile and compressive strengths, respectively; Yt, Yc the lamina transverse tensile
and compressive strengths, respectively; S the shear strength of the lamina. In the expressions (6) the compressive strengths Xc and Yc have to be considered intrinsically negative. Also FRP composite plates are considered as
nonstandard material and, therefore, a non-associated flow rule is postulated for their constitutive behaviour.
Numerical limit analysis methodology
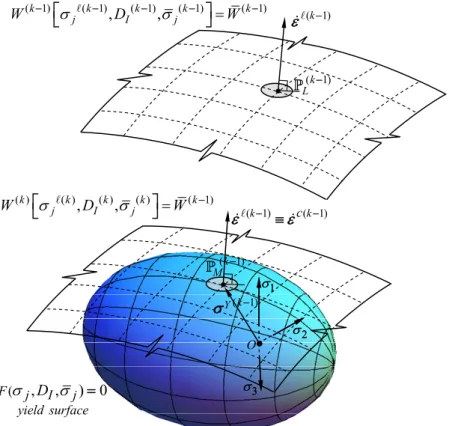
Two distinct limit analysis methods are applied simultaneously. The former, based on the kinematic approach of limit analysis, is able “to build” the collapse mechanism of the analysed structure and to compute an upper bound to the peak load multiplier. The latter, based on the static approach of limit analysis, is instead oriented “to build” a statically and plastically admissible stress field (corresponding to a given load) so giving a lower bound to the peak load multiplier. The reason for computing two bounds arises from the postulated non associativity of concrete and FRP composite material that injects such characteristic on the behaviour of the whole RC-structural element. The two methods, conceived in [20] and [21] with reference to von Mises materials, are known as Linear Matching Method (LMM) and Elastic Compensation Method (ECM), respectively. Both have been rephrased and widely employed by the authors [14], [15]. Their use to bracket the real peak load value of a structure made of a nonstandard material has been also experienced with success [11]–[13]. All the analytical details of LMM and ECM are in the above quoted papers and are here omitted for brevity. The novelty or key-feature of the present study is actually the implementation of LMM and ECM with reference to three different constitutive criteria at the same time. Indeed, the three criteria are those given in the previous section for the three main constituents of the FRP-strengthened RC members here addressed, i.e.: Menétrey–Willam-type for concrete; Tsai–Wu-type for FRP sheets; von Mises for steel bars. For completeness, the two methods are briefly expounded looking only at their geometrical interpretation sketched in Fig. 1 and 2. On taking into account that both methods are performed iteratively, the sketches refer to a current iteration, say (k-1)th.
Looking at the geometrical interpretation of the LMM sketched in Fig. 1, at the current iteration, say at the (k-1)th FE-analysis, a fictitious structure (i.e. the structure under study with its real geometry, boundary and loading conditions but made of fictitious material) is analysed under loads (k 1)
i
P p, with P(k1) load multiplier and
i
p assigned reference loads. The fictitious linear solution computed at each Gauss Point (GP) of the FE mesh, can be represented, at the generic GP, by a point (k 1)
L
lying on the complementary dissipation rate equipotential surface referred to the fictitious viscous material, say ( (k 1), (k 1), (k 1)) (k1)
j I j
W D W , whose geometrical dimensions and centre position depend on the fictitious values (k1)
I
D and (k 1)
j
D. De Domenico et alii, Frattura ed Integrità Strutturale, 29 (2014) 209-221; DOI: 10.3221/IGF-ESIS.29.18
212
ranging over the needed stress components). The point (k 1)
L
with its coordinates, say (k1)
j
in the chosen principal stress space, shown in the sketch of Fig. 1, represents the fictitious solution in terms of stresses while the outward normal at (k 1)
L
, say the normal of components (k 1)
j
, represents the fictitious solutions in terms of linear viscous strain rates. The fictitious moduli and initial stresses are then modified so that (k 1)
L
is brought onto the yield surface of the real constitutive material the analysed structure is made with. The latter surface is here presented by the ellipsoidal shaded surface of Fig. 1. Namely (k 1)
L
is brought to identify with point (k 1)
M
, having the same outward normal as (k 1)
L
but
lying on the real material yield surface. The described modification of (k 1)
I
D and (k1)
j
implies that the “modified”
( 1) ( 1) ( 1) ( 1)
( k , k , k ) k
j I j
W D W matches the yield surface at point (k 1)
M
, this step is the so called “matching procedure”, see again Fig. 1. The fictitious solution in terms of strain rates, namely (k 1) c k( 1)
j j
where the apex c stands for “at collapse”, as well as the stress coordinates of (k 1)
M
, say the stresses at yield Y k( 1)
j
, give all the information pertaining to a
state of incipient collapse built at the current GP. In particular, the fictitious strain rates (k 1) c k( 1)
j j
, with the associated displacement rates (k1) c k( 1)
j j
u u , define a collapse mechanism. The related stresses Y k( 1)
j
are the pertinent stresses at yield.
(j, I,j) 0 yield s e F urfac D ( ) ( ), ( ), ( ) ( 1) k k k k k j I j W D W ( 1)k c( 1)k (k 1) M ( 1) ( 1), ( 1), ( 1) ( 1) k k k k k j I j W D W (k 1) L ( 1)k 3 2 1 3 2 O 1 (k 1) Y
Figure 1: Geometrical sketch, in the principal stress space, of the matching procedure, from iteration (k-1) to (k) at the current GP within the current element
If the expounded rationale is repeated at all GPs of the mesh, a collapse mechanism, ( c k( 1), c k( 1))
j ui
, with the related stresses at yield, Y k( 1)
j
, can be defined for the whole structure and an upper bound value to the collapse load multiplier, say (k1)
UB
P , can be evaluated at current (k-1)th FE elastic analysis. However, the above stress at yield, computed through the matching, do not meet the equilibrium conditions with the acting loads (k1)
i
P p and the procedure, as said, is carried on iteratively until the difference between two subsequent PUB values is less than a fixed tolerance.
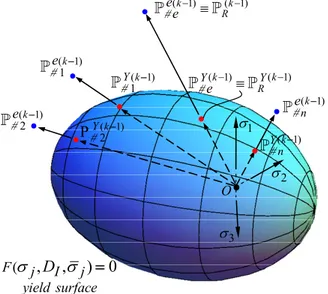
Also the ECM can easily be explained by means of a geometrical sketch as the one given in Fig. 2 with reference to a generic yield surface F(j,DI,j) 0 . The ECM starts with a first sequence, say s1, of FE analyses, carried on the
D. De Domenico et alii, Frattura ed Integrità Strutturale, 29 (2014) 209-221; DOI: 10.3221/IGF-ESIS.29.18
213 structure endowed with the proper (real) material elastic parameters and suffering applied initial loads ( ) ( )1
D i D i
s
P p P p , and by the initial real values of the elastic parameters. At the current iteration, say at the (k-1)th FE analysis, the elastic stress solution is computed at the GPs of the mesh. Such values, averaged within the current element #e, allow to define a solution “at element level”, which, as shown in the sketch of Fig. 2, locates in the principal stress space a stress point, say
(k 1) e e . Y(k 1) e
denotes the corresponding stress point at yield (i.e. lying on the yield surface) measured on the direction
/ | |
e e
e e
O O
. In the figure are reported other stress points, representing the average stress elastic solution within elements #1, #2, , # , , # e n. If the elastic solution at the #eth element is such that | e |(k 1) | Y |(k 1)
e e
O O
then the
element’s Young modulus is reduced according to the formula: ( ) ( ) ( ) ( ) | | | | Y k k k k e e e e e O E E O 2 1 1 1 (7)
where the square of the updating ratio, within the square brackets, is used to increase the convergence rate. (j, I,j) 0 yield s e F urfac D 3 O ( 1) 2k e ( 1) 2k Y P ( 1) 1k e ( 1) 1k Y 2 1 (k 1) (k 1) R e e (k 1) (k 1) R Y Y e (k 1) Y n (k 1) n e
Figure 2: Geometrical sketch, in the principal stress space, of the ECM at current iteration (k-1) of the current sequence s. Stress points representing the elastic solution at elements #1, #2, , # , , # e n; with (k1)
R
“maximum stress” among all the elements After the above moduli variation, the maximum stress value has to be detected in the whole FE mesh, namely the value corresponding to the stress point farthest away from the yield surface, say (k 1)
R
in the sketch of Fig. 2. If | |(k 1)
R O is greater than | Y k|( 1) R
O (as drawn in Fig. 2) a new FE analysis is performed within the current sequence trying to re-distribute the stresses within the structure; and this by keeping fixed the applied loads but with the updated ( )k
e
E values given by Eq. (7). The iterations are carried on, inside the given sequence, until all the stress points just reach or are below their corresponding yield values, which means that an admissible stress field has been built for the given loads. Increased values of loads are then considered in subsequent sequences of analyses, each one with an increased value of ( )
Ds
P , till further load increase does not allow the stress point (k 1)
R
to be brought below yield by the re-distribution procedure. A PLB load
multiplier can then be evaluated at last admissible stress field attained for a maximum acting load ( )
Ds i
P p, say at s S , and at last FE analysis, say at kK, as
( ( ) ( ) ) | | | | D LB Y K R K R S P O P O (8)
D. De Domenico et alii, Frattura ed Integrità Strutturale, 29 (2014) 209-221; DOI: 10.3221/IGF-ESIS.29.18
214
NUMERICAL SIMULATIONS OF EXPERIMENTAL TESTS
Analysed full-scale tests
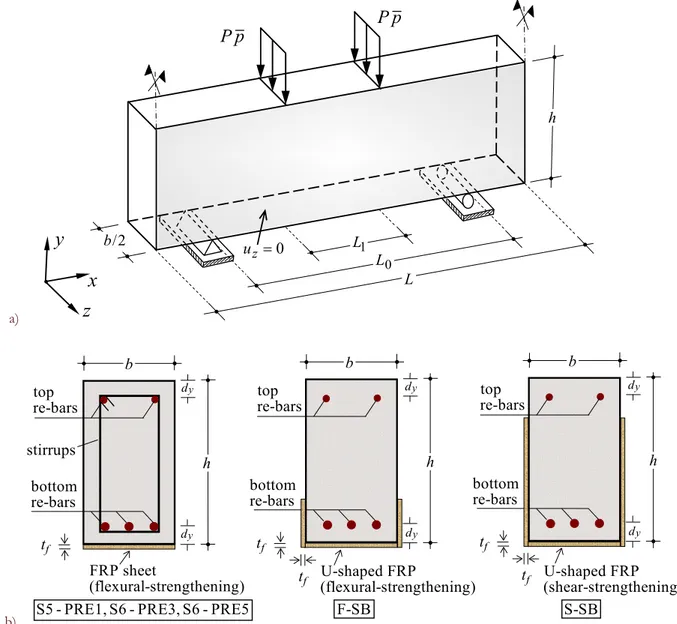
he numerical study has comprised 6 RC beams, flexural- or shear-strengthened with different layers and configurations of externally bonded carbon FRP (CFRP) or glass FRP (GFRP) sheets. Full-scale four-point bending experimental tests [4, 16] are numerically simulated to predict peak load and failure mechanism. Precisely: two experimental campaigns have been taken into considerations in this paper. The first campaign includes 3 RC beams tested by Shahawy et al. [4] (namely beams labelled S5-PRE1, S6-PRE3, S6-PRE5) strengthened with 1 to 3 layers of CFRP laminates which were bonded to the soffit of the beam. Such tests were carried out up to failure to investigate mainly the effects of a variable number of CFRP laminates on the first crack load, cracking behaviour, deflections, serviceability loads, ultimate strength as well as failure modes. The second campaign was carried out at the Oregon Department of Transportation by Kachlakev et al. [16] in the late 1990s within an experimental project aimed to investigate the structural behaviour of the Horsetail Creek Bridge. Precisely, 3 full-scale RC beams were constructed and tested to experimentally replicate the structural behaviour of the actual strengthened bridge beams. Different configurations and strengthening schemes were adopted: a) one beam was flexural-strengthened by CFRP sheets, applied to the bottom of the element and having fibres oriented along the length of the beam (specimen F-SB); b) one beam was shear-strengthened by GFRP sheets, applied on the side of the element and having fibres oriented perpendicular to the length of the beam (specimen S-SB); c) one beam (specimen FS-SB) was both shear- and flexural-strengthened with combined systems a) plus b).
A quite ductile behaviour was observed in almost all the 6 examined specimens and the increased flexural/shear capacity was fully activated. In particular, in [4] all the strengthened beams failed by concrete crushing with a significant rise in the flexural capacity and ductility as the number of laminates increases; the restraining effect conveyed by the CFRP laminates was experienced even at first crack, the strengthened beams exhibiting closely spaced cracks as compared with several widely spaced cracks of the corresponding control (un-strengthened) beam. Similarly, in [16] the application of FRP sheets increased the load-carrying capacity and improved ductility of the beams, with greater deflections at failure; moreover, the addition of shear GFRP sheets compensated for the lack of stirrups and altered the failure mode from diagonal tension (shear) failure to ductile (flexure) failure. The beams, in fact, failed by flexure at the mid-span, with yielding of steel re-bars followed, after extended deflections, by crushing of concrete at the top of the beam in compression zone. However, it is worth noting that specimen FS-SB actually did not fail in the experimental test, the loading being terminated because of limitations in the testing machine capacity.
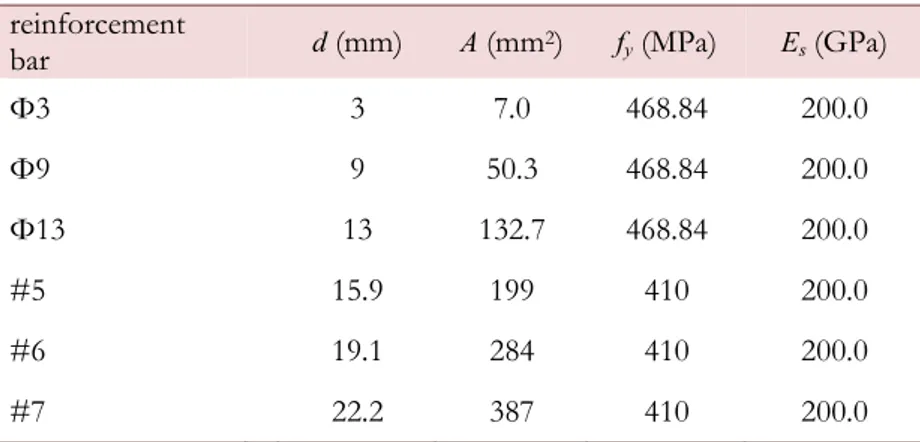
Materials properties of concrete, steel re-bars and FRP laminates of the analysed beams are reported in Tab. 1–3. For all the examined specimens the Poisson’s ratio for concrete and steel has been assumed as 0.2 and 0.3, respectively. Where not explicitly given as experimental data, the value of the concrete tensile strength reported in Tab. 2 has been assumed as ' 0.33( )'1/ 2
t c
f f according to [22], while that of the Young modulus ( '/ ).
c c
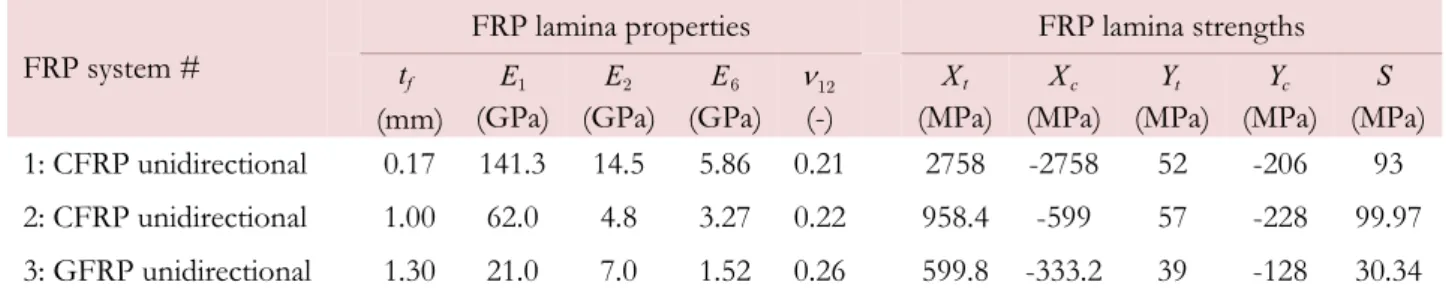
E 22 f 100 3. Likewise, with regard to the FRP strengthening sheets, typical values of the FRP lamina moduli and strengths, according to [23], have been assumed in Tab. 3 where not directly available in the experimental campaigns.
reinforcement
bar d (mm) A (mm2) fy (MPa) Es(GPa)
Φ3 3 7.0 468.84 200.0 Φ9 9 50.3 468.84 200.0 Φ13 13 132.7 468.84 200.0 #5 15.9 199 410 200.0 #6 19.1 284 410 200.0 #7 22.2 387 410 200.0
Table 1: Material properties and geometrical data of reinforcement bars of the analysed specimens
T
D. De Domenico et alii, Frattura ed Integrità Strutturale, 29 (2014) 209-221; DOI: 10.3221/IGF-ESIS.29.18 215 specimen label ' c f (MPa) ' t f (MPa) Ec (GPa) S5-PRE1 29.65 1.80 30.48 S6-PRE3 41.37 2.12 33.68 S6-PRE5 41.37 2.12 33.68 F-SB 13.75 2.31 17.55 S-SB 14.73 2.39 18.16 FS-SB 13.02 2.25 17.08
Table 2: Material properties of concrete of the analysed specimens
FRP system #
FRP lamina properties FRP lamina strengths
f t (mm) E1 (GPa) E2 (GPa) E6 (GPa) 12 (-) t X (MPa) c X (MPa) t Y (MPa) c Y (MPa) S (MPa) 1: CFRP unidirectional 0.17 141.3 14.5 5.86 0.21 2758 -2758 52 -206 93 2: CFRP unidirectional 1.00 62.0 4.8 3.27 0.22 958.4 -599 57 -228 99.97 3: GFRP unidirectional 1.30 21.0 7.0 1.52 0.26 599.8 -333.2 39 -128 30.34
Table 3: Material properties of strengthening FRP systems of the analysed specimens
Mechanical model, cross-section details and FE modelling
The mechanical model of the analysed beams is shown in Fig. 3: geometry loading and boundary conditions of the beams are reported in Fig. 3a; cross-section details with FRP strengthening schemes for each RC beam are instead sketched in Fig. 3b. The beams were tested in four-point bending, i.e. they were simply supported and loaded by two equal line loads symmetrically placed about mid-span and denoted as P p, with P being the load multiplier and p the reference load whose magnitude has been assumed so as to be equivalent to a total load of 100kN. The symmetry of the problem allows modelling only half specimen: zero displacements in z direction are set on the shaded symmetry plane shown in Fig. 3a. Note that the flexural and shear FRP sheets of the beams tested in [16] were wrapped continuously around the bottom of the beam, that is a U-shaped strengthening system has been adopted as shown in Fig. 3b. Tab. 4 specifies, for each specimen, geometrical data, mechanical details, steel re-bars arrangement and FRP configuration.
The elastic FE analyses, representing the iterations within the two limit analysis methods, have been performed by the FE-code ADINA [24]. 3D-solid 8-nodes elements, with 2x2x2 GPs per element, are adopted for modelling concrete; steel re-bars and stirrups are modelled by 1D truss elements, having 2 nodes and 1 GP per element; 2D-solid 4-nodes membrane elements, under plane stress hypothesis and with 2x2 GPs per element, are used for the thin FRP strengthening sheets. Each node is endowed with the three translational degrees of freedom, while a perfect bond between concrete and steel re-bars as well as between concrete and FRP sheets is postulated in the FE-model. Concrete, steel re-bars and stirrups are assumed isotropic; an orthotropic material formulation has been adopted for FRP sheets in the material reference system (1,2,3) where (1,2) define the orthotropy plane of the lamina with fibres oriented along the direction 1. Concerning the M– W-type yield function, for the eccentricity e, whose value can be related to the material brittleness '/ '
t c
f f , the expression proposed by Balan et al. [25] has been used. The cap surface, Eq. (3), is instead defined by the values . '
c a f 0 7923 and ' . b fc
1 8964 as suggested by Li and Crouch [18].
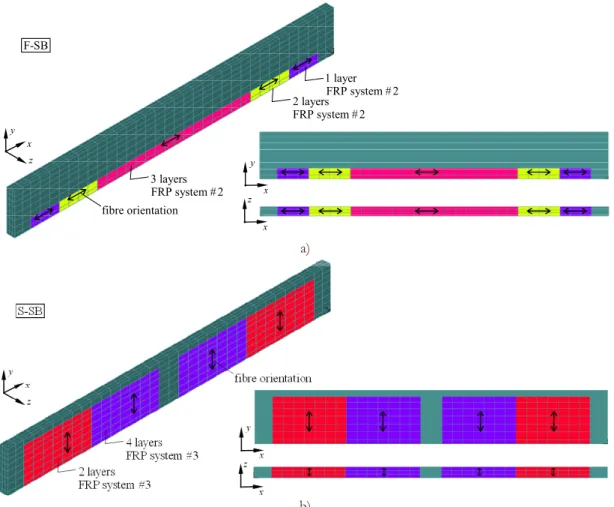
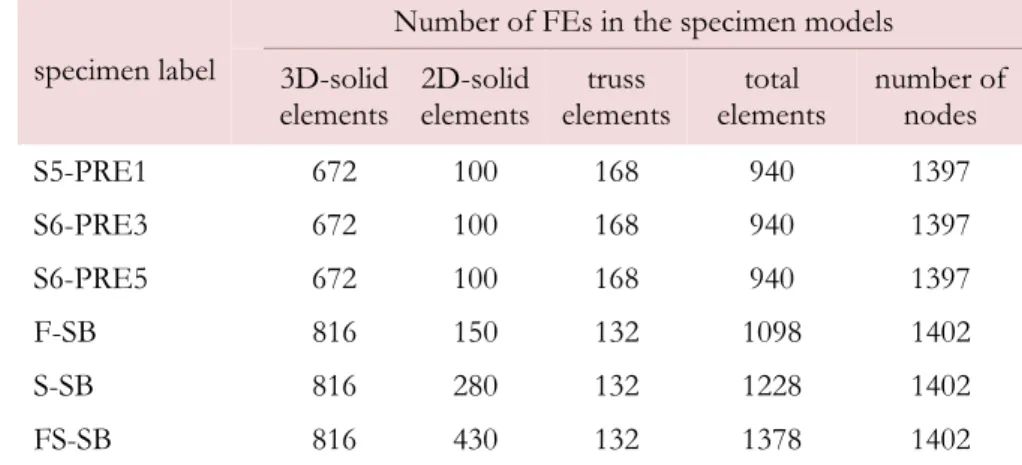
To give an idea of the FE modelling, the meshes of two of the analysed specimens are reported in Fig. 4. It is worth noting that the fully 3D FE model used (i.e. 3D FEs in conjunction with 3D constitutive concrete laws), is more accurate and truthful than 2D numerical approaches often employed in this context. In addition, the FRP strengthening plates have been modelled by 2D orthotropic laminae so taking into account the transverse stiffness contribution across the plates, though not comparable to that along the direction of the fibres. The thickness of such 2D-solid elements has been set in accordance with the number of the layers of the FRP strengthening sheets. The number of FEs, summarised in Tab. 5, has been chosen after a preliminary mesh sensitivity study to assure an accurate FE elastic solution. Finally, a Fortran main program has been utilised to control the “adjusting” of the elastic parameters at each GP of each element to accomplish the matching, when performing the LMM, and to realise the stress redistribution, within the ECM.
D. De Domenico et alii, Frattura ed Integrità Strutturale, 29 (2014) 209-221; DOI: 10.3221/IGF-ESIS.29.18
216
Numerical predictions against experimental findings
The values of the numerically predicted upper (PUB) and lower bound (PLB) to the peak load multiplier are reported in Tab.
6 and compared to the experimentally detected ones (PEXP) for all the examined specimens. By inspection of the numerical
results, the proposed limit analysis methodology appears to be an accurate predictive tool for determining the load-carrying capacity of FRP-plated RC elements. The upper bound values, predicted by the LMM, are always above the experimental ones, with relative errors of approximately 5%. Likewise, the lower bound values, predicted by the ECM, are below the corresponding experimental values with relative errors of less than 10%. The use of the LMM and of the ECM, both applied simultaneously to the three yield criteria of the main constituents of the analysed structural elements (the latter being the key feature of the numerical methodology here proposed), allows “bracketing” the real collapse load value by two bounds that are sufficiently close to each other so giving a very precise result in terms of peak load multiplier. The average (among all the considered specimens) relative errors concerning the PUB and PLB predictions are of 6.08% and
7.55%, respectively. a)
z
x
y
0 z u /2 b 0 L h LP p
P p
1 L b) y d y d f t top re-bars bottom re-bars U-shaped FRP (flexural-strengthening) b h F-SB y d y d b h f tS5 - PRE1, S6 - PRE3, S6 - PRE5 stirrups top re-bars bottom re-bars FRP sheet (flexural-strengthening) f t dy y d f t top re-bars bottom re-bars U-shaped FRP (shear-strengthening) b h f t S-SB
Figure 3: Mechanical model of the analysed specimens: a) geometry, loading and boundary conditions; b) cross-section details with FRP strengthening schemes
D. De Domenico et alii, Frattura ed Integrità Strutturale, 29 (2014) 209-221; DOI: 10.3221/IGF-ESIS.29.18
217 specimen label
geometrical details steel re-bars arrangement FRP arrangement
b
(mm) (mm)h (mm) L (mm)L0 (mm)L1 (mm)dy re-barstop bottom re-bars stirrups system #FRP layersN
S5-PRE1 203 305 2743 2439 305 54 2 Φ3 2 Φ13 Φ9@203 1a 1 S6-PRE3 203 305 2743 2439 305 54 2 Φ3 2 Φ13 Φ9@203 1a 2 S6-PRE5 203 305 2743 2439 305 54 2 Φ3 2 Φ13 Φ9@203 1a 3 F-SB 305 768 6096 5486 1828 63.5 2#6, 1#5 3#7, 2#6 – 2a 1–3 S-SB 305 768 6096 5486 1828 63.5 2#6, 1#5 3#7, 2#6 – 3b 2, 4 FS-SB 305 768 6096 5486 1828 63.5 2#6, 1#5 3#7, 2#6 – 2a+3b 1–3+ 2, 4
a the fibres are oriented along the length of the beam; b the fibres are perpendicular to the length of the beam.
Table 4: Geometrical and mechanical details of the analysed specimens
1 layer FRP system 2 layers FRP system 3 layers FRP system fibre orientation F-SB z x y z x x y a) b)
D. De Domenico et alii, Frattura ed Integrità Strutturale, 29 (2014) 209-221; DOI: 10.3221/IGF-ESIS.29.18
218
specimen label
Number of FEs in the specimen models
3D-solid elements 2D-solid elements elementstruss elements total number of nodes
S5-PRE1 672 100 168 940 1397 S6-PRE3 672 100 168 940 1397 S6-PRE5 672 100 168 940 1397 F-SB 816 150 132 1098 1402 S-SB 816 280 132 1228 1402 FS-SB 816 430 132 1378 1402
Table 5: Number of FEs for the analysed specimens.
specimen label Peak load multipliers
PEXP PUB PLB PUB/PEXP PLB/PEXP
S5-PRE1 0.666 0.720 0.570 1.081 0.856 S6-PRE3 0.979 1.093 0.913 1.116 0.933 S6-PRE5 1.162 1.206 1.076 1.038 0.926 F-SB 6.900 7.255 6.730 1.051 0.975 S-SB 6.900 7.164 6.497 1.038 0.942 FS-SB 9.300a 9.685 8.512 1.041 0.915
a beam FS-SB actually did not fail in the test and the reported value has been predicted by a nonlinear FE analysis [16]. Table 6: Peak load multipliers for the analysed specimens
Fig. 5 shows, for two of the analysed specimens, namely beam S6-PRE5 and F-SB, the plots of the upper and lower bounds to the peak load multiplier versus the iteration number. Analogous results are obtained for all the other specimens but are omitted for sake of brevity. As shown, only a few iterations are sufficient to obtain a converged solution in terms of both PUB and PLB value.
a) b) Figure 5: Values of the upper (PUB) and lower (PLB) bounds to the peak load multiplier versus iteration number against to the collapse
D. De Domenico et alii, Frattura ed Integrità Strutturale, 29 (2014) 209-221; DOI: 10.3221/IGF-ESIS.29.18
219 The numerical methodology also gives some hints on the state of specimens at incipient collapse by pointing out the plastic zones (collapse mechanism) built by the LMM at the last converged solution.
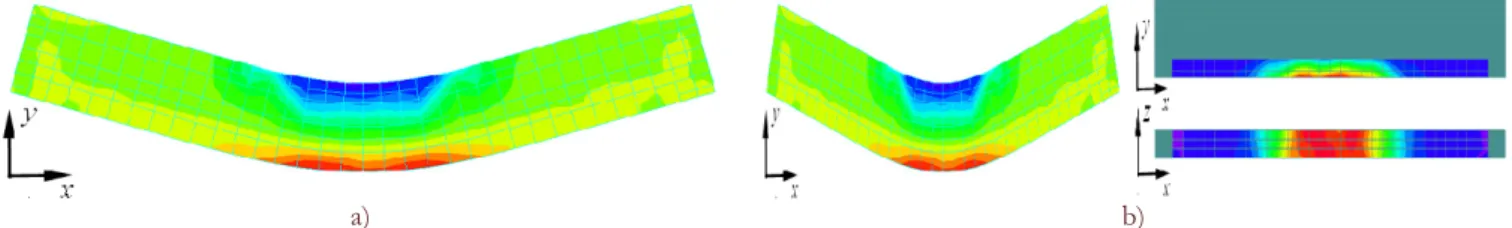
Fig. 6a and 7a show the strain rate components at collapse, c xx
, of concrete FEs in the deformed configuration for beam F-SB and S6-PRE3, respectively. The plastic zones arise at the mid-span of the element, while the remaining portions of the beam rotate rigidly around a sort of plastic hinge as observed in the experimental flexural collapse mechanism. The predicted plastic zones appear sufficiently confined and reasonably close to the damaged zones experimentally detected, see [4] and [16]. The beams fail due to concrete crushing near the loading point in the compression zone as observed in the experimental test. The collapse mechanism is also described by the strain rates at collapse of FRP FEs in the fibre direction, i.e. 1c, reported in Figs. 6b and 7b in the un-deformed configurations for the two analysed beams. The most critical FRP zones are highlighted and, obviously, these zones are those where the FRP sheets, to a greater extent, bear the load and act compositely with concrete in the global collapse mechanism. Finally, it is worth noting that for both the predicted collapse mechanisms the stresses numerically obtained in the steel FEs at the mid-span (where a plastic hinge develops) are just yielded as observed in the experimental outcomes. Other types of FRP-strengthened RC-elements have been analysed within the same research programme, obtaining encouraging confirmations on the predictive performance of the proposed approach, see e.g. [26].
a) b)
Figure 6: Collapse mechanism of the specimen F-SB: a) contour plot of the strain rate components c
xx of concrete FEs reported in the deformed configuration of the beam; b) contour plot of the strain rates 1c of FRP FEs in the fibre direction
a) b)
Figure 7: Collapse mechanism of the specimen S6-PRE3: a) contour plot of the strain rate components c
xx of concrete FEs reported
in the deformed configuration of the beam; b) contour plot of the strain rates 1c of FRP FEs in the fibre direction
CONCLUDING REMARKS
numerical limit analysis methodology has been presented to analyse RC members strengthened with externally bonded FRP plates. A multi-yield-criteria formulation has been proposed to appropriately describe the behaviour, at a state of incipient collapse, of the three main constituent materials: concrete, steel-bars and FRP laminates. The latter formulation is essential to deal with concrete crushing, steel bars yielding and FRP rupture that may occur at ultimate limit states. The lack of associativity postulated for concrete and FRP composite laminates has resulted in adopting a nonstandard limit analysis approach which underlies the use of two numerical methods for limit analysis, the LMM and the ECM, to search for an upper and a lower bound to the actual peak load multiplier.
Operationally, as compared to previous results presented in [12] or to alternative numerical approaches e.g. [16, 27, 28], the multi-yield-criteria formulation here proposed does not entail any significant computational cost: simple FE analyses (performable with any commercial FE-code) have to be solved. The more accurate and consistent 3D modelling that accounts for three materials through three distinct yield criteria seems to give good results.
The reliability and effectiveness of the proposed methodology have been proved by analysing full-scale laboratory tests on RC beams strengthened with externally bonded FRP sheets. The obtained numerical results, in terms of peak load
A
D. De Domenico et alii, Frattura ed Integrità Strutturale, 29 (2014) 209-221; DOI: 10.3221/IGF-ESIS.29.18
220
multiplier and collapse mechanism, are very satisfactory and correlate well with the corresponding experimental findings [4, 16]. The methodology appears able to deal with practical engineering problems such as the estimate of the load-carrying capacity of RC beams strengthened by FRP sheets, issue of great significance in civil engineering. The numerical methodology may be also viewed as an useful predictive tool for estimating the actual efficacy of strengthening systems for existing structures.
REFERENCES
[1] American Concrete Institute ACI 440, Guide for the design and construction of externally bonded FRP systems for strengthening concrete structures, ACI 440.2R-08 (2008).
[2] FIB Bulletin 14, Externally bonded FRP reinforcement for RC structures, Task group 9.3, International Federation of Structural Concrete, (2001).
[3] Dong, J., Wang, Q., Guan, Z., Structural behaviour of RC beams with external flexural and flexural–shear strengthening by FRP sheets, Composites Part B, 44 (2013) 604–612.
[4] Shahawy, M.A., Arockiasamy, M., Beitelmant, T., Sowrirajan, R., Reinforced concrete rectangular beams strengthened with CFRP laminates, Composites Part B, 27B (1996) 225–233.
[5] Maier, G., Pan, L., Perego, U., Geometric effects on shakedown and ratchetting of axisymmetric cylindrical shells subjected to variable thermal loading, Engineering Structures, 15(6) (1993) 453–466.
[6] Ardito, R., Cocchetti, G., Maier, G., Generalised limit analysis in poroplasticity by mathematical programming, Archive of Applied Mechanics, 80 (2010) 57–72.
[7] Caporale, A., Feo, L., Luciano, R., Limit analysis of FRP strengthened masonry arches via nonlinear and linear programming, Composites Part B: Engineering, 43(2) (2012) 439–446.
[8] Grande E., Milani G., Sacco E., Modelling and analysis of FRP-strengthened masonry panels, Engineering Structures, 30(7) (2008) 1842–1860.
[9] Benvenuti, E., Vitarelli, O., Tralli, A., Delamination of FRP-reinforced concrete by means of an extended finite element formulation, Composites Part B: Engineering, 43(8) (2012) 3258–3269.
[10] Marfia, S., Sacco, E., Toti, J., A coupled interface-body nonlocal damage model for the analysis of FRP strengthening detachment from cohesive material, Fracture and Structural Integrity, 18 (2011) 23–33.
[11] Pisano, A.A., Fuschi, P., De Domenico, D., A kinematic approach for peak load evaluation of concrete elements, Computers and Structures, 119 (2013), 125–139.
[12] Pisano, A.A., Fuschi, P., De Domenico, D., Peak loads and failure modes of steel-reinforced concrete beams: predictions by limit analysis, Engineering Structures, 56 (2013) 477–488.
[13] Pisano, A.A., Fuschi, P., De Domenico, D., Limit state evaluation of steel-reinforced concrete elements by von-Mises and Menétrey–Willam-type yield criteria, International Journal of Applied Mechanics, (accepted for publication). [14] Pisano, A.A., Fuschi, P., De Domenico, D., A layered limit analysis of pinned-joints composite laminates: Numerical
versus experimental findings, Composites Part B, 43 (2012) 940–952.
[15] Pisano, A.A., Fuschi, P., De Domenico, D., Failure modes prediction of multi-pin joints FRP laminates by limit analysis, Composites Part B, 46 (2013), 197–206.
[16] Kachlakev, D., Miller, T., Yim, S., Chansawat, K., Potisuk, T., Finite Element Modeling of Reinforced Concrete Structures Strengthened with FRP Laminates, Final Report SPR 316 (2001), Oregon Department of Transportation Research Group, USA, May 2001.
[17] Menétrey, P., Willam, K.J., A triaxial failure criterion for concrete and its generalization, ACI Structural Journal, 92 (1995) 311–318.
[18] Li, T., Crouch, R., A C2 plasticity model for structural concrete, Computers and Structures, 88 (2010) 1322–1332. [19] Tsai, S.W., Wu, E.M., A general theory of strength for anisotropic materials, J. of Comp. Mater., 5 (1971) 58–80. [20] Ponter, A.R.S., Carter, K.F., Limit state solutions, based upon linear elastic solutions with spatially varying elastic
modulus, Comput. Methods Appl. Mech. Eng., 140 (1997) 237–258.
[21] Mackenzie, D., Boyle, J.T., A method of estimating limit loads by iterative elastic analysis Parts I, II, III, International Journal of Pressure Vessels and Piping, 53 (1993), 77–142.
[22] Bresler, B., Scordelis, A.C., Shear stength of reinforced concrete beams, J. of Am. Concr. Inst., 60(1) (1963) 51–72. [23] Daniel, I.M., Ishai, O., Engineering Mechanics of Composite Materials, Oxford University Press, USA, 1994.
[24] ADINA R & D, Inc. Theory and Modeling Guide Volume I: ADINA, Report ARD 11-8, Watertown (MA,USA), (2011).
D. De Domenico et alii, Frattura ed Integrità Strutturale, 29 (2014) 209-221; DOI: 10.3221/IGF-ESIS.29.18
221 [25] Balan, T.A., Spacone, E., Kwon, M., A 3D hypoplastic model for cyclic analysis of concrete structures, Engineering
Structures, 23 (2001) 333–342.
[26] De Domenico, D., Pisano, A.A., Fuschi, P., A FE-based limit analysis approach for concrete elements reinforced with FRP bars, Composite Structures, 107 (2014) 594–603.
[27] Hu, H.T., Lin, F.M., Jan, Y.Y., Nonlinear finite element analysis of reinforced concrete beams strengthened by fiber-reinforced plastics, Composite Structures, 63 (2004) 271–281.
[28] Limam, O., Foret, G., Ehrlacher, A., RC beams strengthened with composite material: a limit analysis approach and experimental study, Composite Structures, 59 (2003) 467–472.