ORIGINAL PAPER
Ranking high schools using university student performance
in Italy
Carmen Aina1,2 · Massimiliano Bratti2,3,4,5 · Enrico Lippo1 Received: 4 November 2019 / Accepted: 23 November 2020
© The Author(s) 2020
Abstract
The Eduscopio project is the first attempt to build school performance indicators based on the university performance of high school leavers in Italy. It provides stake-holders (students and their families) with publicly available school performance indicators, and school rankings. A potential weakness of Eduscopio is that it relies on first-year student performance only. In this study, we extend its methodology to include longer-term academic outcomes, such as cumulative third-year performance and the probability of on-time graduation. Our results demonstrate that differences in university students’ performance across high schools are not temporary and lim-ited to the first-year, but persist in the following academic years, and that the ranking of high schools based on longer-term indicators remains rather stable. Moreover, our analysis highlights non-negligible differences of between-school track dispersion in the Eduscopio index across cities, which hints on geographical differences in student selection mechanisms into school tracks or in the level of dispersion of school value added within tracks.
Keywords Eduscopio · High school · University performance · School ranking · Italy
JEL Classification I20 · I21 · I23
1 Introduction
Making conscious educational choices requires having information on the costs and benefits of each available alternative. The need to provide information to the public and increase “school accountability” has produced in some countries school ranking
Electronic supplementary material The online version of this article (https ://doi.org/10.1007/s4088 8-020-00208 -2) contains supplementary material, which is available to authorized users.
* Carmen Aina [email protected]
exercises, undertaken by both governments (such as in the case of England, see Kelly and Downey 2010) and academics.1 In most cases, these exercises are aimed
at evaluating “school value added”, i.e. a school’s contribution to student academic performance over and above the characteristics of the school intake (such as prior school achievement and student family background).
Until very recently, information to support school choice was not available in Italy: there was no rigorous assessment of school performance, so parents and stu-dents had to rely mainly on informal knowledge provided by other parents or older peers. Although from the academic year 2009/2010 a standardized test for 10th graders, i.e. the second year of high school, was introduced in Italy — the so-called INVALSI (i.e. National Institute for the Evaluation of the Education System) test — average raw results (i.e. not controlling for contextual factors) were not publicly released for all schools,2 and the decision to make the results public was left to the
individual initiative of school principals.3 This lack of information is particularly
worrying in Italy due to high intergenerational persistence of educational attainment (see, for instance, Checchi et al. 1999; Hanushek and Wößmann 2006; Checchi and Flabbi 2013). Indeed, parental education is a key determinant in shaping offpring’s school choice (Checchi and Flabbi 2013).
Thus, to partly fill this information gap, the Fondazione Giovanni Agnelli (here-after FGA) launched in November 2014 a new web portal named Eduscopio,4
list-ing school performance indicators (PIs) for Italian high schools. Its main aim is to build PIs to measure the contribution of each school to university performance using the first-year performance of all students coming from that school (Edusco-pio Università), or to students’ labor market outcomes after graduating from high school (Eduscopio Lavoro). The first set of PIs is mainly thought for academic and technical schools, and the second one for technical and vocational schools. In the current paper, we focus on the Eduscopio Università’s (Eduscopio, for brevity) PIs. The latter are computed using administrative data on the Italian population of stu-dents enrolled in Higher Education (HE, hereafter) in Italy, which are gathered by the National Archive of Students and Graduates (henceforth ANS) maintained by the Italian Ministry of University and Research (MUR). Although Eduscopio reports information on a very high number of high schools across the whole Italy, the web portal advises users to make comparisons only within the same school track and between geographically close schools (e.g. located in the same city or province).
1 The literature on school ranking and school value added counts hundreds of contributions and is too vast to be reviewed here. More recently, the international literature has mainly focused on teacher value added models (e.g. Chetty et al. 2014a, b; Koedel et al. 2015).
2 Here we refer to “high school” and upper secondary education (spanning the 9th-13th grades) as syno-nyms. Italy has a tracked upper secondary school system, and the three main tracks are: Academic high schools (Licei), Technical schools (Istituti Tecnici), and Vocational schools (Istituti Professionali), which are further divided by field of study (see Section 3.2).
3 Moreover, school principals generally published the average raw score, without normalizing it for the student characteristics.
Since the first release, Eduscopio has seen a sharp rise in the interest of users. In December 2015, one year after the first release, the hits on the website increased by about 13.6%, especially those made by distinct users (18.3%), as reported in Vuri (2018).
The great attention received by this web portal proves its growing relevance as a useful tool for secondary school choice in the Italian context, where the decision of which high school track to enroll is made at a relative early age (i.e. usually 13), namely during the last year of the middle school (Vuri 2018). As it has been shown in several studies (see among others, Bauer and Riphahn 2006; Hanushek and Wöß-mann 2006; Dustmann 2004), choosing at a early age the high school track reduces intergenerational educational mobility, with children of less educated parents more likely to enroll in non-academic secondary school tracks, undermining their subse-quent educational achievements. In this context, the availability of free information on high schools’ performances could contribute to reducing the educational inequal-ities caused by parental background.5
Against this background, the goal of this paper is twofold. First, we address a potential weakness of the methodology used in Eduscopio, which builds school PIs only based on students’ first-year university performance. Indeed, FGA originally chose to compute the indicators on the first-year only, on the basis of the strong cor-relation of the latter with later student performance reported in the literature (see, for instance, Porter and Swing 2006; Lang 2007; Jamelske 2009). We extend the time horizon of the ANS data used to compute the indicators, considering student performance both one year and three years from first enrollment and the probability of graduating within the legal duration of the degree course. The latter is a meaning-ful PI given the long average graduation times observed in Italy (Aina et al. 2011; Garibaldi et al. 2012). Assessing the robustness of first-year PIs to extending the time horizon of the analysis and building PIs using longer-term academic outcomes may be particularly important in countries such as Italy, in which entrance in HE is mostly non-selective (especially at undergraduate level) and student drop-out rates are inherently high (Di Pietro and Cutillo 2008). Second, we aim to provide a first exploration of potential geographical inequality of performances across schools.
Our analysis demonstrates that first-year Eduscopio’s PIs are informative on the “quality” of a school’s overall learning environment.6 In particular, the high school
ranking built on first-year performance is robust to measuring performance at the third-year and (even if to different degrees depending on school track) to considering
5 The importance of information in the educational context is theoretically investigated in a recent paper by Femminis and Piccirilli (2020), which demonstrates that increasing the quality of public information raises individuals’ welfare. Yet, empirically, it is not clear whether higher “school accountability” may increase rather than decrease educational inequality, if families with higher socio-economic background benefit more from the available information (Hart and Figlio 2015). On the other hand, release of infor-mation on school performance may enable schools to take actions to improve their effectiveness (Burgess et al. 2013). See Plank and Sykes (2003) for a discussion of the effect of increasing school choice in the international context.
6 In what follows, we sometimes refer to “school quality” in a loose sense not meaning “school value added” but demand (i.e. student-related) or supply (i.e. school- or teacher-related) factors that may explain better school performance.
on-time graduation. Second, focusing on three largest Italian cities (Rome, Milan and Naples) our study reports different levels of between-school track dispersion in the Eduscopio index at the geographical level, even in cases in which student perfor-mances should be more homogeneous as comparisons are limited to the same city (as suggested by FGA).
The paper is organized as follows. In the next section, we briefly introduce the logic behind the Eduscopio index and discuss its main strengths and weaknesses. Section 3 describes in more details the main characteristics of the data, and the sam-ple selections made before computing the indicators, which mimic those applied by FGA to build Eduscopio. Section 4 presents in detail the methodology used by Eduscopio, and how the proposed indicators are extended to reflect longer-term stu-dent outcomes, namely academic performance within three years from first-time university enrollment, and the probability of graduation within the degree legal duration. Our main results are discussed in Section 5 while some robustness checks are reported in the online Appendix C. Section 6 draws conclusions.
2 Eduscopio “at a glance”
In this Section, we briefly summarize the idea underlying the Eduscopio index, while a more detailed description of its methodology is left to Section 4.
The simple idea of the Eduscopio index is to estimate educational production functions (Todd and Wolpin 2003) in which the dependent variables are measures of academic performance, using school fixed effects. The latter are the basic build-ing blocks of the Eduscopio index. In order to compare “like with like”, in a first-step the dependent variables are regressed on some individual characteristics (e.g. gender, age, region of residence, secondary school track and graduation mark) and some university-level characteristics, namely Higher Education Institution (HEI) of enrollment-college major fixed effects. The goal of this step is to purge the depend-ent variable from differences in grading standards or grading styles existing across HEIs and fields of study. Thus, given that there is not a common standard applied by Italian HEIs (Bagues et al. 2008), this is an attempt to report individual performance on a common “metric”. In this step, individual characteristics are only included to make sure that the HEI-college major fixed effects only reflect the different grading standards or styles and not differences in college-readiness or other student charac-teristics affecting educational success. Indeed, after running this first step, all these individual characteristics are not purged out from the dependent variable, which is only cleaned of the HEI-college major fixed effects (see Section 4.1 for the details). This “standardized” dependent variable is then regressed in a second step on school fixed effects, which are used to build the Eduscopio index.
From this summary description it is already possible to make a couple of remarks. First, since individual-level performance is not cleaned of prior educational achievement or student ability, the school fixed effects capture several factors, such as school and teacher value added but also the quality of the student intake. In this sense, they cannot be considered as a measure of school value added or as an esti-mate of the “causal effect” of schools on student performance. The point of view of
FGA is that when choosing schools, parents and students are likely to be interested in the “full package” and not necessarily in measures of school value added (which may be high even in low-performing schools, since it is the value that schools add to an eventually low quality student intake).7
Notwithstanding this limitation, the Eduscopio index is one of the few sources of information on which parents and students can base their school choices. The alter-native is the school average raw INVALSI test score (i.e. not controlling for con-textual factors), which is sometimes published by schools. Indeed, the individual-level INVALSI data are only released to researchers in anonymized form. Not only students but also schools are kept anonymous and although these data have started to be used for research purposes to investigate the drivers of student performance (see, for instance, Angrist et al. 2017; Battistin et al. 2017; Lucifora and Tonello
2015; Argentin and Triventi 2015) and to estimate value added models (Minaya and Agasisti 2019; Schiltz et al. 2019), they are not useful for the objective of build-ing school rankbuild-ings available to the general public. A crucial difference between the INVALSI test and the Eduscopio index is that the latter gives more direct informa-tion on student ability to succeed in HE, providing complementary informainforma-tion to the INVALSI test. Moreover, unlike the INVALSI test, which is a low-stake test, Eduscopio bases its PIs on high-stake exams, i.e. those that students have to pass at university and which will partly determine their future employment outcomes. Thus, given the paucity of the information available to stakeholders, we deem it important to test the robustness of the Eduscopio index to considering longer-term academic outcomes.
The Eduscopio index also provides an interesting descriptive tool to analyze potential inequalities in university-level student performance (depending on both school quality and the quality of the student intake) between schools. Indeed, in a prevalently publicly-managed and publicly-financed school system such as Italy’s, schools should provide a service of homogenous quality and one could expect little “school segregation”, especially when comparing schools within the same school track and city.
3 Data and sample selection
3.1 Data
The dataset used in our empirical exercise is built by linking three distinct adminis-trative sources of data provided by MUR,8 namely:
a. the National Archive of Schools (i.e. Anagrafe Nazionale delle Scuole);
7 However, FGA is considering to test the robustness of the Eduscopio index to including controls for student prior educational achievement, measured by the middle school INVALSI test score.
1 the dataset containing details on the characteristics of the high schools (i.e. Scuola in Chiaro);
2 the National Archive of Students and Graduates (i.e. Archivio Nazionale degli Studenti e dei Laureati, ANS).
From the National Archive of Schools, we drew the list of the Italian high schools including the name, the type (i.e. school track) and the address. To this set of vari-ables, we added the number of secondary school graduates and their average final graduation mark by type of high school. By exploiting such information, we are able to select the academic and technical high schools only, which are the focus of Eduscopio Università. The academic careers of the students enrolled in the Ital-ian tertiary education system, instead, are drawn from the ANS. ANS contains the administrative records of each student, so that, during the academic years 2009/10, 2010/11 and 2011/12, for each cohort of freshmen we have details on gender, nation-ality, year of birth, high school’s municipnation-ality, name and type of high school, year of high school diploma, high school final mark, the list of university exams passed and the corresponding amount of credits, the dates when exams were taken, grade per exam, name of the degree course (along with college major) and of the University, and part-time student status (i.e. part-time or full-time). The academic career of each student is available for the entire period she is included in the ANS archive, also in case she changed degree course and/or University, up to the 31st of October 2017. 3.2 Sample selection criteria
The ANS data allow to track the careers of the individuals who enrolled in the Ital-ian HE system, either in a Bachelor’s or in a single-cycle degree (i.e. Laurea a Ciclo Unico),9 in the academic years 2009/2010, 2010/2011 and 2011/2012.10 Each
stu-dent’s career is then observed from the matriculation day up to its end (i.e. gradua-tion, dropout) or, in case a student is still enrolled in HE, up to 31st of October 2017. Overall, we observe 1,094,875 careers but, considering that a student may have more than one career, our sample consists of 1,026,111 distinct students and represents the population of individuals who enrolled in the university system in the afore-mentioned academic years. Starting from this dataset, to increase comparability, we keep only those students who received their diploma from an Italian high school in the school years relevant for our analysis, which are 2008/2009, 2009/2010 and 2010/2011. Therefore, in our sample, an individual may have started her academic
9 After the Bologna process, in Italy HE consists of two levels of degree: first-level degrees, whose dura-tion is generally three years and second-level degrees (2 years). However, university degrees are struc-tured in a single cycle in some degree subjects, lasting 5 years or more (i.e. Medicine and Surgery, Den-tistry and Dental Prosthesis, Law, Primary Education Sciences, Veterinary, Architecture, Pharmaceutical Chemistry and Technology).
10 These years refer to the period immediately following the Great Recession of 2008, so one may won-der if changes in university enrollment choices due to the crisis may affect our results. However, from the analysis of university enrollment rates, the behavior of such years does not seem to be any different from that of the preceding years, just confirming a falling trend in enrollment.
career with none, one or two years of delay. We also drop those students that were more than 22 years old when they achieved their high school diploma. This latter choice is motivated by the fact that students with delayed careers (e.g., those who repeated grade levels) typically show fragmented careers in different schools. As a consequence, it would be incorrect to entirely attribute the school effect to the insti-tution in which they are awarded their diploma.
The Italian secondary school system, as designed by the 2010 reform, is organ-ized into three main types of high schools, which are subsequently divided into fur-ther specializations: (A) Lyceum (Liceo); (B) Technical Institutes (Istituti Tecnici) and (C) Vocational Institutes (Istituti Professionali). Lyceum is further divided into six types: (1) Art Lyceum (Liceo Artistico); (2) Classic Lyceum (Liceo Classico); (3) Linguistic Lyceum (Liceo Linguistico); (4) Music and Dance Lyceum (Liceo Musicale e Coreutico); (5) Scientific Lyceum (Liceo Scientifico) and (6) Human Sci-ences Lyceum (Liceo delle Scienze Umane). Technical Institutes are in turn organ-ized into two main macro-fields and eleven sub-fields: (1) Economic Sector (Settore Economico) which has 2 sub-fields and (2) Technological Sector (Settore Tecnolog-ico) with 9 sub-fields. Finally, Vocational Institutes (Istituti Professionali) are organ-ized into two macro-areas and 6 sub-fields: (1) Services Sector (Settore dei Servizi) with 4 sub-fields and (2) Industry and Handicraft Sector (Settore Industria e Artig-ianato) with 2 sub-fields.
We are not able to include in our analysis the Art Lyceum and the Music and Dance Lyceum (2% of students) due to the fact that most of their students enroll in the AFAM system (Advanced Training Schools in Art and Music subjects), which is not covered by the ANS data.
Moreover, we exclude from the analysis Vocational Institutes (4.3%), which are typically oriented towards vocational subjects and, having a job-oriented education, also have low university enrollment rates. Consequently, we focus on the remaining six types of high schools: (1) Classic Lyceum; (2) Linguistic Lyceum; (3) Scientific Lyceum; (4) Human Sciences Lyceum; (5) Technical-Economic Sector Institutes and (6) Technical-Technological Sector Institutes. We prefer to keep the distinction between Technological and Economics schools for the Technical Institutes because, although they are both classified as Technical Institutes by the reform, these schools are historically considered as belonging to very different fields of study. After these selections, our working sample consists of 692,746 careers belonging to 643,867 students. More in detail, 596,625 students (92.7%) show a single university career, 45,638 students (7.1%) have two careers, and the remaining part shows from three up to five careers (0.2% of the sample corresponding to 1,604 individuals). In order to simplify our analysis, we drop the students who have more than two university careers, remaining with a sample of 642,263 individuals. Each student of our work-ing sample is then linked with her high school of origin uswork-ing the National Archive of Schools and Scuola in Chiaro. Among the remaining types of high schools, we exclude from the analysis those schools having an aggregate university matricula-tion rate lower than 33% and with less than 21 students (the size of around a school class) enrolled in HE considering the three cohorts of freshmen included in the anal-ysis. Although these thresholds are somehow arbitrary, they are in line with the sam-ple selection made in the original version of Eduscopio, and have the objective of
relying on a sufficient number of students for each school to build the Eduscopio’s PIs.
The final sample is composed of 642,263 individuals, whereas the schools ranked by Eduscopio are 4,280. The descriptive statistics of student characteristics are reported in Table A1 in the online Appendix A, which also highlights other features of the data. The majority of students are females (about 57%) and Italian citizens (97.6%). The average age at university matriculation is 19 and the mean of the high school mark is 79.11 Students tend to enroll at university the same year in which they
complete upper secondary education. Only 8.5% and 0.4% take one- and two-year gaps, respectively. The percentages of students by region reflect the size of regional populations. Students are not very mobile as they attend degree courses, on aver-age, 86 kilometers away from the high school they attended. Table A2 in the online Appendix A reports the characteristics of the high schools ranked by Eduscopio. About 70% of them are academic schools (i.e. Lyceum), whereof 30.5% are Sci-entific Lyceum, and 13% are private institutions. The average cohort size of high school graduates in our data (after applying the sample selection criteria explained above) varies by high school track. For instance, each Scientific Lyceum provides the largest number of freshmen (i.e. 80 students per year), followed by Classic Lyceum (60 students), whereas technical schools supply on average about 30 students per year (see Table A3 in the online Appendix A). Table A4 in the online Appendix A reports the distribution of students by high school track and college major. Not sur-prisingly, major choice is highly associated with the type of high school diploma obtained, for example, high school leavers from Scientific Lyceum are more likely to enroll in Engineering, Sciences and Economics, while TI-Economics high school graduates mainly enroll in Economics and Law.
3.3 Outcome variables
Using information on individuals’ university careers, Eduscopio builds, for each stu-dent, two academic performance indicators:
a. the Percentage of University Credits (PUC); 1 the Grade Point Average (GPA).
Both indicators are computed at the end of the first academic year and used as dependent variables in the regressions outlined in Section 4.
The PUC achieved by a student at the end of the first academic year, which is conventionally set at the 30th April t + 2 , where t is the calendar year of the stu-dent’s first-time enrollment, is defined as:
11 The high school mark ranges between 60 to 100 cum laude. We assigned the value 101 to 100 cum laude.
where i indexes students, j high schools, and t the calendar year of enrollment; ni is
the number of exams passed by individual i, k is the exam subscript, and CFUij is the number of achievable university credits which depends both on the major and on student status (i.e. part-time or full-time).12
A student’s GPA at the end of the first academic year is defined as:
where each mark obtained by student i for exam k is weighted by the corresponding number of credits for that exam ( CFUij
k ). Notice that ∑ ni k=1CFU
ij
k may be different
from CFUij because some exams are awarded a “pass” grade.13
In order to check the robustness of the ranking obtained by Eduscopio, we com-pute the PUC and GPA indicators also at the end of the third academic year, which we conventionally set at the 30th of April of year t + 4 . We also investigate the robustness of the indicators considering the 31th October of year t + 1 and t + 3 as the cut-off dates. The latter results are reported in the online Appendix C.
As a further PI, we look at a student’s graduation status, namely we create a dummy variable which equals one if a student obtains a degree within the degree legal duration and zero otherwise:14
where I(.) is the indicator function. Dij
t =0 includes all individuals who do not
grad-uate on time (e.g. dropouts, students who did not gradgrad-uate on time or still have to graduate).
4 The methodology of Eduscopio
The procedure followed by FGA to compute school rankings consists of three steps (Bernardi and De Simone 2018):
(1) PUCijt = ni ∑ k=1 CFUkij CFUij (2) GPAijt = ∑ni k=1mark ij k⋅ CFU ij k ∑ni k=1CFU ij k (3) Dijt =I(on-time graduation)
12 In the Italian HE system each exam is associated with a given number of CFUs, and each CFU cor-responds to 25 hours of student workload (including individual study hours). A first-level degree requires 180 CFUs.
13 If a student does not pass any exam in the selected time period her indicators will be PUC=0 (i.e. inactive students) with missing GPA. Following Eduscopio’s methodology, inactive students only con-tribute to the PUC part of the index (see Step 3 in the next section).
14 The legal duration is equal to three years for first-level degrees and five or six years (Medical Studies) for single-cycle degrees.
Step 1. The outcome variables defined in Section 3.3 are regressed on some student and university level characteristics to “clean” them from the average differ-ences in student performance that are university- and college-major specific. The raw outcome variables are “standardized” by subtracting the university-college major fixed effects that are estimated;
Step 2. The standardized performances computed in the previous step are regressed on a set of school fixed effects and year of secondary school graduation fixed effects. This procedure is applied to both the percentage of university credits and the grade point average, which are the two building blocks of the Eduscopio index;
Step 3. The school fixed effects for PUC and GPA estimated in the previous step are normalized to vary in the 0-100 scale and then combined together to build the Eduscopio final index.
In the following sections, we describe the three steps in more detail. 4.1 Step 1. Regression of student performance on individual‑level
and university‑level characteristics
The first step can be described by the following equation
where i, c and t are individual, HEI-college major and time subscripts, respectively; p = (PUC, GPA ) is the outcome superscript. It is worth noting that we use pooled cross-section data, i.e. we only have one observation for each individual. However, there is a time dimension since we pool three cohorts of university entrants in the analysis. yp
ict is the outcome of interest (PUC, GPA). 𝐗i is a vector of individual level
characteristics including: gender, immigrant status, distance between the municipal-ity of the secondary school and that of the universmunicipal-ity degree course attended.15 𝐙
i is
a vector of characteristics related to the student’s secondary school career: school track, high school final mark, region, age at high school completion and age at uni-versity matriculation. 𝜙c are university-college major fixed effects, which control for
average differences in grading policies or the average speed of student progression across HEIs and college majors (see, for instance, Bagues et al. 2008). 𝜏t are
aca-demic year of enrollment fixed effects. 𝜖ict is an individual error term.
The main purpose of this step is to estimate a set of university-college major fixed effects ( 𝜙c ) that reflects differences in grading styles or standards that are
university-college major specific. To this end, it is crucial to control for students’ characteris-tics that may affect university performance such as, for instance, secondary school track or high school final mark, which are proxies of a student’s ability.
(4) ypict= 𝛽0+ 𝛽1𝐗i+ 𝛽2𝐙i+ ∑ c𝜙c+ ∑ t𝜏t+ 𝜖ict
15 These geodesic distances are computed using municipalities’ centroids (for both the high school and the university of enrollment) as input coordinates and the Stata command geodist.
The estimates from equation (4) are used to compute the following net (or stand-ardized) performance, both for PUC and GPA
In this way, we obtain for each student a measure of academic performance that is standardized with respect to the “average academic performance” of her peers enrolled in the same college major and Alma Mater. The summary statistics of the standardized outcome variables are reported in Panel A of Table 1. Table A5 in the online Appendix A reports the correlations between all standardized and non-stand-ardized performance measures. Not surprisingly, the correlations of the same per-formance measure (PUC or GPA) across university enrollment years and between standardized and non-standardized measures is quite high. Correlations between first- and third-year performance indicators and graduation on time are somehow lower (higher for PUC than for GPA16). The Table also shows that ‘speed’ of studies
(PUC) is not necessarily very highly correlated with the quality of academic results (GPA).
4.2 Step 2. Estimation of school fixed effects The standardized outcome variables ( ̃yp
it s) are regressed on a set of school ( 𝜃j ) and
year of matriculation ( 𝜋t ) fixed effects, as follows
where i, j and t are individual, high school and time subscripts, respectively; p = (PUC, GPA ) is the outcome superscript, and 𝜌ijt is an error term. Our main
coef-ficients of interest are the school fixed effects, which capture the average perfor-mance of all students enrolled in HE coming from the same school. Such average performance also reflects the contribution of the school track and of other measures of school quality which are captured by the average secondary school final mark awarded by that school.17
It is worth noting that these school fixed effects capture a mix of different effects that schools have on students’ university performances. In particular, they capture both the impact of the average ability and of the average socio-economic status of the students enrolled in each school as well as the school value added (i.e. the school contribution to academic performance, over and above student characteristics). Indeed, FGA claims that parents are interested in all these aspects when choosing a high school for their children.
(5) ̃ ypit=yict−∑ c𝜙c. (6) ̃ ypijt= 𝜇0+∑𝜃j+∑𝜋t+ 𝜌ijt
16 Indeed, to complete studies within the legal duration of a degree course is necessary to achieve all the credits in each academic year, regardless of the marks obtained.
17 The rationale for not purging the residual of equation (5) from the correlations with the school track and high school graduation marks is that they partly reflect the school contribution to the students’ aca-demic readiness before enrolling at university.
4.3 Step 3. Construction of the Eduscopio index
The fixed effects computed in Section 4.2 are first re-scaled between 0 and 100
where 𝜃p min and 𝜃
p
max are the smallest and the largest fixed effects estimated for
out-come p, respectively. Then the two rescaled fixed effects for PUC and GPA are com-bined into the Eduscopio index
which weights equally PUC and GPA. This is the way the Eduscopio index is com-puted for first-year performance, and how we built it for three-year performance. For graduation outcomes, instead, we built the Eduscopio index as the normalized school fixed effects (in the 0-100 range) computed from a linear probability model for on-time graduation.
(7) 𝜃p[0,100],j= 𝜃jp− 𝜃pmin 𝜃minp − 𝜃maxp ⋅ 100 (8) ESj=0.5 ⋅ 𝜃[0,100],jPUC +0.5 ⋅ 𝜃 GPA [0,100],j
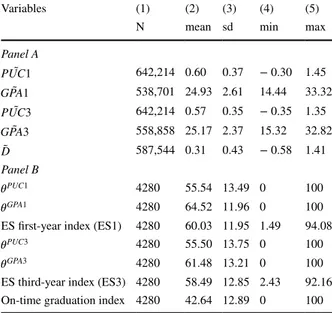
Table 1 Summary statistics of the standardized outcome variables at student level and performance indicators at school level
Panel A reports the standardized summary statistics of the out-come variables defined at student level, that are obtained after raw performance measures have been purged from HEI-college major fixed effects (see Step 1). ̃PUC , ̃GPA and ̃D stand for standardized Percentage of University Credits, Grade Point Average and on-time graduation, respectively. Panel B shows the summary statistics of the Percentage of University Credits (PUC) ( 𝜃PUC ), Grade Point Average
(GPA) 𝜃GPA , Eduscopio (ES) and on-time graduation indexes defined
at high school level. The numbers “1” and “3” refer to the first and third academic year, respectively
Variables (1) (2) (3) (4) (5)
N mean sd min max
Panel A ̃ PUC1 642,214 0.60 0.37 − 0.30 1.45 ̃ GPA1 538,701 24.93 2.61 14.44 33.32 ̃ PUC3 642,214 0.57 0.35 − 0.35 1.35 ̃ GPA3 558,858 25.17 2.37 15.32 32.82 ̃ D 587,544 0.31 0.43 − 0.58 1.41 Panel B 𝜃PUC1 4280 55.54 13.49 0 100 𝜃GPA1 4280 64.52 11.96 0 100
ES first-year index (ES1) 4280 60.03 11.95 1.49 94.08
𝜃PUC3 4280 55.50 13.75 0 100
𝜃GPA3 4280 61.48 13.21 0 100
ES third-year index (ES3) 4280 58.49 12.85 2.43 92.16 On-time graduation index 4280 42.64 12.89 0 100
For the construction of the confidence intervals of the Eduscopio index we fol-lowed the procedure described in the Eduscopio’s technical report (Bernardi and De Simone 2018), which is also reported in the online Appendix B.
5 Main results
5.1 Step 1 results
Results of the equation (4) for the outcomes described in Section 3.3 are reported in Tables 2, 3 and 4. For each outcome, we provide three specifications. In particular, in the baseline specification (i.e. Model 1) we control only for individual charac-teristics, high school characteristics and academic year of enrollment; whereas in Model 2 we add the university-college major fixed effects, and finally in Model 3 the interaction between high school track and region is included.
Concerning the first-year performance GPA and PUC (see Table 2), we notice that results for the high school final mark, academic year of matriculation and study-ing in a private secondary school are stable across the three models. To be more precise, for each additional year of age at high school graduation the PUC decreases by about 5 percentage points,18 while each additional point in the high school mark
raises the percentage of first-year credits by about 1 percentage point. By contrast, students who obtained the high school diploma from a private school face a penalty in the first-year credits performance of about 11-12 percentage points.19 Foreign
stu-dents earn less credits than their Italian peers, but this gap becomes smaller when HEIs and the college major are controlled for. Females, on average, acquire more credits than males, but after controlling for the Alma Mater and college major this advantage halves (i.e. from 3.7 to 1.6 percentage points). This latter finding reflects gender differences in the choice of field of study, with women less prone to enroll in Science, Technology, Engineering and Mathematics (STEM) degrees, which are generally more academically demanding (see Griffith 2010; Riegle-Crumb et al. 2012; Card and Payne 2017). The PUC obtained during the first university year improves as the distance between the high school and the university increases, in particular for each extra 100 kilometers the percentage of credits increases of 2.2 percentage points (Model 1), but again in the full specification this advantage becomes smaller (0.8 percentage points). This result may capture the higher effort and motivation of individuals who migrate for study purposes or the need to reduce the enrollment costs by increasing the speed of studies. Results for first-year GPA are qualitatively similar. GPA increases when the freshman is female, has a higher high school diploma final mark, graduated in a public secondary school, and is an Italian citizen. Again, controlling for college major and HE institution of enrollment
18 Since the PUC varies between 0 and 1, the regression coefficients must be multiplied by 100 to obtain percentage point changes.
19 This is not surprising in the Italian context in which many private schools are “remedial schools” (Bertola et al. 2007).
Table 2 Step 1. OLS estimations for first-year outcome variables
Robust standard errors in parentheses ∗∗∗ p < 0.01 , ∗∗ p < 0.05 , ∗ p < 0.1
PUC and GPA stand for Percentage of University Credits and Grade Point Average, respectively. Stu-dents in the reference category are male, Italian citizens, come from a public high school, completed upper secondary school with no delay and enrolled in HE in 2009
Variables First academic year
PUC GPA
(1) (2) (3) (4) (5) (6)
Model 1 Model 2 Model 3 Model 1 Model 2 Model 3 Female 0.037∗∗∗ 0.016∗∗∗ 0.016∗∗∗ 0.473∗∗∗ 0.078∗∗∗ 0.079∗∗∗ (0.001) (0.001) (0.001) (0.008) (0.007) (0.007) Foreign student −0.021∗∗∗ −0.013∗∗∗ −0.012∗∗∗ −0.305∗∗∗ −0.133∗∗∗ −0.115∗∗∗ (0.003) (0.003) (0.003) (0.026) (0.024) (0.024) Foreign missing −0.032∗∗∗ −0.022∗∗∗ −0.023∗∗∗ −0.268∗∗∗ −0.219∗∗∗ −0.218∗∗∗ (0.008) (0.008) (0.008) (0.072) (0.067) (0.067) Age −0.047∗∗∗ −0.050∗∗∗ −0.049∗∗∗ −0.028∗∗∗ −0.132∗∗∗ −0.131∗∗∗ (0.001) (0.001) (0.001) (0.008) (0.008) (0.008) High school final mark 0.010∗∗∗ 0.010∗∗∗ 0.010∗∗∗ 0.090∗∗∗ 0.097∗∗∗ 0.098∗∗∗
(0.000) (0.000) (0.000) (0.000) (0.000) (0.000) Private school −0.108∗∗∗ −0.116∗∗∗ −0.117∗∗∗ −0.559∗∗∗ −0.625∗∗∗ −0.636∗∗∗
(0.002) (0.002) (0.002) (0.019) (0.017) (0.017) One year delay 0.014∗∗∗ −0.011∗∗∗ −0.010∗∗∗ 0.511∗∗∗ 0.166∗∗∗ 0.167∗∗∗
(0.002) (0.002) (0.002) (0.013) (0.012) (0.012) Two years delay 0.018∗∗ −0.017∗∗ −0.016∗∗ 0.940∗∗∗ 0.509∗∗∗ 0.506∗∗∗
(0.008) (0.007) (0.007) (0.059) (0.054) (0.054) Linear distance (100 of km) 0.022∗∗∗ 0.008∗∗∗ 0.008∗∗∗ 0.016∗∗ −0.038∗∗∗ −0.034∗∗∗
(0.001) (0.001) (0.001) (0.006) (0.007) (0.007) Linear distance squared (100
of km) −0.002 ∗∗∗ −0.001∗∗∗ −0.001∗∗∗ −0.013∗∗∗ 0.003∗∗∗ 0.002∗∗∗ (0.000) (0.000) (0.000) (0.001) (0.001) (0.001) Enrolled in 2010 0.024∗∗∗ 0.024∗∗∗ 0.024∗∗∗ −0.031∗∗∗ −0.032∗∗∗ −0.032∗∗∗ (0.001) (0.001) (0.001) (0.009) (0.008) (0.008) Enrolled in 2011 0.003∗∗ 0.006∗∗∗ 0.006∗∗∗ −0.093∗∗∗ −0.106∗∗∗ −0.105∗∗∗ (0.001) (0.001) (0.001) (0.009) (0.008) (0.008) Constant 0.786∗∗∗ 0.843∗∗∗ 0.837∗∗∗ 18.667∗∗∗ 18.991∗∗∗ 19.050∗∗∗ (0.019) (0.021) (0.021) (0.165) (0.164) (0.167) Observations 642,214 642,214 642,214 538,701 538,701 538,701 R-squared 0.168 0.243 0.245 0.211 0.351 0.353
High school track FE YES YES YES YES YES YES
Region FE YES YES YES YES YES YES
High school track × Region
FE NO NO YES NO NO YES
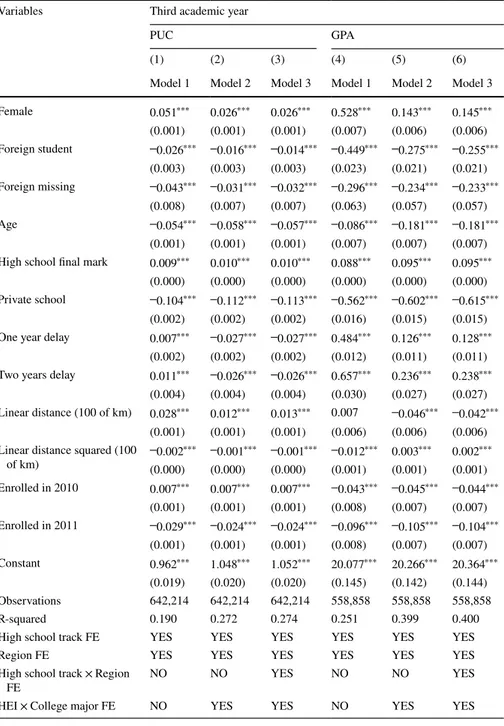
Table 3 Step 1. OLS estimations for third-year outcome variables
Robust standard errors in parentheses ∗∗∗ p < 0.01 , ∗∗ p < 0.05 , ∗ p < 0.1
PUC and GPA stand for Percentage of University Credits and Grade Point Average, respectively. Stu-dents in the reference category are male, Italian citizens, come from a public high school, completed upper secondary school with no delay and enrolled in HE in 2009
Variables Third academic year
PUC GPA
(1) (2) (3) (4) (5) (6)
Model 1 Model 2 Model 3 Model 1 Model 2 Model 3 Female 0.051∗∗∗ 0.026∗∗∗ 0.026∗∗∗ 0.528∗∗∗ 0.143∗∗∗ 0.145∗∗∗ (0.001) (0.001) (0.001) (0.007) (0.006) (0.006) Foreign student −0.026∗∗∗ −0.016∗∗∗ −0.014∗∗∗ −0.449∗∗∗ −0.275∗∗∗ −0.255∗∗∗ (0.003) (0.003) (0.003) (0.023) (0.021) (0.021) Foreign missing −0.043∗∗∗ −0.031∗∗∗ −0.032∗∗∗ −0.296∗∗∗ −0.234∗∗∗ −0.233∗∗∗ (0.008) (0.007) (0.007) (0.063) (0.057) (0.057) Age −0.054∗∗∗ −0.058∗∗∗ −0.057∗∗∗ −0.086∗∗∗ −0.181∗∗∗ −0.181∗∗∗ (0.001) (0.001) (0.001) (0.007) (0.007) (0.007) High school final mark 0.009∗∗∗ 0.010∗∗∗ 0.010∗∗∗ 0.088∗∗∗ 0.095∗∗∗ 0.095∗∗∗
(0.000) (0.000) (0.000) (0.000) (0.000) (0.000) Private school −0.104∗∗∗ −0.112∗∗∗ −0.113∗∗∗ −0.562∗∗∗ −0.602∗∗∗ −0.615∗∗∗
(0.002) (0.002) (0.002) (0.016) (0.015) (0.015) One year delay 0.007∗∗∗ −0.027∗∗∗ −0.027∗∗∗ 0.484∗∗∗ 0.126∗∗∗ 0.128∗∗∗
(0.002) (0.002) (0.002) (0.012) (0.011) (0.011) Two years delay 0.011∗∗∗ −0.026∗∗∗ −0.026∗∗∗ 0.657∗∗∗ 0.236∗∗∗ 0.238∗∗∗
(0.004) (0.004) (0.004) (0.030) (0.027) (0.027) Linear distance (100 of km) 0.028∗∗∗ 0.012∗∗∗ 0.013∗∗∗ 0.007 −0.046∗∗∗ −0.042∗∗∗
(0.001) (0.001) (0.001) (0.006) (0.006) (0.006) Linear distance squared (100
of km) −0.002 ∗∗∗ −0.001∗∗∗ −0.001∗∗∗ −0.012∗∗∗ 0.003∗∗∗ 0.002∗∗∗ (0.000) (0.000) (0.000) (0.001) (0.001) (0.001) Enrolled in 2010 0.007∗∗∗ 0.007∗∗∗ 0.007∗∗∗ −0.043∗∗∗ −0.045∗∗∗ −0.044∗∗∗ (0.001) (0.001) (0.001) (0.008) (0.007) (0.007) Enrolled in 2011 −0.029∗∗∗ −0.024∗∗∗ −0.024∗∗∗ −0.096∗∗∗ −0.105∗∗∗ −0.104∗∗∗ (0.001) (0.001) (0.001) (0.008) (0.007) (0.007) Constant 0.962∗∗∗ 1.048∗∗∗ 1.052∗∗∗ 20.077∗∗∗ 20.266∗∗∗ 20.364∗∗∗ (0.019) (0.020) (0.020) (0.145) (0.142) (0.144) Observations 642,214 642,214 642,214 558,858 558,858 558,858 R-squared 0.190 0.272 0.274 0.251 0.399 0.400
High school track FE YES YES YES YES YES YES
Region FE YES YES YES YES YES YES
High school track × Region
FE NO NO YES NO NO YES
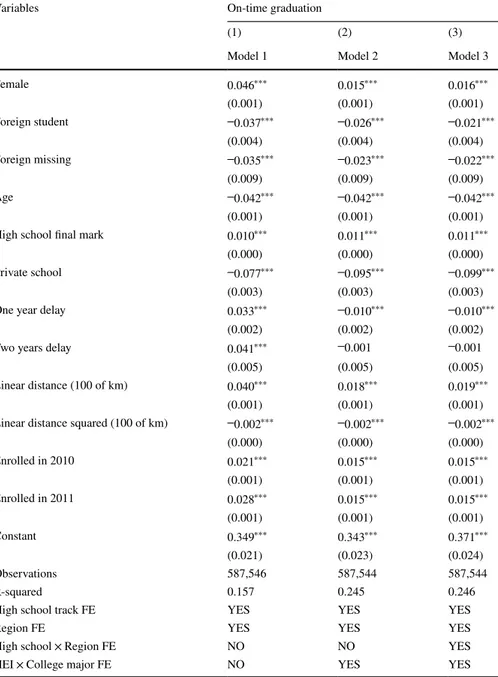
Table 4 Step 1. Linear probability model for on-time graduation
Robust standard errors in parentheses ∗∗∗ p < 0.01 , ∗∗ p < 0.05 , ∗ p < 0.1
Students in the reference category are male, Italian citizens, come from a public high school, completed upper secondary school with no delay and enrolled in HE in 2009
Variables On-time graduation
(1) (2) (3)
Model 1 Model 2 Model 3
Female 0.046∗∗∗ 0.015∗∗∗ 0.016∗∗∗ (0.001) (0.001) (0.001) Foreign student −0.037∗∗∗ −0.026∗∗∗ −0.021∗∗∗ (0.004) (0.004) (0.004) Foreign missing −0.035∗∗∗ −0.023∗∗∗ −0.022∗∗∗ (0.009) (0.009) (0.009) Age −0.042∗∗∗ −0.042∗∗∗ −0.042∗∗∗ (0.001) (0.001) (0.001)
High school final mark 0.010∗∗∗ 0.011∗∗∗ 0.011∗∗∗
(0.000) (0.000) (0.000)
Private school −0.077∗∗∗ −0.095∗∗∗ −0.099∗∗∗
(0.003) (0.003) (0.003)
One year delay 0.033∗∗∗ −0.010∗∗∗ −0.010∗∗∗
(0.002) (0.002) (0.002)
Two years delay 0.041∗∗∗ −0.001 −0.001
(0.005) (0.005) (0.005)
Linear distance (100 of km) 0.040∗∗∗ 0.018∗∗∗ 0.019∗∗∗
(0.001) (0.001) (0.001)
Linear distance squared (100 of km) −0.002∗∗∗ −0.002∗∗∗ −0.002∗∗∗
(0.000) (0.000) (0.000) Enrolled in 2010 0.021∗∗∗ 0.015∗∗∗ 0.015∗∗∗ (0.001) (0.001) (0.001) Enrolled in 2011 0.028∗∗∗ 0.015∗∗∗ 0.015∗∗∗ (0.001) (0.001) (0.001) Constant 0.349∗∗∗ 0.343∗∗∗ 0.371∗∗∗ (0.021) (0.023) (0.024) Observations 587,546 587,544 587,544 R-squared 0.157 0.245 0.246
High school track FE YES YES YES
Region FE YES YES YES
High school × Region FE NO NO YES
(Model 3), we notice that women’s advantage in GPA decreases and is almost 0.08 points, while in the baseline specification, in which these variables are omitted, this advantage is much larger, of about 0.5 points, confirming that women tend to enroll in less demanding fields. High school final mark is a significant predictor of GPA with a 10-point increase in the grade received at the end of secondary edu-cation being associated with about a one point increase in the GPA. Unlike with PUC, studying in a university farther away from the student’s high school of ori-gin reduces the GPA. These results, taken together, suggest that there is a potential trade-off between the quantity of exams that students pass in the first-year and the quality of their careers (measured in terms of GPA), and that students enrolled in a degree program farther from their residence could give more importance to on-time completion of the degree course — in order to reduce enrollment costs — than to average grades. Interestingly, the year of enrollment dummies show a progressive improvement of PUC and deterioration of GPA across cohorts.
To analyze whether the role played by all the variables included in equation (4) is persistent over the student’s academic career, we estimate models with the PUC and GPA measured three years after enrollment. These estimates are reported in Table 3. Results show the same pattern as for the first-year performance and similar levels of statistical significance.
Finally, we run the three specifications on the last outcome, namely on-time graduation.20 Table 4 reports comparable correlations between the covariates and
the outcome as shown for first-year PUC. Chiefly, a one point increase in the high school final mark provides a 1 percentage point advantage in on-time graduation, while attending a private high school entails a reduction in this probability of about 10 percentage points (Model 3). The estimates confirm the positive correlation between distance and the speed of students’ academic careers. Indeed, for every extra 100 kilometers of distance the likelihood of getting the degree within the legal duration increases of about 1.9 percentage points (Model 3). The effect of distance is inverse U-shaped and reaches a maximum at 475 kilometers of distance from the high school attended.
5.2 Step 2 results
The estimates and confidence intervals of the school fixed effects obtained from equation (6) for the outcome variables, namely first- and third-year academic perfor-mance PUC and GPA as well as on-time graduation, are reported in Figures A1, A2 and A3 in the online Appendix A, respectively.
Considering both PUC and GPA for the first-year (Figure A1), we can observe a high heterogeneity in the magnitudes of the FEs. For PUC, the best performing school has a FE of 0.94 and the worst performing school of 0.06. The range of varia-tion is wide also for first-year GPA, with a minimum FE of 20.22 and a maximum of
20 Note that for this set of estimates the sample size is smaller as we do not include students enrolled in Medical studies during the academic year 2010/2011 and 2011/2012 as for them the time span of our administrative data is not long enough to allow them to graduate within the legal duration.
27.07. The majority of high schools in the center of the distribution, however, have academic performances that are statistically indistinguishable (considering the over-lapping confidence intervals).
Once the third-year academic outcomes are plotted (see Figure A2), the high schools’ contributions to each outcome are comparable with the pictures for the first academic year just commented. The range of variation in the FEs for PUC and GPA are 0.05–0.92 and 21.16–27.21, respectively, entailing a difference of GPA of 6 points between the first and the last ranked school.
Finally, with reference to the on-time graduation outcome, a similar pattern for the fixed effects emerges (Figure A3). FEs range from −0.12 and 0.79, which signi-fies that students coming from the best-ranked school are 91 percentage points more likely to graduate on time that those coming from the worst-ranked school.
5.3 Step 3 results
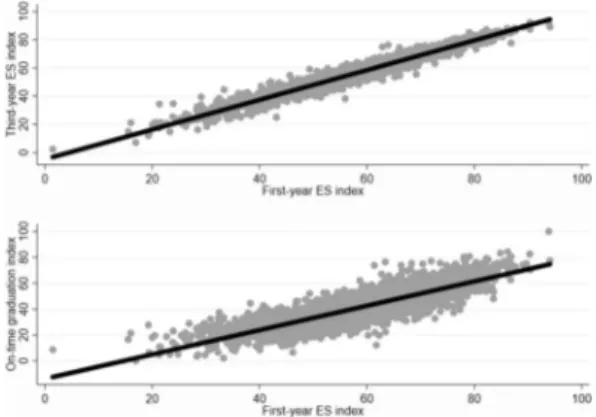
To check the robustness of the ranking to changing the time at which academic performance is measured, we regressed the first-year Eduscopio index on the cor-responding third-year index and on on-time graduation index, respectively. Figure 1
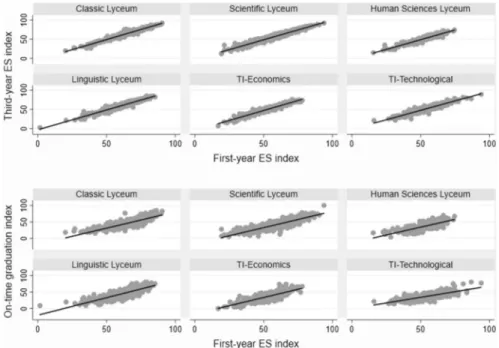
shows that the regression coefficient between the first- and third-year Eduscopio index is very high ( 𝛽 = 1 ), which suggests that the benefits associated to the high school of origin do not disappear over time, but still continue to play a role on the years subsequent to matriculation. Similarly, the regression coefficient between the first-year Eduscopio index and graduation within the legal length index confirms the persistence of the high school effect (Figure 1), as the first-year Eduscopio index is strongly associated with the one relating to the probability of completing the aca-demic studies on time ( 𝛽 = 0.9).21
These patterns are also confirmed when we consider these indicators by school track (Figure 2). The correlation is smaller for Technical Institutes in the Technolog-ical track though, especially when we consider the association between the first-year Eduscopio index and on-time graduation ( 𝛽 = 0.7).
These differences across high school types are likely to be driven by different student drop-out rates (see Table A6 in the online Appendix A). The lower correla-tion for the Technical Institutes in the Technological track matches the high drop-out rates (about 25%) observed for students coming from this type of school. Thus espe-cially for this school track, first-year performance may be a less precise predictor of longer-term academic performance.
In order to further investigate the robustness of the Eduscopio ranking to chang-ing the time horizon of the indicators, in Table A7 (online Appendix A) we report the transition matrix of high schools grouped in deciles. The matrix shows the (absolute number and) percentage of schools changing decile ranking when switching from the
21 As a robustness check, we also estimated the Eduscopio indexes controlling in the first step not only for the high school graduation mark, but for all interactions between high school mark and region of residence, high school track and region, high school track and high school mark and the triple interaction between high school mark, high school track and region. The linear regression coefficient of a regression of the original indexes on those built including this extensive set of controls is practically one.
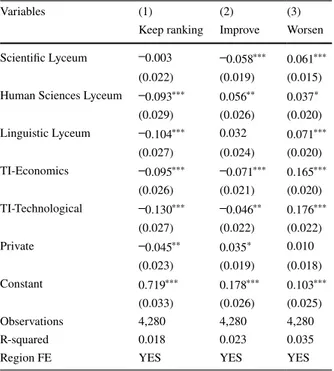
first- to the third-year index. The majority of schools do not change their decile posi-tion at large. Notably, school ranking persistence is higher for the bottom and upper deciles of the distribution. This mimics what we have observed for the FEs, which tend to overlap at the center of the distribution. Then, to describe what school characteristics explain the changing in the ranking deciles, we provide the estimates of the probability of keeping the position (stay on the diagonal of the transition matrix), moving up (move above the diagonal) or down (move below the diagonal) in the decile ranking by con-trolling for the high school track and public/private status (see Table 5).
With reference to the first column, we notice that the probability of remaining in the main diagonal of the transition matrix (i.e. not changing ranking decile) is lower for students that do not come from academic tracks, especially students of TI-Tech-nological schools (13 percentage points), followed immediately by students with a high school diploma awarded by a Linguistic Lyceum or a TI-Economics compared to the reference school track (Classic Lyceum). Conversely, students graduated from a Scientific Lyceum track are not statistically different from those coming from Clas-sic Lyceum. In the second column of Table 5, we analyze a school’s probability of improving its performance between the ranking based on first-year performance and the one based on third-year performance. Results suggest that only students from the Human Sciences Lyceum have a higher probability of improving their ranking, of about 5.6 percentage points, while high school graduates not coming from academic tracks or graduating from the Scientific Lyceum are less likely to improve their posi-tion. About the probability of performing worse in the ranking when increasing the time-span of the academic career considered in the PIs (column 3), we notice that it is higher for all school tracks compared to students from Classic Lyceum, especially
Figure 1 Correlation between first- and third-year Eduscopio index and between on-time graduation and first-year Eduscopio index Upper panel: this figure reports the cross-plot between the first- and the third-year Eduscopio (ES) index, showing a high correlation as the 𝛽 , which refers to the regres-sion coefficient, is 1.05. The equation of the regresregres-sion line is ES3i= −4.78(0.26) + 1.05(0.004) ∗ ES1i
(standard errors in parentheses). Lower panel: this figure reports the cross-plot between the first-year Eduscopio (ES) index and the on-time graduation index, showing a high correlation as the 𝛽 , which refers to the regression coefficient, is 0.94. The equation of the regression line is ON− TIMEGRADUATIONi= −13.80(0.56) + 0.94(0.009) ∗ ES1i (standard errors in parentheses)
for students coming from a non-academic track. To put it in other words, the aca-demic advantage provided by some school tracks tends to accumulate over time.
Since comparisons in Eduscopio should be made across schools within the same track and that are geographically close, Table 5 may not be very informative. For this reason we reported some additional tables and figures for three large Italian cit-ies: Rome, Milan and Naples.
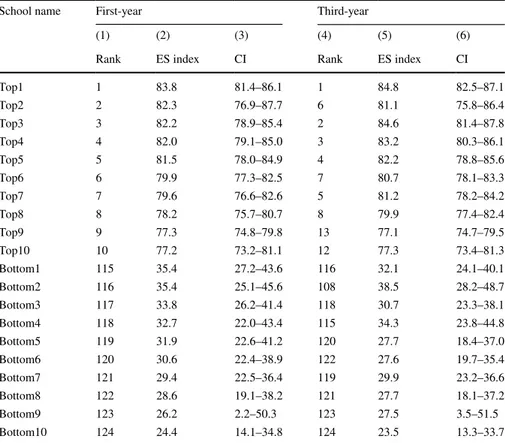
Table 6 reports the first 10 and last 10 academic track schools for the city of Rome listed in decreasing order of the first-year Eduscopio index. The table shows the rank, the value of the index and the corresponding confidence interval (CI) in the columns (1), (2) and (3), respectively. Columns (4), (5) and (6) report the same variables but for the third-year Eduscopio index. A first thing worth noting is that although the CIs of the first (last) 10 schools usually overlap, and therefore many of these schools cannot be ranked in statistical terms, the same is not true when
Figure 2 Correlation between first- and third-year Eduscopio index and between on-time graduation and the first-year Eduscopio index by school type. Note. Upper panel: this figure reports the cross-plot between the first- and the third-year Eduscopio (ES) index by school type. The 𝛽 s, which refer to the regression coefficient, for the different school tracks are: 𝛽(Classic Lyceum)= 1.05(0.01) , 𝛽(Scientific Lyceum)= 1.03(0.01) , 𝛽(Human Sciences Lyceum)= 1.01(0.02) , 𝛽(Linguistic Lyceum)= 1.03(0.01) , 𝛽 (TI-Economics)= 1.04(0.01) and 𝛽(TI-Technological)= 0.98(0.01) (standard errors in parentheses). Lower panel: this figure reports the cross-plot between the first-year Eduscopio (ES) index and the on-time graduation index by school type. The 𝛽 s, which refer to the regression coefficient, for the different school tracks are: 𝛽(Classic Lyceum)= 0.99(0.03) , 𝛽(Scientific Lyceum)= 0.99(0.02) , 𝛽(Human Sciences Lyceum)= 0.95(0.04) , 𝛽(Linguistic Lyceum)= 1.06(0.04) , 𝛽(TI-Economics)= 1.002(0.03) and 𝛽(TI-Tech-nological)= 0.69(0.03) (standard errors in parentheses)
making comparisons between the first 10 and the last 10 schools. Hence, even con-sidering a school track that is supposed to prepare most students for HE, it is pos-sible to observe sharp differences in the first-year university performance of the stu-dents coming from different schools.22 Comparing the change in the rank between
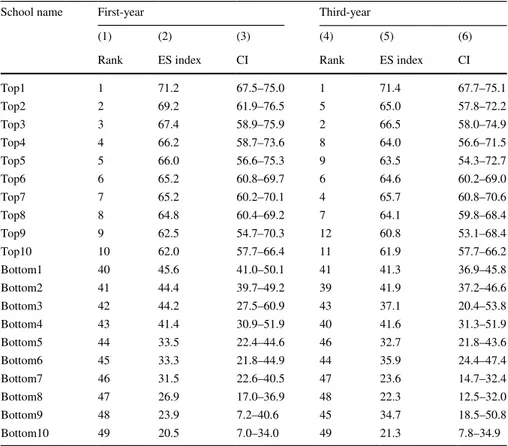
the first- and the third-year Eduscopio index, we see limited shifts in the ordering of schools. Table 7, reporting the results for the Human Sciences and Linguistic tracks, and Table 8, reporting the results for the technical track convey a similar picture. Perhaps, what may appear surprising is that the range of the Eduscopio index seems to be wider for the academic track than for the other two track groups, as shown by the gap in the index values between the schools at the top and at the bottom of the ranking. This may be partly explained by the higher number of Scientific and Classic Lyceum compared to Linguistic, Human Sciences Lyceum and Technical
Table 5 Linear probability model of decile ranking transition matrix
Robust standard errors in parentheses ∗∗∗ p < 0.01 , ∗∗ p < 0.05 , ∗ p < 0.1
Probability to keep the decile ranking (column 1), to improve decile ranking (column 2) or to worsen decile ranking (column 3) in the transition matrix when changing the time-horizon of the Eduscopio index from one to three years. The reference school is a public Clas-sical Lyceum
Variables (1) (2) (3)
Keep ranking Improve Worsen Scientific Lyceum −0.003 −0.058∗∗∗ 0.061∗∗∗
(0.022) (0.019) (0.015)
Human Sciences Lyceum −0.093∗∗∗ 0.056∗∗ 0.037∗
(0.029) (0.026) (0.020) Linguistic Lyceum −0.104∗∗∗ 0.032 0.071∗∗∗ (0.027) (0.024) (0.020) TI-Economics −0.095∗∗∗ −0.071∗∗∗ 0.165∗∗∗ (0.026) (0.021) (0.020) TI-Technological −0.130∗∗∗ −0.046∗∗ 0.176∗∗∗ (0.027) (0.022) (0.022) Private −0.045∗∗ 0.035∗ 0.010 (0.023) (0.019) (0.018) Constant 0.719∗∗∗ 0.178∗∗∗ 0.103∗∗∗ (0.033) (0.026) (0.025) Observations 4,280 4,280 4,280 R-squared 0.018 0.023 0.035
Region FE YES YES YES
22 These differences are not related to the potential differences in the college majors and HEIs chosen by students coming from different schools (and the related differences in grading standards/practices) because they have been accounted for in the first step of the estimation by standardizing the performance measures (Section 4.1).
Institutes, and the larger cohort size supplied by the former, which may generate a greater heterogeneity amongst students coming from these high schools.
These rankings are visualized in Figures 3, 4 and 5 which report the PIs point estimates with CIs by school track for the city of Rome. The same is done for the cities of Milan and Naples, in Figures D1 to D6, respectively (online Appendix D). These figures confirm the larger heterogeneity within the same school track that characterizes the city of Rome compared to Milan and Naples. To put it in other words, the school track of provenience appears to be a less precise predictor of stu-dent performance in Rome compared to Milan and Naples.
The same fact emerges from a simple analysis of variance. In particular, the vari-ance in the Eduscopio index between (within) school tracks is in line with the values observed at national level for the city of Rome, while it is larger (lower) for Milan and Naples (see Table D7 in the online Appendix D).23 Overall, the between-school
Table 6 School ranking: Academic track (Rome)
This table shows the first 10 and last 10 Academic track schools in Rome according to the first-year Eduscopio (ES) index, along with the rank, the value of the index and the confidence interval, in column (1), (2) and (3), respectively. Columns (4), (5) and (6) report the corresponding values for the third-year Eduscopio (ES) index
School name First-year Third-year
(1) (2) (3) (4) (5) (6)
Rank ES index CI Rank ES index CI
Top1 1 83.8 81.4–86.1 1 84.8 82.5–87.1 Top2 2 82.3 76.9–87.7 6 81.1 75.8–86.4 Top3 3 82.2 78.9–85.4 2 84.6 81.4–87.8 Top4 4 82.0 79.1–85.0 3 83.2 80.3–86.1 Top5 5 81.5 78.0–84.9 4 82.2 78.8–85.6 Top6 6 79.9 77.3–82.5 7 80.7 78.1–83.3 Top7 7 79.6 76.6–82.6 5 81.2 78.2–84.2 Top8 8 78.2 75.7–80.7 8 79.9 77.4–82.4 Top9 9 77.3 74.8–79.8 13 77.1 74.7–79.5 Top10 10 77.2 73.2–81.1 12 77.3 73.4–81.3 Bottom1 115 35.4 27.2–43.6 116 32.1 24.1–40.1 Bottom2 116 35.4 25.1–45.6 108 38.5 28.2–48.7 Bottom3 117 33.8 26.2–41.4 118 30.7 23.3–38.1 Bottom4 118 32.7 22.0–43.4 115 34.3 23.8–44.8 Bottom5 119 31.9 22.6–41.2 120 27.7 18.4–37.0 Bottom6 120 30.6 22.4–38.9 122 27.6 19.7–35.4 Bottom7 121 29.4 22.5–36.4 119 29.9 23.2–36.6 Bottom8 122 28.6 19.1–38.2 121 27.7 18.1–37.2 Bottom9 123 26.2 2.2–50.3 123 27.5 3.5–51.5 Bottom10 124 24.4 14.1–34.8 124 23.5 13.3–33.7
23 The decomposition has been made by a simple fixed effects ‘panel’ estimation in which tracks repre-sent the groups and schools the units of observation within groups.
track dispersion in the university performance of students shows some geographic heterogeneity in Italy, albeit secondary education is mainly publicly provided and funded. Although a detailed analysis of these geographical differences is beyond the scope of this paper, it would be interesting to investigate them in future research, especially because they hint on potential differences in school choice (or student selection) and/or differences in school value added even within the same school track across the country. The latter finding is especially worrying in the Italian context in which the intergenerational correlation in educational attainment is very strong and social origin affects both the choice of school track and of a given school within a track.
Table 7 School ranking: Human Sciences and Linguistic track (Rome)
This table shows the first 10 and last 10 Human Sciences and Linguistic track schools in Rome accord-ing to the first-year Eduscopio (ES) index, along with the rank, the value of the index and the confidence interval, in column (1), (2) and (3), respectively. Columns (4), (5) and (6) report the corresponding val-ues for the third-year Eduscopio (ES) index
School name First-year Third-year
(1) (2) (3) (4) (5) (6)
Rank ES index CI Rank ES index CI
Top1 1 71.2 67.5–75.0 1 71.4 67.7–75.1 Top2 2 69.2 61.9–76.5 5 65.0 57.8–72.2 Top3 3 67.4 58.9–75.9 2 66.5 58.0–74.9 Top4 4 66.2 58.7–73.6 8 64.0 56.6–71.5 Top5 5 66.0 56.6–75.3 9 63.5 54.3–72.7 Top6 6 65.2 60.8–69.7 6 64.6 60.2–69.0 Top7 7 65.2 60.2–70.1 4 65.7 60.8–70.6 Top8 8 64.8 60.4–69.2 7 64.1 59.8–68.4 Top9 9 62.5 54.7–70.3 12 60.8 53.1–68.4 Top10 10 62.0 57.7–66.4 11 61.9 57.7–66.2 Bottom1 40 45.6 41.0–50.1 41 41.3 36.9–45.8 Bottom2 41 44.4 39.7–49.2 39 41.9 37.2–46.6 Bottom3 42 44.2 27.5–60.9 43 37.1 20.4–53.8 Bottom4 43 41.4 30.9–51.9 40 41.6 31.3–51.9 Bottom5 44 33.5 22.4–44.6 46 32.7 21.8–43.6 Bottom6 45 33.3 21.8–44.9 44 35.9 24.4–47.4 Bottom7 46 31.5 22.6–40.5 47 23.6 14.7–32.4 Bottom8 47 26.9 17.0–36.9 48 22.3 12.5–32.0 Bottom9 48 23.9 7.2–40.6 45 34.7 18.5–50.8 Bottom10 49 20.5 7.0–34.0 49 21.3 7.8–34.9
6 Concluding remarks
Eduscopio (eduscopio.it) is a web-portal created in 2014 by the Fondazione Gio-vanni Agnelli (FGA) providing high school performance indicators for almost all Italian academic and technical schools. High schools are ranked according to the university performance of the students who enrolled in Italian universities. In par-ticular, the Eduscopio index takes into account the percentage of university cred-its (PUC) and the grade point average (GPA) of students in their first-year after enrollment.
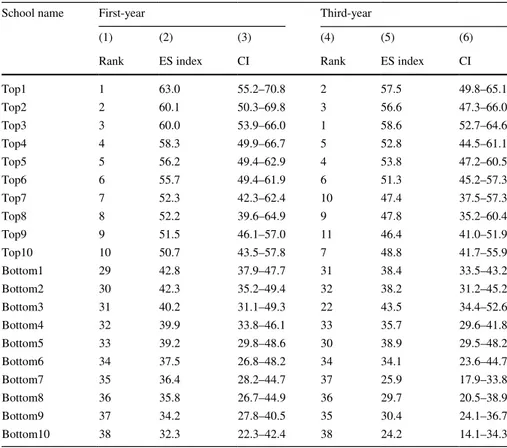
Table 8 School ranking: Technical track (Rome)
This table shows the first 10 and last 10 Technical track schools in Rome according to the first-year Eduscopio index, along with the rank, the value of the index and the confidence interval, in column (1), (2) and (3), respectively. Columns (4), (5) and (6) report the corresponding values for the third-year Eduscopio index
School name First-year Third-year
(1) (2) (3) (4) (5) (6)
Rank ES index CI Rank ES index CI
Top1 1 63.0 55.2–70.8 2 57.5 49.8–65.1 Top2 2 60.1 50.3–69.8 3 56.6 47.3–66.0 Top3 3 60.0 53.9–66.0 1 58.6 52.7–64.6 Top4 4 58.3 49.9–66.7 5 52.8 44.5–61.1 Top5 5 56.2 49.4–62.9 4 53.8 47.2–60.5 Top6 6 55.7 49.4–61.9 6 51.3 45.2–57.3 Top7 7 52.3 42.3–62.4 10 47.4 37.5–57.3 Top8 8 52.2 39.6–64.9 9 47.8 35.2–60.4 Top9 9 51.5 46.1–57.0 11 46.4 41.0–51.9 Top10 10 50.7 43.5–57.8 7 48.8 41.7–55.9 Bottom1 29 42.8 37.9–47.7 31 38.4 33.5–43.2 Bottom2 30 42.3 35.2–49.4 32 38.2 31.2–45.2 Bottom3 31 40.2 31.1–49.3 22 43.5 34.4–52.6 Bottom4 32 39.9 33.8–46.1 33 35.7 29.6–41.8 Bottom5 33 39.2 29.8–48.6 30 38.9 29.5–48.2 Bottom6 34 37.5 26.8–48.2 34 34.1 23.6–44.7 Bottom7 35 36.4 28.2–44.7 37 25.9 17.9–33.8 Bottom8 36 35.8 26.7–44.9 36 29.7 20.5–38.9 Bottom9 37 34.2 27.8–40.5 35 30.4 24.1–36.7 Bottom10 38 32.3 22.3–42.4 38 24.2 14.1–34.3
Given the increasing importance of Eduscopio as a potential source of infor-mation to support Italian students and their families (Vuri 2018) in the choice of the high school, in this paper we extend the methodology used to build the Eduscopio index to encompass longer-term academic outcomes. Indeed, limiting the analysis of student performance to the first-year of enrollment, like Edusco-pio currently does, may not sufficiently penalize those schools whose students are more likely to drop out from university after the first-year. To address this concern, we increase the time-span in which student performance is measured, from the first- to the third-year after student enrollment, and we also build an index based on the probability of on-time graduation. The latter is a meaningful performance indicator given the high percentage of university students who drop out or graduate with significant delays in Italy. In fact, our analysis demonstrates that the correlation between indexes built on first- and third-year academic per-formance is generally high. A similarly high correlation is also observed between the first-year index and the on-time graduation index, especially for school tracks characterized by lower drop out (e.g. the academic tracks). Moreover, from an analysis of the probability of changing the Eduscopio decile ranking position
Figure 3 School ranking by Performance Indicators: Academic track (Rome). Each graph reports the school ranking according to each Performance Indicator, namely, first-year Eduscopio (ES) index, third-year Eduscopio (ES) index and on-time graduation index along with the 95% confidence interval