S P E C I A L I S S U E O N N O V E L P S Y C H O A C T I V E S U B S T A N C E S
Pharmaco
‐toxicological effects of the novel third‐generation
fluorinate synthetic cannabinoids, 5F
‐ADBINACA, AB‐
FUBINACA, and STS
‐135 in mice. In vitro and in vivo studies
Isabella Canazza
1,3|
Andrea Ossato
1,3|
Fabrizio Vincenzi
4|
Adolfo Gregori
5|
Fabiana Di Rosa
5|
Federica Nigro
6|
Alessandro Rimessi
6|
Paolo Pinton
6|
Katia Varani
4|
Pier Andrea Borea
4|
Matteo Marti
1,21
Department of Life Sciences and Biotechnology (SVeB), University of Ferrara, Ferrara, Italy
2
Center for Neuroscience and Istituto Nazionale di Neuroscienze, University of Ferrara, Ferrara, Italy
3
Institute of Public Health, Section of Legal Medicine, Catholic University of Rome, Rome, Italy
4
Department of Medical Sciences, University of Ferrara, Ferrara, Italy
5
Carabinieri, Department of Scientific Investigation (RIS), Rome, Italy 6
Department of Morphology, Surgery and Experimental Medicine, Section of Pathology, Oncology and Experimental Biology, Laboratory for Technologies of Advanced Therapies (LTTA), University of Ferrara, Ferrara, Italy
Correspondence
Matteo Marti, Department of Life Sciences and Biotechnology (SVeB), University of Ferrara via Fossato di Mortara 17‐19, Ferrara 44121, Italy.
Email: [email protected]
Funding information
Drug Policies Department, Presidency of the Council of Ministers, Grant/Award Number:
NS‐Drugs; Università degli Studi di Ferrara,
Grant/Award Number: FAR 2013; Italian
Min-istry of Health, Grant/Award Number: GR‐
2011‐02346964; Italian Cystic Fibrosis
Foun-dation, Grant/Award Number: FFC # 20/2015
Introduction:
5F‐ADBINACA, AB‐FUBINACA, and STS‐135 are 3 novel third‐generation fluorinate synthetic cannabinoids that are illegally marketed as incense, herbal preparations, orresearch chemicals for their psychoactive cannabis‐like effects.
Methods:
The present study aims at investigating the in vitro and in vivo pharmacologicalactivity of 5F‐ADBINACA, AB‐FUBINACA, and STS‐135 in male CD‐1 mice, comparing their
in vivo effects with those caused by the administration ofΔ9
‐THC and JWH‐018. In vitro
compe-tition binding experiments revealed a nanomolar affinity and potency of the 5F‐ADBINACA,
AB‐FUBINACA, and STS‐135 on mouse and human CB1and CB2receptors. Moreover, these
synthetic cannabinoids induced neurotoxicity in murine neuro‐2a cells.
Results:
In vivo studies showed that 5F‐ADBINACA, AB‐FUBINACA, and STS‐135 induced hypothermia; increased pain threshold to both noxious mechanical and thermal stimuli; caused catalepsy; reduced motor activity; impaired sensorimotor responses (visual, acoustic, and tactile); caused seizures, myoclonia, and hyperreflexia; and promoted aggressiveness in mice. Behavioraland neurological effects were fully prevented by the selective CB1receptor antagonist/inverse
agonist AM 251. Differently, the visual sensory response induced by STS‐135 was only partly
prevented by the AM 251, suggesting a CB1‐independent mechanism.
Conclusions:
For the first time, the present study demonstrates the pharmaco‐toxicologicaleffects induced by the administration of 5F‐ADBINACA, AB‐FUBINACA, and STS‐135 in mice
and suggests their possible detrimental effects on human health.
K E Y W O R D S
5F‐ADBINACA, AB‐FUBINACA, human CB1receptor, neurotoxicity, STS‐135, Δ9‐THC
1
|I N T R O D U C T I O N
Since the appearance in 2009 of synthetic cannabinoids (SCBs) as psychotropic drugs (spice and herbal incense; EMCDDA, 2009), there has been a continuous stream of new SCBs; on the one side, they were
aimed to mimic the psychotropic effects ofΔ9
‐tetrahydrocannabinol Isabella Canazza and Andrea Ossato contributed equally to this work.
Abbreviations: 5F‐ADBINACA, (1‐(5‐fluoro‐pentyl)1H‐indole‐3‐carboxylic acid‐
(1‐carbamoyl‐2‐methyl‐propyl)‐amide); AB‐FUBINACA, N‐(1‐amino‐3‐methyl‐
1‐ oxobutan‐2‐yl)‐1‐(4‐fluorobenzyl)‐1H–indazole‐3‐carboxamide; AM 251, 1‐
(2,4‐dichlorophenyl)‐5‐(4‐iodophenyl)‐4‐methyl‐N‐(piperidin‐1‐yl)‐1H–
pyrazole‐3‐carboxamide; JWH‐018, Naphthalen‐1‐yl‐(1‐pentylindol‐3‐yl)
methanone; STS‐135, N‐(Adamantan‐1‐yl)‐1‐(5‐fluoropentyl)‐1H‐indole‐3‐
carboxamide;Δ9
‐THC, (−)‐Δ9
‐THC or Dronabinol®
DOI: 10.1002/hup.2601
Hum Psychopharmacol Clin Exp. 2017;2601. https://doi.org/10.1002/hup.2601
Copyright © 2017 John Wiley & Sons, Ltd.
(Δ9
‐THC); on the other side, they circumvented the law through their novel chemical structure (EMCDDA, 2015).
Among the new SCBs, halogenated derivatives have become increasingly prominent in forensic drug and toxicology specimen anal-ysis (Castaneto et al., 2014). Indeed, halogenation has become an important approach for drug development, both for the steric and lipophilic contributions of halogens and their ability to form stabilizing interactions, such as halogen bonding and multipolar interactions in biomolecular systems (Lu et al., 2012).
In particular, fluorination, which is a fairly old strategy, is still one of the most recently used approaches (together with other function constituents substitution, e.g., adding carboxamide moieties,
as in N‐(1‐amino‐3‐methyl‐1‐ oxobutan‐2‐yl)‐1‐(4‐fluorobenzyl)‐1H‐
indazole‐3‐carboxamide [AB‐FUBINACA] and (1‐(5‐fluoro‐pentyl)
1H‐indole‐3‐carboxylic acid‐(1‐carbamoyl‐2‐methyl‐propyl)‐amide)
[5F‐ADBINACA]) to synthesize new SCBs with greater biological
activ-ity (Banister, Stuart, et al., 2015b; Gurney, Scott, Kacinko, Presley, & Logan, 2014); it determines significant improvements in the affinity
for CB1receptors (Banister, Stuart, et al., 2015b; Nikas et al., 2004;
Wiley, Marusich, & Huffman, 2014) as well as high lipophilicity, which
promotes blood–brain barrier penetration (Schifano, Orsolini, Duccio
Papanti, & Corkery, 2015).
Halogenated compounds promoted toxicity in humans, as
reported for nonhalogenated SCBs (e.g., for naphthalen‐1‐yl‐(1‐
pentylindol‐3‐yl)methanone [JWH‐018; Lapoint et al., 2011], JWH‐
073 [Schneir, Cullen, & Ly, 2011], JWH‐210 [Hermanns‐Clausen,
Kneisel, Szabo, & Auwarter, 2013], and ADB‐PINACA [Schwartz
et al., 2015]). Indeed, several cases shown severe intoxications or
deaths caused by fluorinated compounds such as AM‐2201 (Corazza
et al., 2014; Patton et al., 2013), MAM‐2201 (Saito et al., 2013),
XLR‐11 (Shanks, Winston, Heidingsfelder, & Behonick, 2015), ADB‐
FUBINACA (Shanks, Clark, & Behonick, 2016), and 5F–PB‐22
(Behonick et al., 2014).
In the first part of 2014, the novel fluorinated SCBs, 5F‐
ADBINACA, AB‐FUBINACA, and N‐(adamantan‐1‐yl)‐1‐(5‐
fluoropentyl)‐1H–indole‐3‐carboxamide (STS‐135) have been seized
on the Italian territory by Law Enforcement (Carabinieri, Department of Scientific Investigation; RIS).
5F‐ADBINACA, AB‐FUBINACA, and STS‐135 do not belong to
any of the groups commonly used to classify SCBs: cyclohexylphenol
(such as cannabicyclohexanol and CP‐47497), classical cannabinoids
(such as HU‐210), naphthoylindoles (such as JWH‐018 and JWH‐
073), phenylacetylindoles (such as JWH‐250 and JWH‐203),
benzoylindoles (such as AM‐694 and RCS‐4), and
naphthoylnaphthalenes (such as CB‐13), but they are carboxamide‐
indoles (5F‐ADBINACA; Figure 1a), carboxamide‐indazole
(AB‐FUBINACA; Figure 1b), and adamantylindoles (STS‐135; Figure 1
c). In particular, these SCBs differ from earlier JWH‐type SCBs, having
an amide bridge connecting the indole/indazole structures to an
adamantyl (STS‐135) or carboxamide (AB‐FUBINACA and 5F‐
ADBINACA) group. Furthermore, with the view to increase their
bio-logical activity, a fluorine atom was linked at the 5‐pentyl position both
in STS‐135 and 5F‐ADBINACA or at the para‐benzyl position in AB‐
FUBINACA. This formulation strategy was previously carried out for
AM‐2201, XLR‐11, 5F‐PB‐22, and 5F‐AKB48, the fluorinated
ana-logues of JWH‐018, UR‐144, PB‐22, and AKB48, respectively
(Banister, Stuart, et al., 2015b; Canazza et al., 2016; Gurney et al., 2014).
5F‐ADBINACA is a synthetic cannabinoid showing an indole
core with a 5‐fluoropentyl moiety and a carboxamide‐linked
aminooxobutane group (Figure 1b). Because of its recent identifica-tion, there are no pharmacological and toxicological information on the effects of this substance in animals and humans.
AB‐FUBINACA was originally described in a patent filed by Pfizer
Global Research and Development in 2009, as an alternative analog
based on an indazole‐carboxamide substructure (Buchler et al., 2009).
As recreational drug, AB‐FUBINACA was first detected in Japan in
2012 into herbal products (Uchiyama et al., 2014) and in United States in 2013 (DEA, 2013), where it was scheduled in 2014 (DEA, 2014). It was one of the top three synthetic cannabinoids identified in seizures and toxicological drug screening in Sweden during 2013 and 2014 (Vikingsson, Josefsson, & Green, 2015). Psychonauts reported that
AB‐FUBINACA assumption induces a euphoric state similar to
AM2201, with a marked hallucinogenic and hypnotic action (https://
drugs‐forum.com/forum/showthread.php?t=218821). Hallucinations
are more intense than those caused by cannabis but less than those caused by other synthetic cannabinoids. Mental effects are mild to intermediate, depending on different dosages; however, at very high doses, mental effects are like those caused by stronger cannabinoids
(https://www.erowid.org/experiences/exp.php?ID=105231). Several
hospitalizations following intake of a structurally similar indazole
carboxamide, ADB‐PINACA, have occurred. This combination
pro-duces nausea and vomiting, seizures, somnolence, hyperglycemia, hyperkalemia, tachycardia, myocardial infarction, pneumonia, rhabdo-myolysis, anxiety, delirium, psychosis, and aggressive behaviors (CDCP, 2013; Martinotti et al., 2014; Schwartz et al., 2015). Fatalities and numerous hospitalizations were due to consumption of the methyl
ester of AB‐FUBINACA carboxylic acid, according to the Russian
Federal Drug Control Service (RFDC, 2014). In vitro data show that
this compound is a very potent ligand for CB1receptor, with a constant
binding of 0.9nM and an EC50of 23.2nM for receptor activation as
measured by GTPγS hydrolysis (Thomsen et al., 2015). Preclinical
studies showed that AB‐FUBINACA produces bradycardia and
FIGURE 1 Chemical structures of (a) 5F‐
ADBINACA (1‐(5‐fluoro‐pentyl)1H‐indole‐3‐
carboxylic acid‐(1‐carbamoyl‐2‐methyl‐
propyl)‐amide), (b) AB‐FUBINACA (N‐(1‐
amino‐3‐methyl‐1‐oxobutan‐2‐yl)‐1‐(4‐
fluorobenzyl)‐1H‐indazole‐3‐carboxamide),
and (c) STS‐135 (N‐(Adamantan‐1‐yl)‐1‐(5‐
hypothermia in rats at doses of 0.3–3 mg/kg (Banister, Moir, et al.,
2015a), depressed spontaneous locomotion in ND4 Swiss‐Webster
mice and positively substituted for the discriminative stimulus effects
ofΔ9‐THC in rats (Gatch & Forster, 2015). Moreover, a recently
pub-lished study (Kevin et al., 2017) reports several acute effects (decreased locomotor activity at high and low doses, increased
anxi-ety‐like behaviors and audible vocalizations, and reduced weight gain)
and long‐term effects (object recognition memory deficits) of AB‐
FUBINACA in rats.
STS‐135, also known as 5F‐APICA, is comparable to 5F‐AKB48,
where the core indazole structure is substituted with an indole base.
Previous studies have demonstrated that STS‐135 acts as potent
can-nabinoid receptor agonist in vitro with an EC50of 13 nM for human
CB1receptors and 51 nM for human CB2receptors, producing
brady-cardia and hypothermia in rats at doses of 1–10 mg/kg (Banister,
Stu-art, et al., 2015b). Recently, it has been shown that STS‐135 facilitates
dopamine release in the Shell Nucleus Accumbens of rats (De Luca, Castelli, et al., 2015b), introducing its potential positive role in
reinforc-ing mechanisms, as already mentioned for other SCBs, as well as JWH‐
018 (De Luca, Bimpisidis, et al., 2015a), JWH‐250 and JWH‐073
(Ossato et al., 2016), AKB48, and 5F–AKB48 (Canazza et al., 2016).
The metabolism of AB‐FUBINACA and STS‐135 has been
identi-fied using a hepatocyte model, human liver microsomal incubation, and from human and rat urine samples (Castaneto et al., 2015; Ford
& Berg, 2016; Gandhi et al., 2015; Hsin‐Hung Chen et al., 2016;
Sobolevsky, Prasolov, & Rodchenkov, 2015; Vikingsson et al., 2015). For both SCBs, several metabolites of phases I and II have
been highlighted. In the case of AB‐FUBINACA, the major liver
metab-olites were AB‐FUBINACA carboxylic acid, hydroxy AB‐FUBINACA
carboxylic acid, dihydrodiol AB‐FUBINACA, and dihydrodiol AB‐
FUBINACA carboxylic acid (Castaneto et al., 2015; Vikingsson et al.,
2015). In the case of STS‐135, the major liver metabolites were
monohydroxy STS‐135 and dihydroxy STS‐135, both on the
hydroxylatedadamantane system (Gandhi et al., 2015); on the contrary,
the N‐despentyl (desfluoropentyl) hydroxyadamantyl metabolite was
the most present in the urine of STS‐135 consumers (Sobolevsky
et al., 2015). This evidence should be taken into account: as reported for others SCBs, a large number of metabolites could maintain agonistic
activity at CB1receptors as demonstrated for JWH‐018 and other SCBs
(Brents et al., 2011; Brents et al., 2012).
Despite the presence of these studies, there is poor preclinical
in vivo evidence on the overall pharmaco‐toxicological effects of AB‐
FUBINACA and STS‐135, and there is no information for 5F‐
ADBINACA. Therefore, the current study aims at investigating the
acute effect of 5F‐ADBINACA, AB‐FUBINACA, and STS‐135 (0.01–
6 mg/kg i.p.) on body temperature, acute mechanical and thermal anal-gesia, catalepsy, motor activity, sensorimotor responses (to visual, acoustic, and tactile stimulation), neurological changes (convulsion,
hyperreflexia, and myoclonia), and aggressive response in CD‐1 mice.
To understand the behavioral effects of these drugs better, their actions were monitored for over 5 hr and compared with those of
JWH‐018 and Δ9‐THC. In addition, in vitro binding studies on CD‐1
murine and human CB1/CB2 receptors and neurotoxic studies on
neuro‐2a cells have been performed for a full characterization of these
three novel fluorinated SCBs.
2
|M A T E R I A L S A N D M E T H O D S
2.1
|Animals
Male ICR (CD‐1®) mice, 25–30 gr (Harlan Italy; S. Pietro al Natisone,
Italy), were group‐housed (8–10 mice per cage; floor area per animal
was 80 cm2; minimum enclosure height was 12 cm) in a colony room
under constant temperature (20–22 °C) and humidity (45–55%). Food
(Diet 4RF25 GLP; Mucedola, Settimo Milanese, Milan, Italy) and tap water were available ad libitum all the time the animals spent in their home cages. The daylight cycle was maintained artificially (dark
between 6 pm–6 am). Experiments were performed during the light
phase, and each mouse was used for only one experiment. Experimen-tal protocols performed in the present study were in accordance with the new European Communities Council Directive of September 2010 (2010/63/EU), a revision of the Directive 86/609/EEC, and were
approved by the Italian Ministry of Health (license n. 335/2016‐PR)
and by the Ethics Committee of the University of Ferrara. Moreover, adequate measures were taken to minimize the number of animals used and their pain and discomfort.
2.2
|Drug preparation and dose selection
5F‐ADBINACA (Figure 1a), AB‐FUBINACA (Figure 1b), and STS‐135
(Figure 1c; LGC standards [LGC Standards S.r.L., Sesto San Giovanni,
Milan, Italy] and 1‐(2,4‐dichlorophenyl)‐5‐(4‐iodophenyl)‐4‐methyl‐N‐
(piperidin‐1‐yl)‐1H–pyrazole‐3‐carboxamide [AM 251; Tocris, Bristol,
United Kingdom]) were used. Drugs were initially dissolved in absolute ethanol (final concentration 2%), Tween 80 (2%), and diluted in saline solution (0.9% NaCl) and administrated intraperitoneally at a volume of 4 ul/gr. The solution made of ethanol, Tween 80, and saline was also
used as the vehicle. The CB1 receptor‐preferring antagonist/inverse
agonist AM 251 (6 mg/kg) was administered 20 min before 5F‐
ADBINACA, AB‐FUBINACA, and STS‐135 injections. Doses of 5F‐
ADBINACA, AB‐FUBINACA, and STS‐135 (0.01–6 mg/kg i.p.) were
chosen based on previous studies (Ossato et al., 2015; Ossato et al., 2016; Vigolo et al., 2015).
2.3
|Mouse tissues and cell culture membrane
preparation
After mice were killed by cervical dislocation, brain and spleen were rapidly dissected. The mouse brain was suspended in 50 mM Tris HCl buffer, pH 7.4 at 4 °C, homogenized with a Polytron, and centri-fuged for 20 min at 40,000 × g. The mouse spleen was suspended in 50 mM Tris HCl buffer, pH 7.4 at 4 °C, and, after homogenization by means of a Polytron, the suspension was centrifuged for 10 min at 2,000 × g. The supernatant was then filtered and centrifuged at 40,000 × g for 20 min. Mouse brain and spleen membranes were used for competition binding experiments (Vincenzi et al., 2013). CHO cells
transfected with human CB1or CB2receptors (Perkin Elmer Life and
Analytical Sciences, USA) were cultured in Ham's F12 containing
10% fetal bovine serum, penicillin (100 U/ml), streptomycin
(100 μg/ml), and geneticin (G418, 0.4 mg/ml) at 37 °C in 5%
scraped into ice‐cold hypotonic buffer (5 mM Tris HCl, 2 mM EDTA, and pH 7.4). After homogenization with a Polytron, the suspension
was centrifuged for 30 min at 40,000 × g. For CB1receptors, the
mem-branes were suspended in 50 mM Tris HCl buffer (pH 7.4) containing
2.5 mM EDTA, 5 mM MgCl2, 0.5 mg/ml BSA; whereas for CB2
recep-tors, membranes were suspended in 50 mM Tris HCl (pH 7.4), 1 mM
EDTA, 5 mM MgCl2,and 0.5 mg/ml BSA (Vincenzi et al., 2013).
2.4
|[
3H] CP
‐55,940 competition binding assays and
cyclic AMP assays
Competition binding experiments were carried out incubating various concentrations of the tested compounds in the presence of 0.5 nM
[3H]
‐CP‐55,940 (Vigolo et al., 2015; Vincenzi et al., 2013). Binding experiments were performed in membranes obtained from CHO cells
transfected with human CB1or CB2receptors (2μg protein/100 μl)
as well as in mouse brain membranes (40μg protein/100 μl) for CB1
receptors and in mouse spleen membranes (80μg protein/100 μl) for
CB2receptors. The binding in the presence of 1μM WIN 55,212‐2
was defined as nonspecific binding. Bound and free radioligand was separated by filtration, and the radioactivity was measured in a Packard Tri Carb 2810 TR scintillation counter. Cyclic AMP
experi-ments were performed in CHO cells transfected with human CB1or
CB2receptors. After washing with PBS, cells were detached with
tryp-sin and then centrifuged at 200 × g for 10 min (Vigolo et al., 2015; Vincenzi et al., 2013). Cell pellet was suspended in incubation buffer
composed of 150 mM NaCl, 2.7 mM KCl, 0.37 mM NaH2PO4, 1 mM
MgSO4, 1 mM CaCl2, 5 mM Hepes, 10 mM MgCl2, 5 mM glucose,
and pH 7.4 at 37 °C. The phosphodiesterase inhibitor Ro 20‐1724
(0.5 mM) was added to the cells during a preincubation of 10 min in a shaking bath at 37 °C. The effect of the tested compounds were
evaluated on 1μM forskolin‐stimulated cAMP levels. An ice‐cold 6%
trichloroacetic acid solution was added to disrupt the cells and the final aqueous solution was tested for cyclic AMP levels by a competition protein binding assay.
2.5
|Behavioral studies
The effect of 5F‐ADBINACA, AB‐FUBINACA, and STS‐135 was
inves-tigated using a battery of behavioral tests widely used in studies of “safety‐pharmacology” for preclinical characterization of new mole-cules in rodents (Hamdam et al., 2013; Irwin, 1968; Mattsson, Spencer, & Albee, 1996; Porsolt, Lemaire, Dürmüller, & Roux, 2002; Redfern et al., 2005; S7A, 2001). Those tests have been also validated to
describe effects of cannabinoids on the “tetrad,” sensorimotor, and
neurological changes in mice (Compton, Johnson, Melvin, & Martin, 1992; Ossato et al., 2015; Ossato et al., 2016; Vigolo et al., 2015). To reduce the number of animals used, the behavior of mice was eval-uated in five consecutive experimental sections (for detailed informa-tion, see Data S1). Moreover, in order to reduce stress in animals induced by manipulation, and to confirm the stability and reproducibil-ity over time of the responses of our tests, they were trained 2 times per week for 2 weeks before pharmacological treatment. The behavior of mice (neurologic and sensorimotor responses) was videotaped and
analyzed off‐line by a different trained operator giving test scores.
2.5.1
|Major neurological changes and aggressive
response
As previously described by other studies (Ossato et al., 2015; Ossato et al., 2016; Vigolo et al., 2015), convulsions, hyperreflexia, myoclonus, tail elevation, and aggressive responses in mice were observed imme-diately after SCBs administration. Neurological changes are expressed as frequency (percent of animals that develop symptoms), duration (total time in sec), latency (time in sec of symptom onset), and score (degree of tail elevation and number of bites connected to spontane-ous and stimulated aggressiveness). The tail elevation was measured during the observation of freely moving mice in a square area. The ele-vation of the tail is described through four inclinations: absence eleva-tion (score 0/4); inclinaeleva-tion from 0 to 15 ° (score 1/4) from the ground surface; inclination from 15 to 70 ° (score 2/4); inclination from 70 to 90 ° (score 3/4); or inclination greater than 90 ° (score 4/4). The ani-mal's spontaneous aggressiveness is measured through the number of bites that gives to an object, namely, a gray cloth, that approaches the front of the snout of the animal in an animal's mobility condition. Conversely, in stimulated aggressiveness, the animal is manually restrained and held in a supine position. For both aggressive behavior tests, a gray cloth was placed in front of the mouse nose for 10 consec-utive times (score 0/10, not aggressive; score 10/10, very aggressive).
2.5.2
|Sensorimotor studies
We studied the voluntary and involuntary sensorimotor responses resulting from different mouse reaction to visual, acoustic, and tactile stimuli (Koch, 1999; Ossato et al., 2015).
Evaluation of the visual response
Mouse visual response was verified by two behavioral tests that eval-uated the ability of the animals to capture visual information even when the animal is moving (the visual placing response) or when it is stationary (the visual object response). The first one test is performed using a tail suspension modified apparatus able to bring down the mouse towards the floor at a constant speed of 10 cm/sec (Ossato et al., 2015). A camera videotaped the downward movement of the mouse. The analysis frame by frame allows to evaluate the beginning of the reaction of the mouse while it is close to the floor. When the mouse begins to react, an electronic ruler evaluates the perpendicular distance, in millimeters between the eyes of the mice and the floor. The mice untreated control perceives the floor and it prepares to con-tact at a distance of about 27 ± 4.5 mm. Evaluation of the visual placing response was measured at 0, 15, 35, 70, 125, 185, 245, and 305 min postinjection. Visual object response test was used to evaluate the ability of the mouse to see an object approaching from the front or the side (Ossato et al., 2015). For the frontal visual response, a white horizontal bar was moved frontally to the mouse head for 3 times. For the lateral visual response, a dental mirror was moved in the field of animal, following a horizontal arc from behind to front the mouse's eyes. The procedure was conducted bilaterally and repeated 3 times. The score assigned was a value of 1 if there was a reflection in the mouse movement or 0 if not. The total value was calculated by adding the scores obtained in the frontal visual object response with that obtained in the lateral one (overall score, 9). Evaluation of the visual
object response was measured at 0, 10, 30, 60, 120, 180, 240, and 300 min postinjection.
Evaluation of acoustic response
The perception of sounds by the animal was measured by the acoustic response test who values the reflex of the mouse in replay to an acoustic stimulus produced behind it (Koch, 1999). In particular, four acoustic stimuli of different intensity and frequency were tested (see Ossato et al., 2015). Each sound test was repeated 3 times, giving a value of 1 if there was a response, 0 if not present, for a total score of 3 for each sound. The acoustic total score was calculated by adding scores obtained in the four tests (overall score, 12). Evaluation of the acoustic response was measured at 0, 10, 30, 60, 120, 180, 240, and 300 min postinjection.
Evaluation of tactile response
The tactile response was verified through vibrissae, pinna, and corneal reflexes (for a more comprehensive description, see Ossato et al., 2015; Canazza et al., 2016). Each tactile response were measured at 0, 10, 30, 60, 120, 180, and 240 min postinjection.
2.5.3
|Tetrad paradigm for screening cannabinoid
‐like
effect
Evaluation of core and surface body temperature
To better assess the effects of the ligands on thermoregulation, we measured both changes in the core (rectal) and surface (ventral fur) temperature. As previously reported, the core temperature was assessed with a rectal probe connected to digital thermometer (Cole Parmer, model 8402) whereas the surface temperature was measured by a Microlife FR 1DZ1 digital infrared thermometer (Canazza et al., 2016; Vigolo et al., 2015). Core and surface mouse body temperatures were measured at 0, 30, 50, 85, 140, 200, 260, and 320 min postinjection.
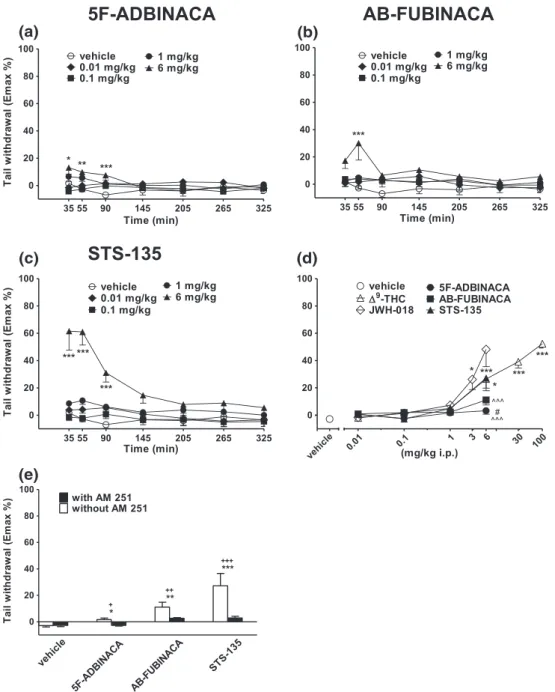
Evaluation of pain induced by a mechanical and thermal stimuli
Acute mechanical nociception was evaluated using the tail pinch test (Vigolo et al., 2015). Pinch pressure was applied to the third of the tail extending from the root via a special rigid probe connected to a digital
dynamometer (ZP‐50 N, IMADA, Japan). Mice did not vocalize during
the application of tail‐pinch pressure, and when the mouse flicked its
tail, the pressure was stopped and the digital instrument saved the maximum peak of weight supported (g/force). A cutoff (500 g/force) was set to avoid tissue damage. The test was repeated 3 times, and the final value was calculated with the average of 3 obtained scores. Acute thermal nociception was evaluated using the tail withdrawal test (Vigolo et al., 2015). The mouse was restrained in a dark plastic cylinder, and half of its tail was dipped in water of 48 °C and the withdrawal response to the hot stimulus was recorded as the latency
(in seconds) of tail flicking in mechanical nociception tests lasting 15‐s
maximum each. The maximum heat exposure time was 15 s to pre-vent tissue damage. The test was repeated 3 times, and the final value was calculated with the average of 3 obtained scores. At the
end of each swimming session, the animal was removed from the cyl-inder and its tail was dried with paper towels. Acute mechanical and thermal nociception was measured at 0, 35, 55, 90, 145, 205, 265, and 325 min post injection.
Motor activity assessment
Motor activity alterations induced by 5F‐ADBINACA, AB‐FUBINACA,
and STS‐135 were measured using the bar, drag, accelerod tests, and
the analysis of spontaneous locomotor activity (Marti, Mela, Guerrini, Calò, & Bianchi, 2004; Marti et al., 2005; Ossato et al., 2015; Vigolo et al., 2015). In the bar test, each animal's forelimbs were placed on a bar made of plastic (height 6 cm). The time spent on the bar was mea-sured (immobility cut off, 20 s) and the akinesia was calculated as total time spent on the bar after three consecutive trials (total maximal time of catalepsy, 60 s). The bar test was performed at 0, 20, 40, 75, 130, 190, 250, and 310 min postinjection. In the drag test, the mouse was lifted by the tail, leaving the front paws on the table and dragged back-ward at a constant speed of about 20 cm/s for a fixed distance (100 cm). The number of steps made by each forepaw was counted by two separate observers. For each animal, five to seven measure-ments were collected. The drag test was performed at 0, 45, 70, 105, 160, 220, 280, and 340 min postinjection. In the accelerod test, animals were placed on a rotating cylinder that automatically and
con-stantly (0–60 rotations/min in 5 min) increased velocity. The time
spent on the cylinder was measured. The accelerod test was per-formed at 0, 40, 60, 95, 150, 210, 270, and 330 min postinjection. Spontaneous locomotor activity: in the open field test, the mice were
placed in a square plastic cage (60 X 60 cm) located in a sound‐ and
light‐attenuated room. During the following 240 min, distance
trav-elled (meter) and immobility time (second; the animal is considered immobile when 95% of his image remains in the same place for at
least 2 s) were recorded and analyzed with a video‐tracking system
(Ugo Basile, application version 4.99 g Beta). Four mice were moni-tored at the same time in each experiment. The distance covered and the time of immobility were analyzed every 15 min for a maxi-mum of 240 min. At the end of the experiment, fecal boli were removed and the floor was wiped clean with ethanol solution (5%) and washed with water.
2.6
|Neurotoxicity assay: mitochondrial membrane
potential measurement
Neuro‐2a cells, which endogenously express cannabinoid type 1 (CB1)
receptors (Graham et al., 2006; He et al., 2005), were grown in DMEM supplemented with 10% FBS, 2 mM glutamine, 100 U/ml
penicillin, and 10 μg/ml streptomycin, in a 5% CO2 incubator at
37 °C. The cells were seeded in 6‐well plates at a density of
150,000 cells. After 48 hr, the cells were loaded with 10 nM tetramethylrhodamine methyl ester (TMRM; Life Technologies), placed in a humidified chamber at 37 °C, and imaged every 1 min for 1 hr of treatment with a LiveScan Swept Field Confocal Micro-scope (Nikon Instruments Inc.) equipped with a 40× oil immersion lens. TMRM fluorescence was analyzed using the NIS Elements soft-ware package (Nikon Instruments Inc.), and depolarization rates were
defined as the slopes of the fluorescence trace over a poststimulation
period, followed by 10μM carbonylcyanide‐3‐chlorophenylhydrazone
(CCCP) treatment to collapse theΔΨ.
2.7
|Data and statistical analysis
Protein concentrations were determined according to a Bio‐Rad
method with bovine serum albumin as reference standard. Inhibitory
binding constants (Ki) were calculated from the IC50values according
to the Cheng and Prusoff equation: Ki = IC50/(1 + [C*]/KD*), where
[C*] is the concentration of the radioligand and KD* its dissociation
constant. Functional experiments were analyzed by nonlinear
regres-sion analysis using the equation for a sigmoid concentration‐response
curve using Prism (GraphPad Prism, USA). Effects of SCBs on
mito-chondrial membrane potential (ΔΨ) was expressed in histogram as Δ
fluorescence intensity before and after the compound administration. All data are expressed as the mean ± SEM of 3 independent
experi-ments. Statistical analysis was performed with one‐way ANOVA
followed by Tukey's test for multiple comparisons. Core and surface temperature values are expressed as the difference between control temperature (before injection) and temperature following drug
admin-istration (Δ °C). Antinociception (tail withdrawal and tail pinch tests)
and catalepsy (bar test) are calculated as percent of maximal possible
effect {EMax% = [(test− control latency)/(cut off time − control)] × 100}.
Data are expressed in absolute values (seconds in neurological changes and immobility time, meter for distance travelled, and meter per sec-ond for calculation of maximum speed and number of bites in the
aggressive response test),Δ °C (core and surface temperature), Emax%
(tail withdrawal, tail pinch, and bar test), and percentage of basal (drag test and accelerod test). In sensorimotor response experiments, data are expressed in arbitrary units (visual objects response, acoustic response, vibrissae, corneal, and pinna reflex) and percentage of base-line (visual placing response). All the numerical data are given as mean ± SEM of four independent experimental replications. Data were analyzed by utilizing repeated measures ANOVA. Results from treat-ments showing significant overall changes were subjected to post hoc Tukey's for multiple comparison at p < .05. The statistical analysis of the effects of the individual substances in different concentrations over time and that of antagonism studies in histograms were
per-formed by two‐way ANOVA followed by Bonferroni's test for multiple
comparisons. The analysis of the total average effect induced by
treat-ments (expressed in panel d) was performed with one‐way ANOVA
followed by Tukey's test for multiple comparisons. The Student's t test was used to determine statistical significance (p < .05) between two
groups (see neurological changes). The statistical analysis was per-formed with the program Prism software (GraphPad Prism, USA).
3
|R E S U L T S
3.1
|Affinity and potency of 5F
‐ADBINACA, AB‐
FUBINACA, and STS
‐135 for CB
1and CB
2cannabinoid
receptors
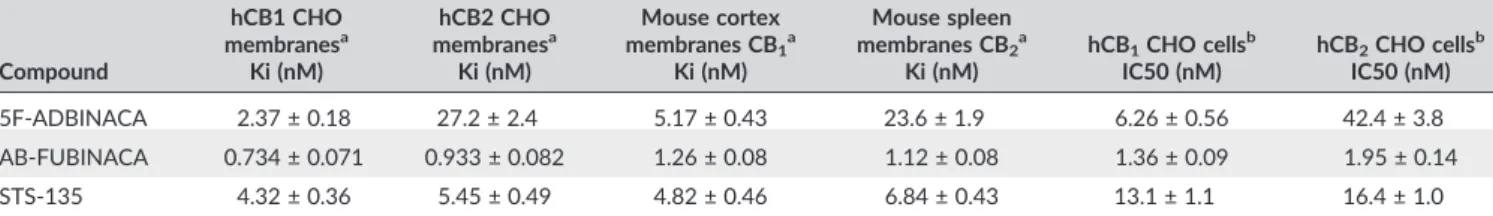
Competition binding experiments carried out in human CB1 (Figure
S1A) or CB2(Figure S1B) CHO cell membranes showed a good affinity
of the examined compounds. AB‐FUBINACA exhibited the highest
affinity on human CB1receptors with a selectivity index (ratio between
the Ki value to human CB2and the Ki value to human CB1) of 1.3
(Table 1). The selectivity index for 5F‐ADBINACA was 11.5, whereas
STS‐135 showed a similar affinity for CB1and CB2receptors
(selectiv-ity index = 1.3). The rank order of affin(selectiv-ity for human CB1receptor was
AB‐FUBINACA > 5F‐ADBINACA > STS‐135. Similar results were
observed in competition binding experiments performed in mouse
brain membranes (for CB1receptors, Figure S1C) and in mouse spleen
membranes (for CB2receptors, Figure S1D).
Cyclic AMP (cAMP) experiments were carried out to investigate the potency of the tested compounds in CHO cells transfected with
human CB1(Figure S1E) or CB2(Figure S1F) receptors. The rank order
of potency was the same obtained for the affinity either on human
CB1or human CB2 receptors. In particular, AB‐FUBINACA was the
most potent compound on human CB1 and CB2 receptors with
potency values of 1.36 ± 0.09 nM and 1.95 ± 0.14 nM, respectively (Table 1). All the examined compounds were able to completely
inhibit the forskolin‐stimulated cAMP production, as full agonists
(Figure S1E,F).
3.2
|Major neurological changes
Significant neurological alterations were observed in mice following
systemic administration of 5F‐ADBINACA, AB‐FUBINACA, and STS‐
135 (0.01–6 mg/kg i.p.) but not in vehicle mice (Table 2). In particular,
administration of high dose (6 mg/kg, i.p.) of AB‐FUBINACA and STS‐
135 induced spontaneous convulsions, hyperreflexia, and myoclonias in mice: those effects were not observed after the administration of
5F‐ADBINACA and Δ9‐THC (Table 2). STS‐135 and AB‐FUBINACA
induced convulsions in 75% and 60% of treated animals, respectively.
STS‐135 and AB‐FUBINACA promoted seizures with similar latency
TABLE 1 Binding and functional parameters of 5F‐ADBINACA, AB‐FUBINACA, and STS‐135 to human and mouse CB1and CB2receptors
Compound hCB1 CHO membranesa Ki (nM) hCB2 CHO membranesa Ki (nM) Mouse cortex membranes CB1a Ki (nM) Mouse spleen membranes CB2a Ki (nM) hCB1CHO cellsb IC50 (nM) hCB2CHO cellsb IC50 (nM) 5F‐ADBINACA 2.37 ± 0.18 27.2 ± 2.4 5.17 ± 0.43 23.6 ± 1.9 6.26 ± 0.56 42.4 ± 3.8 AB‐FUBINACA 0.734 ± 0.071 0.933 ± 0.082 1.26 ± 0.08 1.12 ± 0.08 1.36 ± 0.09 1.95 ± 0.14 STS‐135 4.32 ± 0.36 5.45 ± 0.49 4.82 ± 0.46 6.84 ± 0.43 13.1 ± 1.1 16.4 ± 1.0
Note. Data are expressed as mean ± SEM.
a[3H]‐CP‐55,940 competition binding experiments.
TABLE 2 Effects of the syste mic admin istrat ion of Δ 9‐THC (0.01 – 100 mg/k g), JW H ‐018 , 5 F‐ ADBINACA , A B ‐FUBINAC A, and STS ‐135 (0.01 – 6 mg/k g i.p.), on the neurolo gica l cha nges of the mouse Compound Veh icle Δ 9‐THC a JW H ‐018 a 5F ‐ADBINACA AB ‐FUBINACA STS ‐135 Doses (mg/kg) 0.01 0.1 1 6 30 100 0.01 0.1 1 6 0.01 0.1 1 6 0.01 0.1 1 6 0.01 0.1 1 6 Elevation tail Frequency (%) –– – – – 10 65 –– 10 80 –– – 5 –– 55 0 –– 20 75 Score –– – – – 0.6 ± 0.76 1.1 ± 0.8 –– 0.5 ± 0.41 2.4 ± 0.33 –– – 0.4 ± 0.22* * –– 0.4 ± 0.35 1.4 ± 0.3 –– 2.6 ± 0.4** 2.8 ± 0.6 Duration (sec) –– – – – 654.7 ± 82.9 934.7 ± 88.2 –– 412.6 ± 132.9 1766. 6 ± 189.7 –– – 422 ± 101.5*** –– 410 ± 102 542 ± 95* * –– 1000 ± 208 * 2250 ± 367 Latency (sec) –– – – – 112.5 ± 33.9 103.6 ± 17.4 –– 92.5 ± 17.1 88.6 ± 13.4 –– – 100.7 ± 1 5 –– 125 ± 2 0 185.5 ± 20** –– 110 .6 ± 2 0 98.2 ± 1 5 Hyperrilexia Frequency (%) –– – – – – – – – – 80 –– – – – – – 60 –– 20 75 Duration (sec) –– – – – – – – – – 1439.8 ± 45.3 –– – – – – – 101 0 ± 197.5 –– 963 ± 108 1896. 7 ± 228 Latency (sec) –– – – – – – – – – 93.5 ± 21.2 –– – – – – – 193 ± 4 1 –– 209 ± 8 2 162 ± 5 5 Myoclonie Frequency (%) –– – – – – – – – – 80 –– – – – – – 60 –– 50 80 Duration (sec) –– – – – – – – – – 669.7 ± 36.6 –– – – – – – 1552.3 ± 307 * –– 1103 ± 218 3163 ± 459*** Latency (sec) –– – – – – – – – – 109.7 ± 16.35 –– – – – – – 215 ± 48.2 –– 254 ± 4 1 195 ± 2 2 Convulsion Frequency (%) –– – – – – – – – – 70 –– – – – – – 60 –– – 75 Duration (sec) –– – – – – – – – – 369.7 ± 32.2 –– – – – – – 821 ± 198 –– – 2234 ± 502*** Latency (sec) –– – – – – – – – – 109.7 ± 16.3 –– – – – – – 220 ± 7 1 –– – 211.2 ± 7 5 Spontaneous aggressiveness Frequency (%) –– – – – – – – – – 90 –– – – – – – – – – – – Score (n° of bites ) –– – – – – – – – – 8.2 ± 3.1 –– – – – – – – – – – – Duration (sec) –– – – – – – – – – 275 0 ± 621 –– – – – – – – – – – – Stimulated aggressiveness Frequency (%) –– – – – – – – – – 100 –– – 15 –– 70 90 –– 50 100 Score (n° of bites ) –– – – – – – – – – 9±1 –– – 3 ± 0.5*** –– 2.5 ± 2 2.9 ± 0.5** * –– 2.1 ± 1 5 ± 1** Duration (sec) –– – – – – – – – – 158 32 ± 307 –– – 812 ± 257*** –– 3587 ± 823 4294.7 ± 931*** –– 2620 ± 476 7354 ± 753*** Note . Data are expressed as percentage (frequency of animal with neurological signs), seconds (duration and latency of neurological signs), and score (n umber of bites), represent the mean ± SEM of 10 animals for each treatment. Statistical analysis was performed with one ‐way ANOVA followed by Tukey's test for multiple comparisons and Student's t test was used to determine statistical significance (p < 0.05) between two groups. *p < 0.05. ** p < 0.01. *** p < 0.001 versus JWH ‐018 at the same dosage. aFrom Vigolo et al., 2015 bFrom Ossato et al., 2016
(F2,29 = 1.031, p = 0.3702) but longer duration (F2,29 = 9.711,
p = 0.0007) to those produced by JWH‐018 (Table 2).
STS‐135 administered at 1 and 6 mg/kg induced hyperreflexia in
20% and 75% of treated animals, whereas AB‐FUBINACA at 6 mg/kg
caused hyperreflexia in 60% of mice (Table 2). STS‐135 and AB‐
FUBINACA provoked hyperreflexia with latency (F2,29 = 1.508,
p = 0.2393) and duration (F2,29= 3.340, p = 0.1255) similar to those
produced by JWH‐018. STS‐135 administered at 1 and 6 mg/kg
caused myoclonias in 80% and 50% of treated mice, respectively,
whereas AB‐FUBINACA at 6 mg/kg induced myoclonias in 60% of
treated animals (Table 2). STS‐135 and AB‐FUBINACA at 6 mg/kg
caused myoclonias with same latency (F2,29= 3.052, p = 0.0639) but
longer duration (F2,29 = 15.66, p < 0.0001) than those produced by
JWH‐018. STS‐135, AB‐FUBINACA, and JWH‐018 administered at 1
and 6 mg/kg induced tail elevation in mice, whereas 5F‐ADBINACA
was effective only at 6 mg/kg. STS‐135 at 1 mg/kg promoted tail
ele-vation with grater score (F2,29 = 10.28, p = 0.0005), duration
(F2,29 = 4.859, p = 0.0158), but with comparable latency
(F2,29 = 0.7283, p = 0.4920) than those produced by JWH‐018 and
AB‐FUBINACA (Table 2). Finally, 5F‐ADBINACA, AB‐FUBINACA, and
STS‐135 promoted stimulated aggressiveness in mice, whereas
spon-taneous episodes did not appear. In particular, STS‐135 and AB‐
FUBINACA caused stimulated aggressiveness at 1 and 6 mg/kg,
whereas 5F‐ADBINACA was effective only at 6 mg/kg. 5F–
ADBINACA, AB‐FUBINACA, and STS‐135 at 6 mg/kg induced
stimu-lated aggressiveness with less duration (F3,39= 103.5, p < .0001) and
score (F3,39 = 13.02, p < .0001) than JWH‐018. All neurological
changes were prevented by pretreatment with the selective CB1
receptor antagonist AM 251 (6 mg/kg, i.p. injected 20 min before of
the 5F‐ADBINACA, AB‐FUBINACA, and STS‐135 administration; data
not shown).
3.3
|Sensorimotor studies
3.3.1
|Evaluation of the visual object response
Visual object response tended to be reduced in vehicle‐treated mice
over 5 hr observation (~23% of reduction at 300 min; Figure 2a–c,f),
and the effect was similar to that observed in naïve untreated animals
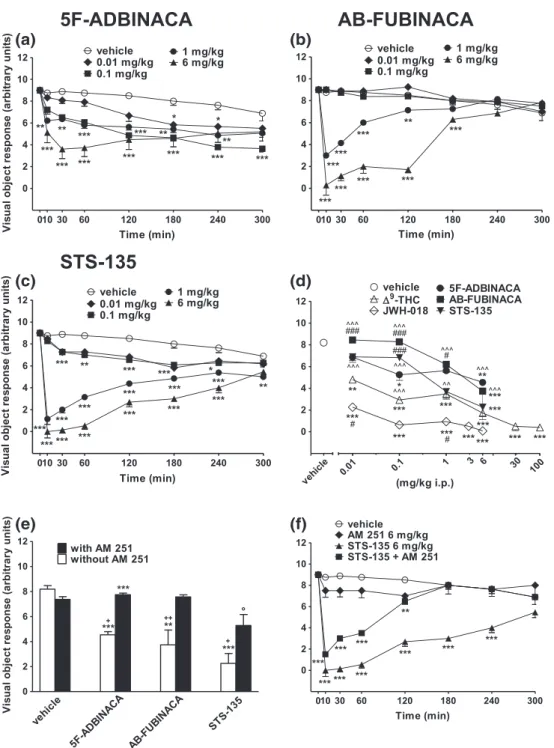
(data not shown). Systemic administration of 5F‐ADBINACA
(0.01–6 mg/kg i.p.) dose dependently reduced the visual object
response in mice and the effect persisted up to 5 hr (Figure 2a:
significant effect of treatment, F4,280 = 56.14, p < .0001; time
F7,280 = 32.16, p < .0001; and time x treatment interaction,
F28,280 = 3.306, p < .0001). AB‐FUBINACA (0.01–6 mg/kg i.p.)
transiently reduced the visual object response in mice only at higher doses tested (1 and 6 mg/kg i.p.), and the effect persisted up to 180 min only for the dose of 6 mg/kg (Figure 2b: significant effect of
treatment, F4,280= 286.3, p < .0001; time, F7,280= 48.43, p < .0001;
and time x treatment interaction, F28,280= 37.74, p < .0001). Similarly,
STS‐135 (0.01–6 mg/kg i.p.) long lasting inhibited the visual object
response, and its effect was more deep than those caused by others
SCBs considered (Figure 2c: significant effect of treatment,
F4,280= 508.8, p < .0001; time, F7,280= 105.2, p < .0001; and time x
treatment interaction, F28,280= 34.74, p < .0001). The inhibition of
visual object response induced by the highest dose of 5F‐ADBINACA
(6 mg/kg), and AB‐FUBINACA (6 mg/kg) was fully prevented by the
pretreatment with AM 251 (6 mg/kg i.p.; Figure 2e: significant effect
of treatment, F3,56= 13.60, p < .0001; time, F1,56= 26.59, p < .0001;
and time x treatment interaction, F3,56= 5.586, p = 0.0020).
Surpris-ingly, AM 251 (6 mg/kg i.p.) partially prevented the effect induced by
STS‐135 at 6 mg/kg (Figure 2f: significant effect of treatment,
F3,224= 240.6, p < .0001; time, F7,224= 46.15, p < .0001; and time x
treatment interaction, F21,224 = 16.70, p < .0001). Conversely, AM
251 (1 mg/kg i.p.) totally prevented the inhibition of the visual object
response induced by administration of STS‐135 at 1 mg/kg (Figure
S2A: significant effect of treatment, F3,224= 179.6, p < .0001; time,
F7,224 = 17.61, p < .0001; and time x treatment interaction,
F21,224= 9.838, p < .0001). The administration of AM 251 (1–6 mg/kg
i.p.) did not alter the visual object response in mice. 5F‐ADBINACA,
AB‐FUBINACA, and STS‐135 inhibited the visual placing response in
a prolonged manner although the effect appeared to be lower with
respect to those induced by JWH‐018 and Δ9
‐THC at the same doses.
Conversely, in the case of STS‐135 (1 and 6 mg/kg), the effects were
similar to those induced by Δ9
‐THC (Figure 2d; F23,191 = 35.81,
p < .0001).
3.3.2
|Evaluation of the acoustic response
Acoustic response tended to be reduced in vehicle‐treated mice over
5 hr observation (~13% of reduction at 300 min; Figure 3a–c), and
the effect was similar in naïve untreated animals (data not shown).
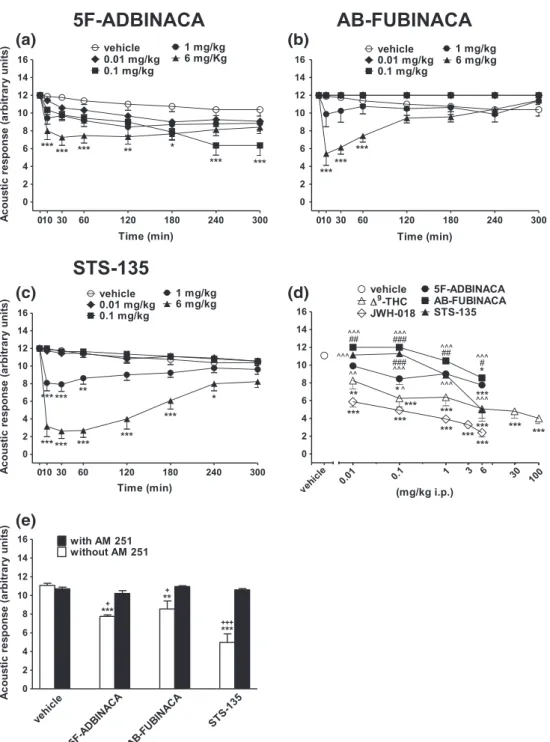
Sys-temic administration of 5F‐ADBINACA (6 mg/kg i.p.) transiently
reduced the acoustic response in mice, and the effect was evident up
to 180 min after drug injection. Interestingly, that 5F‐ADBINACA
inhibited acoustic response also at 0.1 mg/kg, although the effect appeared at the end of observation (Figure 3a: significant effect of
treatment, F4,280= 22.70, p < .0001; time, F7,280= 14.40, p < .0001;
and time x treatment interaction, F28,280= 1.502, p = 0.0541). Also
AB‐FUBINACA (6 mg/kg i.p.) inhibited the acoustic response, and its
effect was prompt but shorter (up to 60 min) compared to that caused
by 5F‐ADBINACA administration (Figure 3b: significant effect of
treat-ment, F4,280= 39.88, p < .0001; time, F7,280= 4.988, p < .0001; and
time x treatment interaction, F28,280 = 4.205, p < .0001). Systemic
administration of STS‐135 (0.01–6 mg/kg i.p.) reduced the acoustic
response in mice in a dose dependent manner. The onset of the effect
at 1–6 mg/kg was deeper compared to those induced by other SCBs
(Figure 3c: significant effect of treatment, F4,280= 145.1, p < .0001;
time, F7,280 = 14.63, p < .0001; and time x treatment interaction,
F28,280= 7.596, p < .0001). The inhibition of acoustic response induced
by 5F‐ADBINACA, AB‐FUBINACA, and STS‐135 (6 mg/kg) was
prevented by the pretreatment with AM 251 (6 mg/kg i.p.; Figure 3e:
significant effect of treatment, F3,56 = 15.03, p < .0001; time,
F1,56 = 56.88, p < .0001; and time x treatment interaction,
F3,56 = 13.30, p < .0001), which alone did not alter the acoustic
response in mice (data not shown). The inhibitory effect caused by
5F‐ADBINACA and AB‐FUBINACA appeared to be less potent than
those evoked by JWH‐018 and Δ9‐THC administration. Conversely,
the administration of STS‐135 at 6 mg/kg induced an effect similar
to that caused byΔ9‐THC administration at the same dose (Figure 3
3.3.3
|Evaluation of tactile response
Vibrissae reflex did not change in vehicle‐treated mice over 5 hr
obser-vation (Figure S3A–C), and the response was similar to that observed in
naïve untreated animals (data not shown). Systemic administration of
5F‐ADBINACA, AB‐FUBINACA, and STS‐135 did not alter the vibrissae
reflex (Figure S3A: significant effect of treatment, F4,280 = 2.423,
p = 0.0485; time, F7,280= 0.2142, p = 0.9820; and time x treatment
interaction, F28,280= 0.2142 p = 1; Panel SB: significant effect of
treat-ment, F4,280= 1.564, p = 0.1842; time, F7,280= 0.3723, p = 0.9180; and
time x treatment interaction, F28,280= 0.3723, p = 0.9987; Panel SC:
significant effect of treatment, F4,280= 0.9608, p = 0.4294; time,
F7,280 = 0.1612, p = 0.9923; and time x treatment interaction,
F28,280= 0.3495, p = 0.9993). These data demonstrate that all three
SCBs behave asΔ9
‐THC (Figure S3D; F23,191= 4.879, p < 0.0001).
FIGURE 2 Intraperitoneal injection (0.01–6 mg/kg) of 5F‐ADBINACA, (b) AB‐FUBINACA, and (c) STS‐135 on the visual object test in mice; (d)
evaluation of the total average effect observed in 5 hr withΔ9‐THC (0.01–100 mg/ kg)cand JWH‐018 90.01–6 mg/kg i.p.)c; (e) interaction of
different SCBs (6 mg/ kg) with the selective CB1receptor antagonist AM 251 (6 mg/ kg, i.p.) and (f) time course of evaluation of STS‐135 with AM
251 at 6 mg/kg. Data are expressed as arbitrary units and represent the mean ± SEM of 8 determinations for each treatment. Statistical analysis
was performed by two‐way ANOVA followed by the Bonferroni's test for multiple comparisons for the dose response curve of each compounds at
different times (panels a, b, and c), and for the interaction with the AM 251 (panels e and f), whereas the statistical analysis of panel d was
performed with one‐way ANOVA followed by Tukey's test for multiple comparisons. *p < 0.05, **p < 0.01, ***p < 0.001 versus vehicle;#p < 0.05,
###
p < 0.001 versusΔ9‐THC;^^^p < 0.001 versus JWH‐018;+p < 0.05,++p < 0.01 versus AM 251 + agonist and °p < 0.05, versus AM 251.cFrom
Pinnae reflex did not change in vehicle‐treated mice over 5 hr
observation (Figure S4A–C), and the response was similar to that
observed in naïve untreated animals (data not shown). Systemic
admin-istration of 5F‐ADBINACA transiently and slightly impaired pinna
reflex in mice only at the highest dose tested (6 mg/kg; Figure S4A:
significant effect of treatment, F4,280 = 12.36, p < 0.0001; time,
F7,280 = 3.507, p = 0.0013; and time x treatment interaction,
F28,280 = 1.095, p = 0.3428). Similarly, AB‐FUBINACA at 6 mg/kg
transiently inhibited pinnae reflex (Panel 4SB: significant effect of
treatment, F4,280= 14.95, p < 0.0001; time, F7,280= 1.5, p = 0.1669;
and time x treatment interaction, F28,280= 1.155, p = 0.2740). STS‐
135 was effective both at 1 and 6 mg/kg and the effect was prolonged at the highest dose tested (6 mg/kg; Panel 4SC: significant effect of
treatment, F4,280 = 34.24, p < 0.0001; time, F7,280 = 4.405,
p = 0.0001; and time x treatment interaction, F28,280 = 2.694,
p < 0.0001). The inhibition of pinnae reflex induced by the highest
FIGURE 3 Intraperitoneal injection (0.01–6 mg/kg) of (a) 5F‐ADBINACA, (b) AB‐FUBINACA, and (c) STS‐135 on the acoustic response test in the
mouse; (d) comparison of the total average effect observed in 5 hr withΔ9‐THC (0.01–100 mg/ kg)cand JWH‐018 (0.01–6 mg/kg i.p.)c; (e)
Interaction of different SCBs (6 mg/kg) with the selective CB1receptor antagonist AM 251 (6 mg/kg, i.p.). Data are expressed as arbitrary units and
represent the mean ± SEM of eight determinations for each treatment. Statistical analysis was performed by two‐way ANOVA followed by the
Bonferroni's test for multiple comparisons for the dose response curve of each compounds at different times (panels a, b, and c), and for the
interaction with the AM 251 (panel e), whereas the statistical analysis of panel d was performed with one‐way ANOVA followed by Tukey's test for
multiple comparisons. *p < 0.05, **p < 0.01, ***p < 0.001 versus vehicle;#p < 0.05,##p < 0.01,###p < 0.001 versusΔ9‐THC;^p < 0.05,^^p < 0.01,
dose of 5F‐ADBINACA, AB‐FUBINACA, and STS‐135 (6 mg/kg) was fully prevented by pretreatment with AM 251 (6 mg/kg i.p.; Figure
S4 E: significant effect of treatment, F3,56= 10.05, p < 0.0001; time,
F1,56 = 14.76, p = 0.0003; and time x treatment interaction,
F3,56= 4.710, p = 0.0053), which alone did not alter the pinnae reflex
in mice (data not shown). Inhibitory effects caused by 5F‐ADBINACA,
AB‐FUBINACA, and STS‐135 appeared similar to those induced by Δ9
‐
THC and less potent than those induced by JWH‐018 (Figure S4D;
F23,191= 5.568, p < 0.0001).
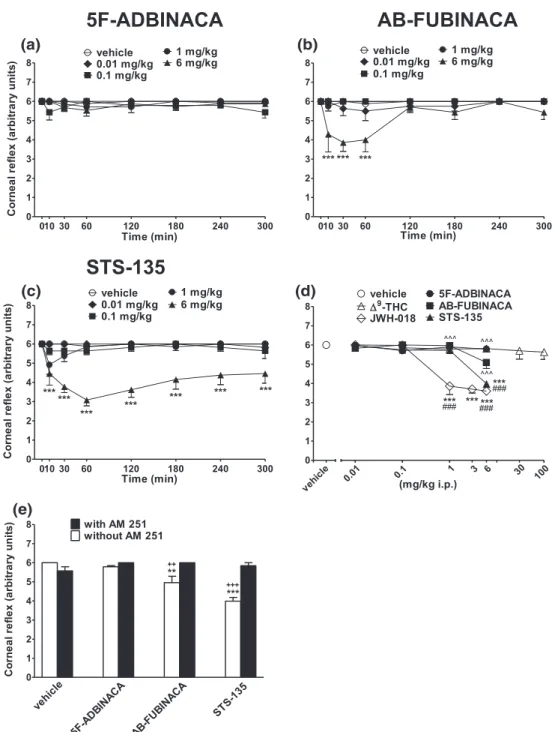
Corneal reflex did not change in vehicle‐treated mice over 5 hr
observation (Figure 4a–c), and the response was similar in naïve
untreated animals (data not shown). Systemic administration of 5F‐
ADBINACA did not alter the corneal reflex in mice (Figure 4a:
signifi-cant effect of treatment, F4,280 = 4.810, p = 0.0009; time,
F7,280 = 0.8266, p = 0.5659; and time x treatment interaction,
F28,280= 1.083, p = 0.3585). Conversely, the administration of AB‐
FUBINACA transiently inhibited at 6 mg/kg the corneal reflex in mice
(Figure 4b: significant effect of treatment, F4,280= 20.21, p < 0.0001;
FIGURE 4 Intraperitoneal injection (0.01–6 mg/kg) of (a) 5F‐ADBINACA, (b) AB‐FUBINACA, and (c) STS‐135 on the corneal reflex in the mouse;
(d) comparison of the total average effect observed in 5 hr withΔ9
‐THC (0.01–100 mg/kg)cand JWH
‐018 (0.01–6 mg/kg i.p.)c. (e) Interaction of
different SCBs (6 mg/kg) with the selective CB1receptor antagonist AM 251 (6 mg/kg, i.p.). Data are expressed as arbitrary units and represent the
mean ± SEM of eight determinations for each treatment. Statistical analysis was performed by two‐way ANOVA followed by the Bonferroni's test
for multiple comparisons for the dose response curve of each compounds at different times (panels a, b, and c), and for the interaction with the AM
251 (panel e), whereas the statistical analysis of panel d was performed with one‐way ANOVA followed by Tukey's test for multiple comparisons.
**p < 0.01, ***p < 0.001 versus vehicle;^^^p < 0.001 versus JWH‐018 and++p < 0.01,+++p < 0.001 versus AM 251 + agonist.cFrom Ossato et al.,
time, F7,280= 3.882, p = 0.0005; and time x treatment interaction,
F28,280= 2.587, p < 0.0001). STS‐135 (6 mg/kg) deeply inhibited the
corneal reflex in mice and the effect persisted up to 300 min
(Figure 4c: significant effect of treatment, F4,280= 76.44, p < 0.0001;
time, F7,280= 4.307, p = 0.0002; and time x treatment interaction,
F28,280= 2.988, p < 0.0001). The inhibition of corneal reflex induced
by the highest dose of AB‐FUBINACA and STS‐135 (6 mg/kg i.p.)
was prevented by the pretreatment with AM 251 (6 mg/kg i.p.;
Figure 4e: significant effect of treatment, F3,56= 13.74, p < 0.0001;
time, F1,56 = 31.88, p < 0.0001; and time x treatment interaction,
F3,56= 17.59, p < 0.0001), which alone did not alter the corneal reflex
in mice (data not shown). The effects of STS‐135 at 6 mg/kg were
higher than those induced by 5F‐ADBINACA and AB‐FUBINACA and
similar to those caused by JWH‐018 at the same doses (Figure 4d;
F23,191= 18.55, p < 0.0001).
3.3.4
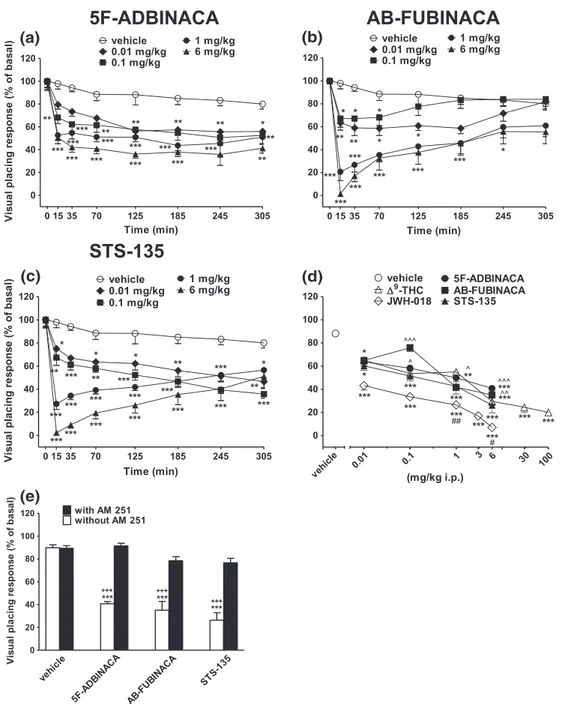
|Evaluation of the visual placing response
Visual placing response tended to be reduced in vehicle‐treated mice
over 5 hr observation (~20% of reduction at 300 min; Figure 5a,b),
FIGURE 5 Intraperitoneal injection (0.01–6 mg/kg) of (a) 5F‐ADBINACA, (b) AB‐FUBINACA, and (c) STS‐135 on the visual placing test in the
mouse; (d) comparison of the total average effect observed in 5 hr withΔ9
‐THC (0.01–100 mg/kg)cand JWH
‐018 (0.01–6 mg/kg i.p.)c; (e)
interaction of different SCBs (6 mg/kg) with the selective CB1receptor antagonist AM 251 (6 mg/kg, i.p.). Data are expressed as arbitrary units and
represent the mean ± SEM of eight determinations for each treatment. Statistical analysis was performed by two‐way ANOVA followed by the
Bonferroni's test for multiple comparisons for the dose response curve of each compounds at different times (panels a, b, and c), and for the
interaction with the AM 251 (panel e), whereas the statistical analysis of panel d was performed with one‐way ANOVA followed by Tukey's test for
multiple comparisons. *p < 0.05, **p < 0.01, ***p < 0.001 versus vehicle;##p < 0.01 versusΔ9‐THC;^p < 0.05,^^p < 0.01,^^^p < 0.001 versus JWH‐
and the effect was similar in naïve untreated animals (data not shown).
Systemic administration of 5F‐ADBINACA (0.01–6 mg/kg i.p.) dose
dependently reduced the visual placing response in mice and the effect persisted up to 5 hr (Figure 5a: significant effect of treatment, F4,280= 58.69, p < 0.0001; time, F7,280= 33.89, p < 0.0001; and time
x treatment interaction, F28,280= 1.507, p = 0.0528). Furthermore,
AB‐FUBINACA (0.01–6 mg/kg i.p.) dose dependently reduced the
visual placing response in mice, and the effect was prompt but tended to reverse after 185 min of drug administration (Figure 5b: significant
effect of treatment, F4,280= 66.05, p < 0.0001; time, F7,280= 26.92,
p < 0.0001; and time x treatment interaction, F28,280 = 3.443,
p < 0.0001). STS‐135 (0.01–6 mg/kg i.p.) dose dependently impaired
visual placing response (Figure 5c: significant effect of treatment, F4,280= 98.70, p < 0.0001; time, F7,280= 40.90, p < 0.0001; and time
x treatment interaction, F28,280= 6.406, p < 0.0001). The visual
impair-ment induced by the highest dose of 5F‐ADBINACA, AB‐FUBINACA,
and STS‐135 (6 mg/kg i.p.) was prevented by pretreatment with AM
251 (6 mg/kg i.p., Figure 5e: significant effect of treatment,
F3,56= 20.84, p < 0.0001; time, F1,56= 95.93, p < 0.0001; and time x
treatment interaction, F3,56= 11.10, p < 0.0001), which alone did not
alter the parameter. The inhibition of the visual response induced by
STS‐135 was higher than those induced by 5F‐ADBINACA and AB‐
FUBINACA administration and was similar to those of Δ9
‐THC
(Figure 5d; F23,191= 22.00, p < 0.0001).
3.4
|Tetrad paradigm for screening cannabinoid
‐like
effect
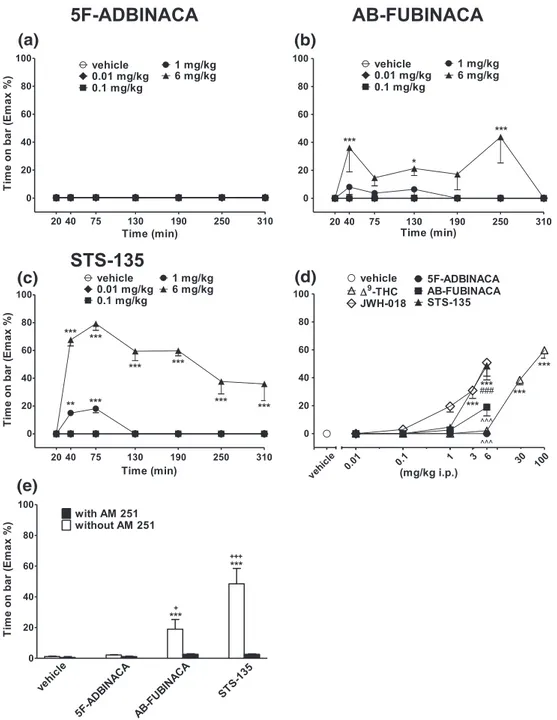
3.4.1
|Bar test
Systemic administration of 5F‐ADBINACA did not induce catalepsy in
the bar test (Figure 6a: significant effect of treatment, F4,245= 0.6317,
p = 0.6404; time, F6,245= 0.2635, p = 0.9534; and time x treatment
interaction, F24,245= 0.7410, p = 0.8065). Conversely, AB‐FUBINACA
increased the time spent on bar at 6 mg/kg (Figure 6b: significant
effect of treatment, F4,245= 19.22, p < 0.0001; time, F6,245= 2.677,
p = 0.0155; and time x treatment interaction, F24,245 = 2.220,
p = 0.0013). STS‐135 caused a transient increase (up to 75 min) in
the time spent on bar at 1 mg/kg and a marked catalepsy at 6 mg/kg, which persisted up to 5 hr (Figure 6c: significant effect of treatment, F4,245= 329.7, p < 0.0001; time, F6,245= 21.76, p < 0.0001; and time
x treatment interaction, F24,245= 14.44, p < 0.0001). The effects were
prevented by pretreatment with AM 251, which alone did not induce akinesia and catalepsy (Figure 6e: significant effect of treatment,
F3,56= 15.09, p < 0.0001; time, F1,56= 29.13, p < 0.0001; and time x
treatment interaction, F3,56= 12.89, p < 0.0001). STS‐135 was more
potent in inducing catalepsy than AB‐FUBINACA, and its effect was
similar to that induced by JWH‐018 at 6 mg/kg (Figure 6d;
F23,191= 25.93, p < 0.0001).
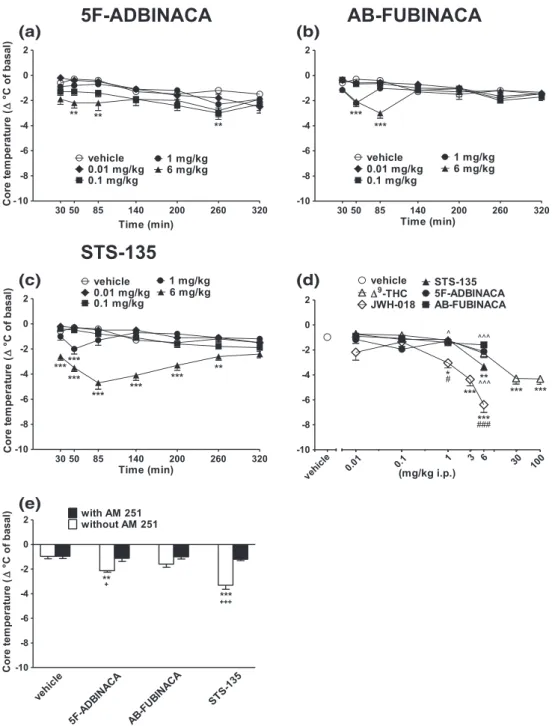
3.4.2
|Evaluation of the core and surface body
temperature
Systemic administration of 5F‐ADBINACA and STS‐135 (0.01–6 mg/kg
i.p.) reduced both core (Figure 7) and surface (Figure S5) body
temperature in mice. AB‐FUBINACA slightly reduced only core
temper-ature at 6 mg/kg (Figure 7b) but did not change surface tempertemper-ature
(Figure S5). In particular, 5F‐ADBINACA and AB‐FUBINACA provoked
a transient reduction in core temperature at 6 mg/kg (−2.5 °C at
50 min and−3 °C at 85 min time point, respectively; Figure 7a:
signifi-cant effect of treatment, F4,245 = 15.24, p < 0.0001; time,
F6,245 = 11.02, p < 0.0001; and time x treatment interaction,
F24,245= 1.207, p = 0.2365; Panel b: significant effect of treatment,
F4,245= 10.16, p < 0.0001; time, F6,245= 6.546, p < 0.0001; and time x
treatment interaction, F24,245= 4.638, p < 0.0001). On the other hand,
STS‐135 at 1 mg/kg evoked a transient hypothermia in mice (−2 °C at
50 min time point); whereas at 6 mg/kg, the effect (−4.8 °C at 85 min
time point) persisted up to 260 min (Figure 7c: significant effect of
treat-ment, F4,245= 93.68, p < 0.0001; time, F6,245= 3.972, p = 0.0008; and
time x treatment interaction, F24,245 = 4.562, p < 0.0001). 5F‐
ADBINACA, AB‐FUBINACA, and STS‐135 were ineffective in the range
of doses of 0.01–0.1 mg/kg. In studies with 5F‐ADBINACA and STS‐
135 (at 1 and 6 mg/kg) core body hypothermia was accompanied by a reduction of the surface body temperature (Figure S5A: significant
effect of treatment, F4,245= 14.86, p < 0.0001; time, F6,245= 4.314,
p = 0.0004; and time x treatment interaction, F24,245 = 0.5821,
p = 0.9423; Figure S5 C: significant effect of treatment, F4,245= 50.58,
p < 0.0001; time, F6,245= 6.842, p < 0.0001; and time x treatment
inter-action, F24,245= 3.074, p < 0.0001). Core and surface body temperature
changes were prevented by pretreatment with AM 251, which did not affect body temperature when administered alone (Figure 7 E:
signifi-cant effect of treatment, F3,56= 17.61, p < 0.0001; time, F1,56= 55.21,
p < 0.0001; and time x treatment interaction, F3,56 = 8.385,
p = 0.0001; Figure S5 E: significant effect of treatment, F3,56= 12.24,
p < 0.0001; time, F1,56= 59.09, p < 0.0001; and time x treatment
inter-action, F3,56= 11.34, p < 0.0001). Furthermore, overall changes on core
and surface temperature induced by 5F‐ADBINACA, AB‐FUBINACA,
and STS‐135 administration were similar to those induced by Δ9
‐THC
but less potent compared to those caused by JWH‐018 (Figure 7d;
F23,191= 19.10, p < 0.0001; Figure S5d: F23,191= 11.70, p < 0.0001).
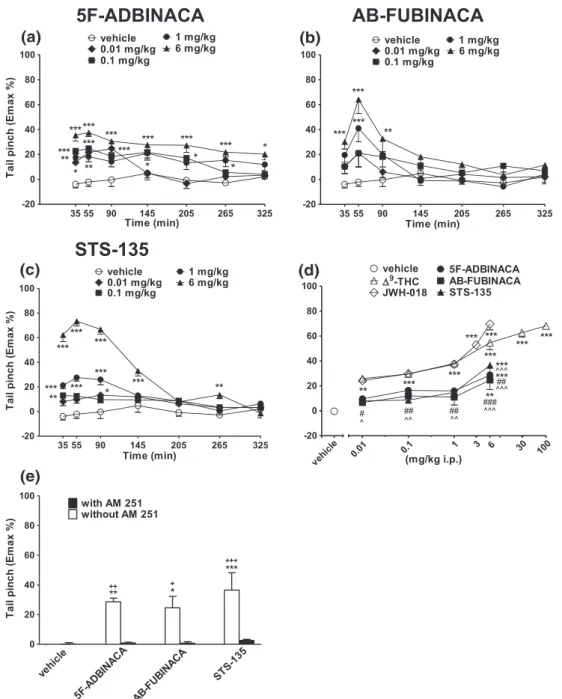
3.4.3
|Evaluation of pain induced by mechanical and
thermal stimuli
Systemic administration of 5F‐ADBINACA (0.01–6 mg/kg i.p.)
increased in a dose dependent manner the threshold to acute mechan-ical pain stimulus in mice, and the analgesic effect was prolonged up to
5 hr (Figure 8a: significant effect of treatment, F4,245 = 50.53,
p < 0.0001, time, F6,245= 7.263, p < 0.0001; and time x treatment
inter-action, F24,245= 2.037, p = 0.0038). On the other hand, systemic
admin-istration of AB‐FUBINACA and STS‐135 transiently induced an
analgesic effect at 1 and 6 mg/kg (Figure 8 b: significant effect of
treat-ment, F4,245= 16.02, p < 0.0001; time, F6,245= 12.17, p < 0.0001; and
time x treatment interaction, F24,245= 2.271, p = 0.0009; Figure 8c:
sig-nificant effect of treatment, F4,245 = 134.9, p < 0.0001; time,
F6,245 = 42.93, p < 0.0001; and time x treatment interaction,
F24,245= 16.51, p < 0.0001). Effects were prevented by pretreatment
with AM 251, which alone did not alter the threshold to acute
mechan-ical pain stimuli (Figure 8e: significant effect of treatment, F3,56= 5.422,
p = 0.0024; time, F1,56= 35.50, p < 0.0001; and time x treatment
inter-action, F3,56= 4.442, p = 0.0072). The analgesic effect induced by each
one SCBs was similar to those induced byΔ9‐THC and lower to that
Systemic administration of 5F‐ADBINACA, AB‐FUBINACA, and
STS‐135 (0.01–6 mg/kg i.p.) transiently increased the threshold to
acute thermal pain stimulus in mice only at the highest dose tested
(Figure 9a: significant effect of treatment, F4,245= 7.550, p < 0.0001;
time, F6,245= 2.761, p = 0.0129; and time x treatment interaction,
F24,245= 1.920, p = 0.0075; Figure 9b: significant effect of treatment,
F4,245= 11.42, p < 0.0001; time, F6,245= 2.537, p = 0.0212; and time x
treatment interaction, F24,245= 1.152, p = 0.2883). In particular, STS‐
135 quickly induced a robust elevation of the pain threshold, which persisted up to 145 min after administration (Figure 9c: significant
effect of treatment, F4,245= 52.10, p < 0.0001; time, F6,245= 10.79,
p < 0.0001; and time x treatment interaction, F24,245 = 4.903,
p < 0.0001). SCB effects were prevented by pretreatment with AM 251, which alone did not alter the threshold to acute thermal pain
stimuli (Figure 9e: significant effect of treatment, F3,56 = 9.829,
p < 0.0001; time, F1,56= 12.85, p = 0.0007; and time x treatment
inter-action, F3,56= 4.258, p = 0.0089).
5F‐ADBINACA and AB‐FUBINACA were less effective than STS‐
135, Δ9‐THC, and JWH‐018 administration, whereas STS‐135 was
equally effective toΔ9
‐THC (Figure 9d: F23,191= 15.73, p < 0.0001).
FIGURE 6 Intraperitoneal injection (0.01–6 mg/kg) of (a) 5F‐ADBINACA, (b) AB‐FUBINACA, and (c) STS‐135 on the bar test of the mouse; (d)
comparison of the total average effect observed in 5 hr withΔ9
‐THC (0.01–100 mg/kg)aand JWH
‐018 (0.01–6 mg/kg i.p.)a; (e) interaction of
different SCBs (6 mg/kg) with the selective CB1receptor antagonist AM 251 (6 mg/kg, i.p.). Data are expressed as arbitrary units and represent the
mean ± SEM of eight determinations for each treatment. Statistical analysis was performed by two‐way ANOVA followed by the Bonferroni's test
for multiple comparisons for the dose response curve of each compounds at different times (panels a, b, and c), and for the interaction with the AM
251 (panel e), whereas the statistical analysis of panel d was performed with one‐way ANOVA followed by Tukey's test for multiple comparisons.
*p < 0.05, **p < 0.01, ***p < 0.001 versus vehicle;###p < 0.001 versusΔ9‐THC;^^^p < 0.001 versus JWH‐018;+p < 0.05,+++p < 0.001 versus AM
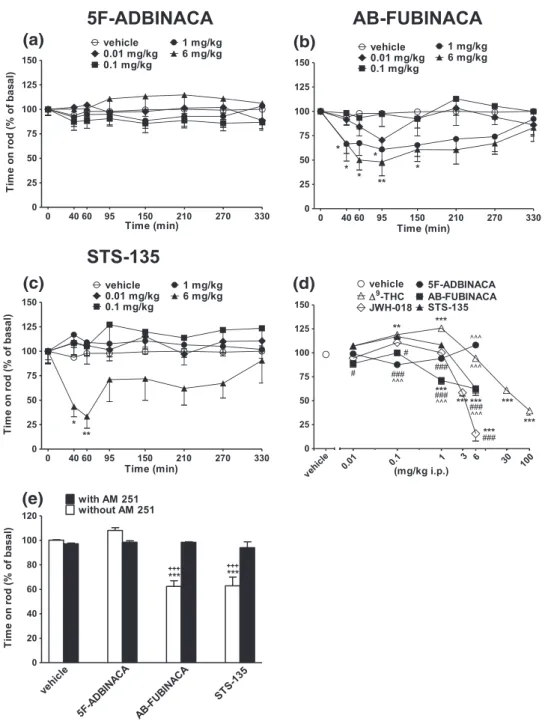
3.4.4
|Accelerod test
In the accelerod test, AB‐FUBINACA and STS‐135 induced only a
tran-sient impairment of stimulated locomotion (inhibition of about 55% and 70%, respectively; Figure 10b: significant effect of treatment, F4,280= 13.75, p < 0.0001; time, F7,280= 2.602, p = 0.0129; and time
x treatment interaction, F28,280= 0.6474, p = 0.9165; Figure 10c:
sig-nificant effect of treatment, F4,280 = 16, p < 0.0001; time,
F7,280 = 0.7354, p = 0.6421; and time x treatment interaction,
F28,280= 0.7652, p = 0.7999). On the contrary, 5F‐ADBINACA was
ineffective (Figure 10a: significant effect of treatment, F4,280= 4.893,
p = 0.0008; time, F7,280= 0.1784, p = 0.9896; and time x treatment
interaction, F28,280= 0.501 p = 0.9993). The inhibitory effects were
prevented by pretreatment with AM 251, which alone did not affect mice performance (Figure 10e: significant effect of treatment,
F3,56= 25.08, p < 0.0001; time, F1,56= 29.36, p < 0.0001; and time x
treatment interaction, F3,56= 21.22, p < 0.0001). AB‐FUBINACA and
FIGURE 7 Intraperitoneal injection (0.01–6 mg/kg) of (a) 5F‐ADBINACA, (b) AB‐FUBINACA, and (c) STS‐135 on mouse core temperature; (d)
comparison of the total average effect observed in 5 hr withΔ9
‐THC (0.01–100 mg/kg)aand JWH
‐018 (0.01–6 mg/kg i.p.)a; (e) interaction of
different SCBs (6 mg/kg) with the selective CB1receptor antagonist AM 251 (6 mg/kg, i.p.). Data are expressed as arbitrary units and represent the
mean ± SEM of eight determinations for each treatment. Statistical analysis was performed by two‐way ANOVA followed by the Bonferroni's test
for multiple comparisons for the dose response curve of each compounds at different times (panels a, b, and c), and for the interaction with the AM
251 (panel e), whereas the statistical analysis of panel d was performed with one‐way ANOVA followed by Tukey's test for multiple comparisons.
*p < 0.05, **p < 0.01, ***p < 0.001 versus vehicle;#p < 0.05,###p < 0.001 versusΔ9‐THC;^p < 0.05,^^^p < 0.001 versus JWH‐018 and+p < 0.05,+
STS‐135 were less effective in comparison to JWH‐018 but more
potent thanΔ9
‐THC (Figure 10d: F23,191= 63.79, p < 0.0001).
3.4.5
|Drag test
Systemic administration of AB‐FUBINACA and STS‐135 (1 and 6 mg/kg)
induced a long lasting reduction of number of steps performed with the front paws of the mice (Figure 11b: significant effect of treatment, F4,280= 11.82, p < 0.0001; time, F7,280= 2.032, p = 0.0512; and time x
treatment interaction, F28,280 = 0.9066, p = 0.6055; Figure 11c:
significant effect of treatment, F4,280 = 37.56, p < 0.0001; time,
F7,280 = 1.713, p = 0.1058; and time x treatment interaction,
F28,280= 1.384, p = 0.0994). On the contrary, 5F‐ADBINACA was
inef-fective (Figure 11 A: significant effect of treatment, F4,280= 2.108,
p = 0.0800; time, F7,280= 0.5695, p = 0.7806; and time x treatment
interaction, F28,280 = 0.2714 p = 0.9999). Inhibitory effects were
prevented by pretreatment with AM 251 (Figure 11e: significant effect
of treatment, F3,56= 48.65, p < 0.0001; time, F1,56= 109.3, p < 0.0001;
and time x treatment interaction, F3,56 = 37.73, p < 0.0001).
5F‐ADBINACA, AB‐FUBINACA, and STS‐135 at the highest dose
FIGURE 8 Intraperitoneal injection (0.01–6 mg/kg) of (a) 5F‐ADBINACA, (b) AB‐FUBINACA, and (c) STS‐135 on the tail pinch test of the mouse;
(d) comparison of the total average effect observed in 5 hours withΔ9‐THC (0.01–100 mg/kg)aand JWH‐018 (0.01–6 mg/kg i.p.)a; (e) interaction of
different SCBs (6 mg/kg) with the selective CB1receptor antagonist AM 251 (6 mg/kg, i.p.). Data are expressed as arbitrary units and represent the
mean ± SEM of eight determinations for each treatment. Statistical analysis was performed by two‐way ANOVA followed by the Bonferroni's test
for multiple comparisons for the dose response curve of each compounds at different times (panels a, b, and c), and for the interaction with the AM
251 (panel e), whereas the statistical analysis of panel d was performed with one‐way ANOVA followed by Tukey's test for multiple comparisons.
*p < 0.05, **p < 0.01, ***p < 0.001 versus vehicle;#p < 0.05,##p < 0.01,###p < 0.001 versus
Δ9
‐THC;^p < 0.05,^^p < 0.01,^^^p < 0.001 versus