Supplementary appendix
This appendix formed part of the original submission and has been peer reviewed.
We post it as supplied by the authors.
This online publication has been corrected. The corrected version first appeared at
thelancet.com on March 4, 2021.
Supplement to: GlobalSurg Collaborative and National Institute for Health Research
Global Health Research Unit on Global Surgery. Global variation in postoperative
mortality and complications after cancer surgery: a multicentre, prospective cohort
study in 82 countries. Lancet 2021; published online Jan 21. http://dx.doi.org/10.1016/
S0140-6736(21)00001-5.
Online supplementary appendix
Global variation in postoperative mortality and complications following cancer surgery: A multicentre,
prospective cohort study in 82 countries
GlobalSurg Collaborative and NIHR Global Health Research Unit on Global Surgery*
* Investigators listed in online supplementary appendix.
1
Table of Contents
Supplementary tables and figures ... 2
Table S1. Patient and operative characteristics by country income group stratified by cancer type, including missing data. ... 2
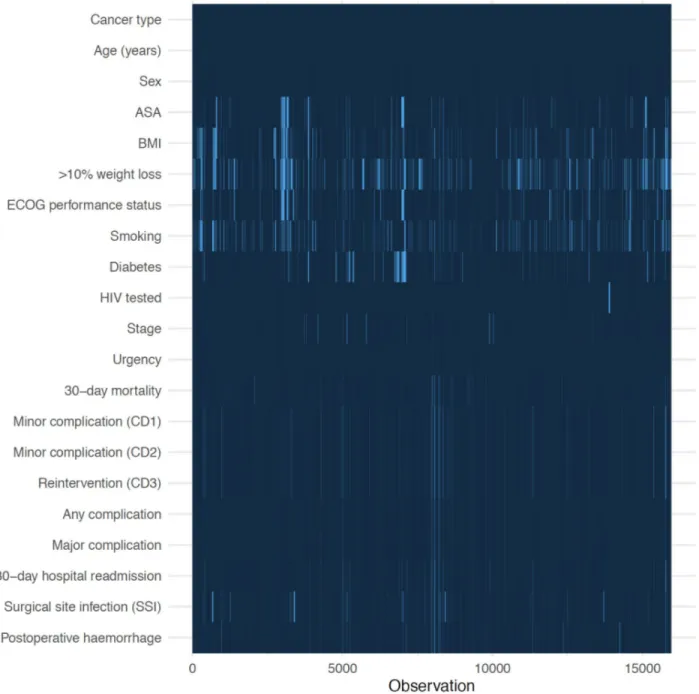
Figure S1. Missing values map. Missing values for main explanatory and dependent variables by observation. ... 3
Figure S2. Stage of presentation, 30-day mortality, and 30-day complications by cancer and country income group. ... 4
Figure S3. Proportion of all patients who sustained specific complications, stratified by cancer-type and country income group. . 5
Figure S4. A, adjusted proportion of patients dying or sustaining a major complication or any complication by day 30 after
surgery stratified by country income group... 6
Figure S5. A, method of determination of 30-day follow-up variables. B, basis for cancer diagnosis. ... 7
Table S2. Stage of presentation by region. ... 8
Table S3A. Cancer stage by other predictors (breast). ... 9
Table S3B. Cancer stage by other predictors (colon). ... 11
Table S3C. Cancer stage by other predictors (gastric). ... 13
Figure S6A. Comparison between preoperative clinical and postoperative final pathological staging. ... 15
Figure S6B. Capacity to rescue from major complication: sensitivity analysis using postoperative final pathological staging. .... 16
Table S4A. Surgical procedure (breast). ... 17
Table S4B. Surgical procedure (colorectal). ... 18
Table S4C. Surgical procedure (gastric). ... 19
Table S5. Detailed outcomes stratified by cancer and country income level. ... 20
Table S6A. Breast cancer logistic regression analyses: 30-day mortality. ... 22
Table S6B. Breast cancer logistic regression analyses: major complication. ... 23
Table S6C. Breast cancer logistic regression analyses: all complications. ... 25
Table S7A. Colorectal cancer logistic regression analyses: mortality... 27
Table S7B. Colorectal cancer logistic regression analyses: major complication. ... 29
Table S7C. Colorectal cancer logistic regression analyses: all complications. ... 31
Table S8A. Gastric cancer logistic regression analyses: mortality. ... 33
Table S8B. Gastric cancer logistic regression analyses: major complication. ... 35
Table S8C. Gastric cancer logistic regression analyses: all complications. ... 37
Table S9. Complications in patients who died. ... 39
Figure S7. Hospital type and facilities for centres treating colorectal and gastric cancer, stratified by country income group. ... 41
Table S10. Summary of hospital care services for centres treating gastric and colon cancer stratified by country income group. 42
Table S11. 30-day mortality in patients who sustained a major complication. ... 43
Table S12. 3-way mediation decomposition of proportion of effect of country income group on 30-day mortality. ... 44
Table S13. Absolute risk difference for 30-day mortality after major complication in the presence of consistently available
postoperative care infrastructure. ... 45
Independent validation study ... 47
Case ascertainment ... 47
Figure S8. Distribution of patients enrolled per hospital in validation sample. ... 47
Figure S9. Case ascertainment. ... 48
Data accuracy ... 49
Table S14. Availability of sampled variables to validators by country income group. ... 49
Table S15. Validation study for continuous variable ... 50
Figure S10. Correlation of patient age in validation vs primary datasets (n=4520) ... 50
Table S16. Validation study for categorical variables ... 51
Authorship ... 52
Writing group ... 52
Contributions ... 53
Conflicts of interest ... 54
National Leads ... 54
Local Collaborators ... 55
Data Validators ... 68
Protocol Authors ... 72
Protocol Translators ... 72
2
Supplementary tables and figures
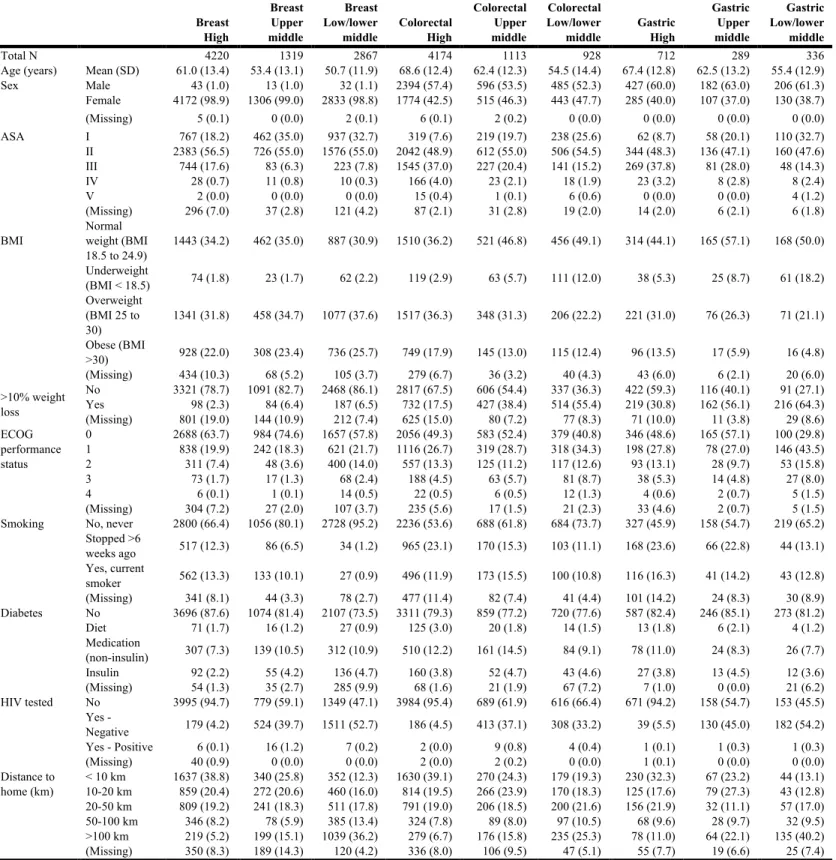
Table S1. Patient and operative characteristics by country income group stratified by cancer type, including missing data.
Numbers are n (%), unless otherwise indicated. ASA, American Society of Anesthesiologists operative risk grade. ECOG, Eastern
Cooperative Oncology Group. High income included 31 countries and 241 hospitals. Upper middle income included 23 countries and
81 hospitals. Lower middle/low income included 28 countries and 106 hospitals. The total column therefore includes 82 countries and
428 hospitals.
Breast High Breast Upper middle Breast Low/lowermiddle Colorectal High
Colorectal Upper middle
Colorectal Low/lower
middle Gastric High
Gastric Upper middle Gastric Low/lower middle Total N 4220 1319 2867 4174 1113 928 712 289 336
Age (years) Mean (SD) 61.0 (13.4) 53.4 (13.1) 50.7 (11.9) 68.6 (12.4) 62.4 (12.3) 54.5 (14.4) 67.4 (12.8) 62.5 (13.2) 55.4 (12.9) Sex Male 43 (1.0) 13 (1.0) 32 (1.1) 2394 (57.4) 596 (53.5) 485 (52.3) 427 (60.0) 182 (63.0) 206 (61.3) Female 4172 (98.9) 1306 (99.0) 2833 (98.8) 1774 (42.5) 515 (46.3) 443 (47.7) 285 (40.0) 107 (37.0) 130 (38.7) (Missing) 5 (0.1) 0 (0.0) 2 (0.1) 6 (0.1) 2 (0.2) 0 (0.0) 0 (0.0) 0 (0.0) 0 (0.0) ASA I 767 (18.2) 462 (35.0) 937 (32.7) 319 (7.6) 219 (19.7) 238 (25.6) 62 (8.7) 58 (20.1) 110 (32.7) II 2383 (56.5) 726 (55.0) 1576 (55.0) 2042 (48.9) 612 (55.0) 506 (54.5) 344 (48.3) 136 (47.1) 160 (47.6) III 744 (17.6) 83 (6.3) 223 (7.8) 1545 (37.0) 227 (20.4) 141 (15.2) 269 (37.8) 81 (28.0) 48 (14.3) IV 28 (0.7) 11 (0.8) 10 (0.3) 166 (4.0) 23 (2.1) 18 (1.9) 23 (3.2) 8 (2.8) 8 (2.4) V 2 (0.0) 0 (0.0) 0 (0.0) 15 (0.4) 1 (0.1) 6 (0.6) 0 (0.0) 0 (0.0) 4 (1.2) (Missing) 296 (7.0) 37 (2.8) 121 (4.2) 87 (2.1) 31 (2.8) 19 (2.0) 14 (2.0) 6 (2.1) 6 (1.8) BMI Normal weight (BMI
18.5 to 24.9) 1443 (34.2) 462 (35.0) 887 (30.9) 1510 (36.2) 521 (46.8) 456 (49.1) 314 (44.1) 165 (57.1) 168 (50.0) Underweight (BMI < 18.5) 74 (1.8) 23 (1.7) 62 (2.2) 119 (2.9) 63 (5.7) 111 (12.0) 38 (5.3) 25 (8.7) 61 (18.2) Overweight (BMI 25 to 30) 1341 (31.8) 458 (34.7) 1077 (37.6) 1517 (36.3) 348 (31.3) 206 (22.2) 221 (31.0) 76 (26.3) 71 (21.1) Obese (BMI >30) 928 (22.0) 308 (23.4) 736 (25.7) 749 (17.9) 145 (13.0) 115 (12.4) 96 (13.5) 17 (5.9) 16 (4.8) (Missing) 434 (10.3) 68 (5.2) 105 (3.7) 279 (6.7) 36 (3.2) 40 (4.3) 43 (6.0) 6 (2.1) 20 (6.0) >10% weight loss No 3321 (78.7) 1091 (82.7) 2468 (86.1) 2817 (67.5) 606 (54.4) 337 (36.3) 422 (59.3) 116 (40.1) 91 (27.1) Yes 98 (2.3) 84 (6.4) 187 (6.5) 732 (17.5) 427 (38.4) 514 (55.4) 219 (30.8) 162 (56.1) 216 (64.3) (Missing) 801 (19.0) 144 (10.9) 212 (7.4) 625 (15.0) 80 (7.2) 77 (8.3) 71 (10.0) 11 (3.8) 29 (8.6) ECOG performance status 0 2688 (63.7) 984 (74.6) 1657 (57.8) 2056 (49.3) 583 (52.4) 379 (40.8) 346 (48.6) 165 (57.1) 100 (29.8) 1 838 (19.9) 242 (18.3) 621 (21.7) 1116 (26.7) 319 (28.7) 318 (34.3) 198 (27.8) 78 (27.0) 146 (43.5) 2 311 (7.4) 48 (3.6) 400 (14.0) 557 (13.3) 125 (11.2) 117 (12.6) 93 (13.1) 28 (9.7) 53 (15.8) 3 73 (1.7) 17 (1.3) 68 (2.4) 188 (4.5) 63 (5.7) 81 (8.7) 38 (5.3) 14 (4.8) 27 (8.0) 4 6 (0.1) 1 (0.1) 14 (0.5) 22 (0.5) 6 (0.5) 12 (1.3) 4 (0.6) 2 (0.7) 5 (1.5) (Missing) 304 (7.2) 27 (2.0) 107 (3.7) 235 (5.6) 17 (1.5) 21 (2.3) 33 (4.6) 2 (0.7) 5 (1.5) Smoking No, never 2800 (66.4) 1056 (80.1) 2728 (95.2) 2236 (53.6) 688 (61.8) 684 (73.7) 327 (45.9) 158 (54.7) 219 (65.2)
Stopped >6 weeks ago 517 (12.3) 86 (6.5) 34 (1.2) 965 (23.1) 170 (15.3) 103 (11.1) 168 (23.6) 66 (22.8) 44 (13.1) Yes, current smoker 562 (13.3) 133 (10.1) 27 (0.9) 496 (11.9) 173 (15.5) 100 (10.8) 116 (16.3) 41 (14.2) 43 (12.8) (Missing) 341 (8.1) 44 (3.3) 78 (2.7) 477 (11.4) 82 (7.4) 41 (4.4) 101 (14.2) 24 (8.3) 30 (8.9) Diabetes No 3696 (87.6) 1074 (81.4) 2107 (73.5) 3311 (79.3) 859 (77.2) 720 (77.6) 587 (82.4) 246 (85.1) 273 (81.2) Diet 71 (1.7) 16 (1.2) 27 (0.9) 125 (3.0) 20 (1.8) 14 (1.5) 13 (1.8) 6 (2.1) 4 (1.2) Medication (non-insulin) 307 (7.3) 139 (10.5) 312 (10.9) 510 (12.2) 161 (14.5) 84 (9.1) 78 (11.0) 24 (8.3) 26 (7.7) Insulin 92 (2.2) 55 (4.2) 136 (4.7) 160 (3.8) 52 (4.7) 43 (4.6) 27 (3.8) 13 (4.5) 12 (3.6) (Missing) 54 (1.3) 35 (2.7) 285 (9.9) 68 (1.6) 21 (1.9) 67 (7.2) 7 (1.0) 0 (0.0) 21 (6.2) HIV tested No 3995 (94.7) 779 (59.1) 1349 (47.1) 3984 (95.4) 689 (61.9) 616 (66.4) 671 (94.2) 158 (54.7) 153 (45.5) Yes - Negative 179 (4.2) 524 (39.7) 1511 (52.7) 186 (4.5) 413 (37.1) 308 (33.2) 39 (5.5) 130 (45.0) 182 (54.2) Yes - Positive 6 (0.1) 16 (1.2) 7 (0.2) 2 (0.0) 9 (0.8) 4 (0.4) 1 (0.1) 1 (0.3) 1 (0.3) (Missing) 40 (0.9) 0 (0.0) 0 (0.0) 2 (0.0) 2 (0.2) 0 (0.0) 1 (0.1) 0 (0.0) 0 (0.0) Distance to home (km) < 10 km 10-20 km 1637 (38.8) 859 (20.4) 272 (20.6) 340 (25.8) 460 (16.0) 352 (12.3) 1630 (39.1) 814 (19.5) 270 (24.3) 266 (23.9) 179 (19.3) 170 (18.3) 230 (32.3) 125 (17.6) 67 (23.2) 79 (27.3) 44 (13.1) 43 (12.8) 20-50 km 809 (19.2) 241 (18.3) 511 (17.8) 791 (19.0) 206 (18.5) 200 (21.6) 156 (21.9) 32 (11.1) 57 (17.0) 50-100 km 346 (8.2) 78 (5.9) 385 (13.4) 324 (7.8) 89 (8.0) 97 (10.5) 68 (9.6) 28 (9.7) 32 (9.5) >100 km 219 (5.2) 199 (15.1) 1039 (36.2) 279 (6.7) 176 (15.8) 235 (25.3) 78 (11.0) 64 (22.1) 135 (40.2) (Missing) 350 (8.3) 189 (14.3) 120 (4.2) 336 (8.0) 106 (9.5) 47 (5.1) 55 (7.7) 19 (6.6) 25 (7.4)
3
4
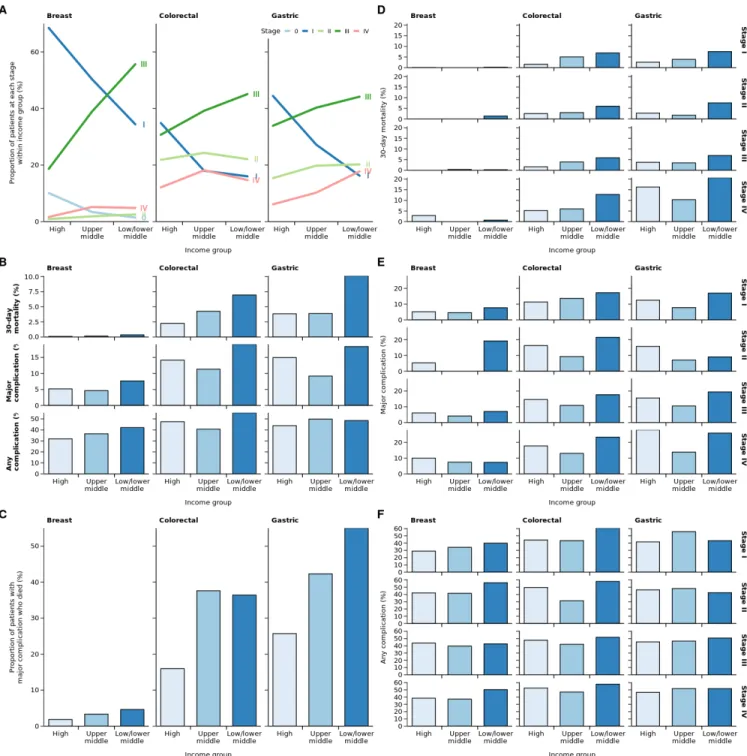
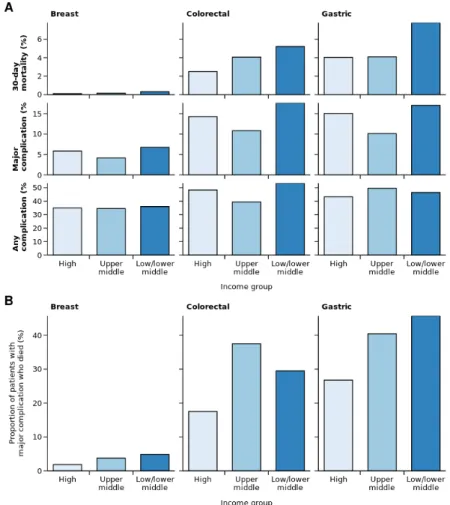
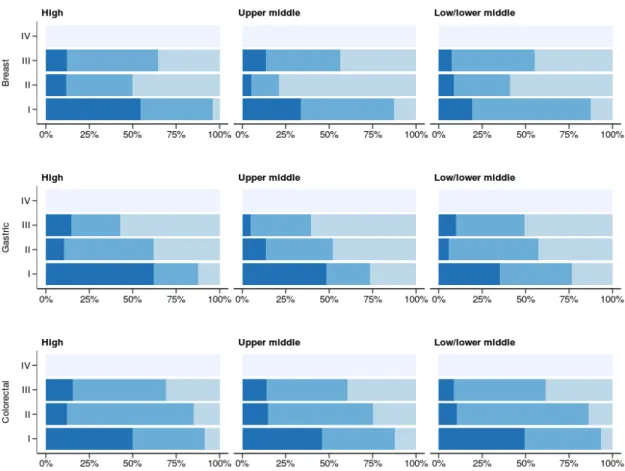
Figure S2. Stage of presentation, 30-day mortality, and 30-day complications by cancer and country income group.
Panels A, B
and C are replicated from Figure 3 to aid comparisons. A, proportion of patients enrolled by cancer stage by country income
group. B, proportion of patients dying or sustaining a major complication or any complication by day 30 after surgery
stratified by country income group. C, proportion of patients sustaining a major complication who died within 30 days. D, E,
F, 30-day mortality (D), major complication (E), and any complication (F) stratified by cancer type, cancer stage, and country
income group.
5
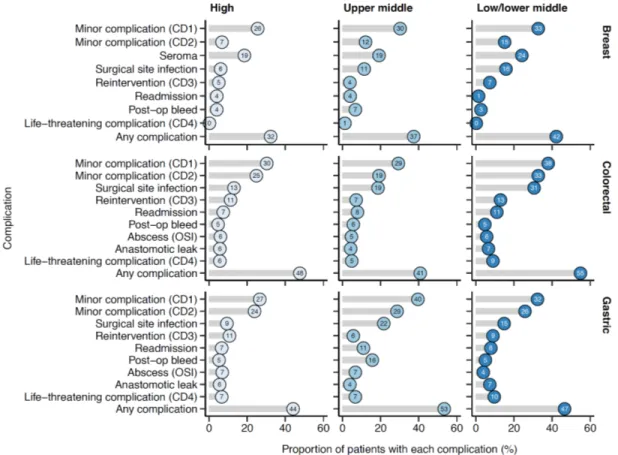
Figure S3. Proportion of all patients who sustained specific complications, stratified by cancer-type and country income group.
Ordered by overall frequency. CD, Clavien-Dindo complication grade; OSI, organ space infection. See appendix pp 21-22 for detailed
table.
6
Figure S4. A, adjusted proportion of patients dying or sustaining a major complication or any complication by day 30 after
surgery stratified by country income group.
B, proportion of patients sustaining a major complication who died within 30
days. Proportions are adjusted for patient complications using multivariable (reduced) logistic regression models in Table
S6A/B/C (breast), Table S7A/B/C (colorectal), Table S8A/B/C (gastric), pp 23-39.
7
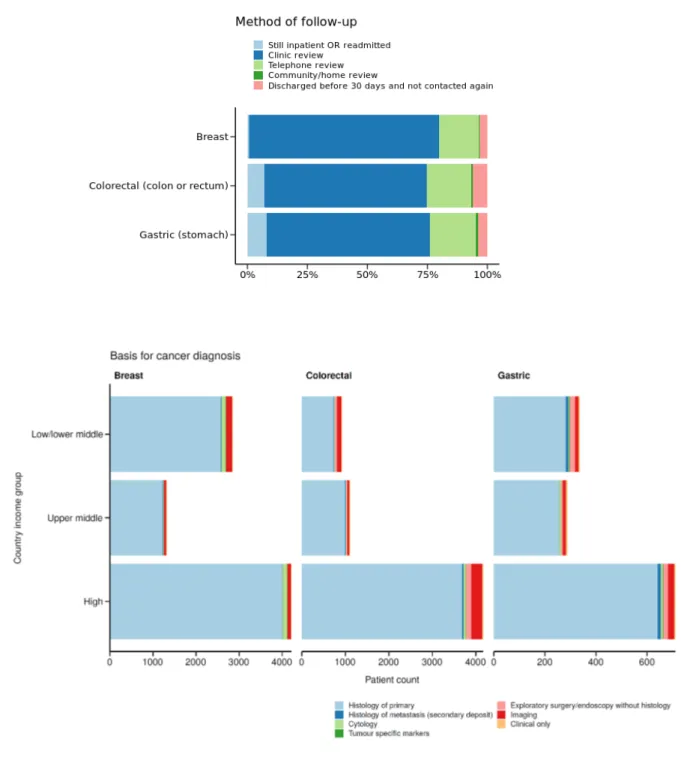
Figure S5. A, method of determination of 30-day follow-up variables. B, basis for cancer diagnosis stratified by cancer type
and country income group.
A
8
Table S2. Stage of presentation by region.
World Bank income
(tertile) High middle Upper Low/lower middle p
eTNM pre-op (breast) Tis 427 (10.1) 45 (3.4) 42 (1.5) <0.001 L1 (41.8) 1760 298 (22.7) 245 (8.7) L2 (26.8) 1129 361 (27.5) 741 (26.2) A 38 (0.9) 25 (1.9) 74 (2.6) R1 646 (15.3) 404 (30.8) 1184 (41.8) R2 141 (3.3) 109 (8.3) 406 (14.3) M+ 70 (1.7) 71 (5.4) 140 (4.9) eTNM pre-op (colorectal) L (35.1) 1457 198 (17.9) 147 (16.2) <0.001
A 911 (21.9) 269 (24.3) 206 (22.7) R+ (30.7) 1276 437 (39.4) 415 (45.8) M+ 511 (12.3) 204 (18.4) 138 (15.2) eTNM pre-op (gastric) L 316 (44.5) 77 (27.3) 57 (17.2) <0.001
A 108 (15.2) 58 (20.6) 69 (20.8) R+ 243 (34.2) 115 (40.8) 147 (44.4) M+ 43 (6.1) 32 (11.3) 58 (17.5)
eTNM, Essential TNM Classification of Malignant Tumours as defined by the Union for International Cancer Control (UICC).
Breast cancer: Tis, No invasive cancer (e.g. DCIS); L1, Tumour £2 cm in size (T1); L2, Tumour >2 cm in size (T2/T3); A,
Inflammatory cancer, chest wall invasion or ulceration present (T4); R1, 1 to 3 nodes involved inside axilla but none outside axilla
(N1); R2, >3 nodes involved inside axilla or nodal involvement outside axilla (N2/N3); M+, Metastases present (M1).
Gastric cancer: L, Tumour contained within stomach wall with no nodal involvement (Stage I); A, Tumour through stomach wall
with no nodal involvement (Stage II); R+, Regional lymph node involvement (Stage III); M+, Metastases present (Stage IV)
Colorectal cancer: L, Tumour contained within bowel wall with no nodal involvement (Stage I); A, Tumour through bowel wall with
9
Table S3A. Cancer stage by other predictors (breast).
Tis
N=514 N=4534 L1/L2 N=137 A N=2890 R1/R2 N=281 M+ p
Age (years) Mean (SD) 56.9 (12.9) 58.4 (13.8) 57.3 (16.9) 53.0 (13.1) 53.9 (13.3) <0.001
Sex Male 3 (0.6) 40 (0.9) 5 (3.6) 37 (1.3) 3 (1.1) 0.013 Female 510 (99.4) 4491 (99.1) 132 (96.4) 2850 (98.7) 278 (98.9) ASA I 122 (26.2) 1108 (25.9) 31 (23.7) 816 (29.6) 69 (25.7) <0.001 II 273 (58.7) 2553 (59.6) 69 (52.7) 1625 (59.0) 142 (52.8) III 66 (14.2) 599 (14.0) 30 (22.9) 303 (11.0) 48 (17.8) IV 2 (0.4) 23 (0.5) 1 (0.8) 12 (0.4) 10 (3.7) V 2 (0.4) 0 (0.0) 0 (0.0) 0 (0.0) 0 (0.0)
BMI Normal weight (BMI 18.5 to 24.9) 172 (37.2) 1537 (36.9) 45 (34.4) 933 (34.2) 92 (34.3) 0.122 Underweight (BMI < 18.5) 5 (1.1) 90 (2.2) 2 (1.5) 54 (2.0) 7 (2.6) Overweight (BMI 25 to 30) 153 (33.1) 1529 (36.7) 45 (34.4) 1040 (38.1) 90 (33.6) Obese (BMI >30) 132 (28.6) 1010 (24.2) 39 (29.8) 705 (25.8) 79 (29.5) >10% weight loss No Yes 397 (98.5) 3730 (96.5) 6 (1.5) 136 (3.5) 109 (90.8) 2388 (93.0) 11 (9.2) 179 (7.0) 216 (87.1) 32 (12.9) <0.001 ECOG performance status 0 359 (76.9) 2903 (67.8) 72 (55.4) 1823 (65.8) 142 (52.0) <0.001 1 78 (16.7) 928 (21.7) 35 (26.9) 573 (20.7) 76 (27.8) 2 25 (5.4) 361 (8.4) 19 (14.6) 319 (11.5) 34 (12.5) 3 3 (0.6) 78 (1.8) 4 (3.1) 52 (1.9) 19 (7.0) 4 2 (0.4) 12 (0.3) 0 (0.0) 5 (0.2) 2 (0.7)
Smoking No, never 354 (76.5) 3373 (78.9) 115 (90.6) 2459 (88.8) 239 (90.9) <0.001 Stopped >6 weeks ago 53 (11.4) 420 (9.8) 9 (7.1) 143 (5.2) 9 (3.4)
Yes, current smoker 56 (12.1) 481 (11.3) 3 (2.4) 167 (6.0) 15 (5.7)
Diabetes No 444 (88.3) 3783 (86.5) 98 (81.0) 2286 (84.1) 228 (84.1) 0.004 Diet 10 (2.0) 64 (1.5) 4 (3.3) 30 (1.1) 6 (2.2) Medication (non-insulin) 39 (7.8) 392 (9.0) 12 (9.9) 285 (10.5) 24 (8.9) Insulin 10 (2.0) 134 (3.1) 7 (5.8) 117 (4.3) 13 (4.8) HIV tested No 456 (89.4) 3572 (79.3) 92 (67.2) 1809 (62.7) 170 (60.7) <0.001 Yes - Negative 52 (10.2) 927 (20.6) 45 (32.8) 1054 (36.6) 110 (39.3) Yes - Positive 2 (0.4) 7 (0.2) 0 (0.0) 20 (0.7) 0 (0.0) Distance to home (km) < 10 km 10-20 km 172 (36.8) 1415 (34.1) 120 (25.6) 909 (21.9) 33 (25.8) 16 (12.5) 617 (22.9) 489 (18.1) 76 (29.5) 52 (20.2) <0.001 20-50 km 96 (20.5) 840 (20.2) 31 (24.2) 532 (19.7) 59 (22.9) 50-100 km 41 (8.8) 415 (10.0) 20 (15.6) 306 (11.4) 22 (8.5) >100 km 39 (8.3) 574 (13.8) 28 (21.9) 751 (27.9) 49 (19.0) Mode of
diagnosis Symptomatic Screening 174 (34.7) 2547 (56.9) 299 (59.7) 1519 (33.9) 120 (89.6) 2302 (80.3) 6 (4.5) 267 (9.3) 220 (78.9) 25 (9.0) <0.001 Detected incidentally 28 (5.6) 410 (9.2) 8 (6.0) 296 (10.3) 34 (12.2)
Urgency Elective 511 (99.4) 4515 (99.6) 133 (97.1) 2872 (99.4) 273 (97.5) <0.001 Emergency 3 (0.6) 19 (0.4) 4 (2.9) 18 (0.6) 7 (2.5)
Treatment
intent Palliative Curative 509 (99.0) 4483 (98.9) 5 (1.0) 50 (1.1) 127 (92.7) 2809 (97.2) 10 (7.3) 81 (2.8) 182 (65.0) 98 (35.0) <0.001 Primary
procedure B27 Mastectomy B28 Partial mastectomy / wide 161 (31.3) 1559 (34.4) 100 (73.0) 1747 (60.5) 193 (69.7) <0.001 local excision / lumpectomy 305 (59.3) 2790 (61.5) 34 (24.8) 1037 (35.9) 61 (22.0)
B32 Open biopsy of breast 21 (4.1) 54 (1.2) 1 (0.7) 15 (0.5) 5 (1.8) B37 Other operations on breast 27 (5.3) 131 (2.9) 2 (1.5) 89 (3.1) 18 (6.5)
SNLB No, not available in this hospital 9 (1.8) 236 (5.3) 12 (9.0) 309 (11.2) 42 (15.9) <0.001 No, but available in this hospital 259 (52.1) 894 (20.1) 89 (66.4) 1784 (64.8) 165 (62.5)
Yes, single technique 131 (26.4) 1825 (41.1) 15 (11.2) 431 (15.7) 45 (17.0) Yes, dual technique 98 (19.7) 1487 (33.5) 18 (13.4) 227 (8.3) 12 (4.5) Axilliary
lymph node dissection
No 467 (91.7) 3263 (73.2) 50 (37.0) 560 (19.9) 57 (21.1) <0.001 Yes 42 (8.3) 1197 (26.8) 85 (63.0) 2254 (80.1) 213 (78.9)
Margin check No, not available in this hospital 23 (4.9) 344 (7.9) 14 (10.4) 307 (11.1) 40 (15.3) <0.001 No, but available in this hospital 193 (41.2) 1927 (44.5) 95 (70.4) 1681 (60.8) 139 (53.3)
Yes, by x-ray 198 (42.2) 1028 (23.7) 6 (4.4) 236 (8.5) 17 (6.5) Yes, by frozen section 55 (11.7) 1034 (23.9) 20 (14.8) 540 (19.5) 65 (24.9) Primary
reconstruction No, not available in this hospital No, but available in this hospital 358 (69.6) 3434 (75.8) 28 (5.4) 306 (6.8) 96 (70.1) 2116 (73.3) 13 (9.5) 307 (10.6) 199 (71.1) 34 (12.1) <0.001 Yes, immediate - prosthesis 52 (10.1) 227 (5.0) 2 (1.5) 117 (4.1) 4 (1.4)
Yes, immediate - flap 59 (11.5) 449 (9.9) 14 (10.2) 237 (8.2) 32 (11.4) Yes, planned at later stage 17 (3.3) 117 (2.6) 12 (8.8) 109 (3.8) 11 (3.9)
Essential TNM Classification of Malignant Tumours (eTNM), as defined by the Union for International Cancer Control (UICC), for
breast cancer:
Tis, No invasive cancer (e.g. DCIS); L1, Tumour £2 cm in size (T1); L2, Tumour >2 cm in size (T2/T3); A, Inflammatory cancer,
chest wall invasion or ulceration present (T4); R1, 1 to 3 nodes involved inside axilla but none outside axilla (N1); R2, >3 nodes
10
involved inside axilla or nodal involvement outside axilla (N2/N3); M+, Metastases present (M1). ASA, American Society of
Anesthesiologists operative risk grade; BMI, body mass index; ECOG, Eastern Cooperative Oncology Group; HIV, human
immunodeficiency virus; SNLB, sentinel lymph node biopsy; SD, standard deviation. Data are n (%).
11
Table S3B. Cancer stage by other predictors (colon).
L
N=1802 N=1386 A N=2128 R+ N=853 M+ p
Age (years) Mean (SD) 66.9 (13.0) 67.1 (13.6) 63.8 (13.8) 63.3 (14.0) <0.001
Sex Male 1026 (57.1) 771 (55.6) 1172 (55.1) 480 (56.4) 0.636 Female 771 (42.9) 615 (44.4) 955 (44.9) 371 (43.6) ASA I 207 (11.7) 193 (14.3) 264 (12.7) 104 (12.5) <0.001 II 892 (50.4) 679 (50.2) 1175 (56.5) 391 (46.9) III 608 (34.4) 426 (31.5) 578 (27.8) 292 (35.0) IV 59 (3.3) 45 (3.3) 60 (2.9) 43 (5.2) V 4 (0.2) 9 (0.7) 4 (0.2) 4 (0.5)
BMI Normal weight (BMI 18.5 to 24.9) 621 (36.5) 570 (43.9) 900 (44.3) 377 (47.7) <0.001 Underweight (BMI < 18.5) 57 (3.4) 69 (5.3) 107 (5.3) 60 (7.6)
Overweight (BMI 25 to 30) 666 (39.2) 449 (34.6) 693 (34.1) 253 (32.0) Obese (BMI >30) 356 (20.9) 210 (16.2) 331 (16.3) 100 (12.7)
>10% weight loss No 1249 (81.0) 846 (70.4) 1248 (65.4) 399 (53.8) <0.001 Yes 293 (19.0) 355 (29.6) 660 (34.6) 342 (46.2)
ECOG performance status 0 963 (56.3) 640 (48.5) 1024 (50.0) 379 (46.3) <0.001
1 454 (26.5) 397 (30.1) 658 (32.1) 231 (28.2)
2 208 (12.2) 178 (13.5) 259 (12.6) 146 (17.8)
3 76 (4.4) 90 (6.8) 102 (5.0) 56 (6.8)
4 10 (0.6) 15 (1.1) 7 (0.3) 7 (0.9)
Smoking No, never 994 (61.8) 818 (66.2) 1283 (65.3) 485 (63.3) 0.154 Stopped >6 weeks ago 390 (24.3) 253 (20.5) 410 (20.9) 176 (23.0)
Yes, current smoker 224 (13.9) 164 (13.3) 271 (13.8) 105 (13.7)
Diabetes No 1405 (80.1) 1096 (81.3) 1681 (80.7) 677 (81.2) 0.331 Diet 41 (2.3) 42 (3.1) 61 (2.9) 15 (1.8) Medication (non-insulin) 220 (12.5) 159 (11.8) 264 (12.7) 107 (12.8) Insulin 89 (5.1) 51 (3.8) 78 (3.7) 35 (4.2) HIV tested No 1630 (90.5) 1151 (83.0) 1760 (82.7) 718 (84.3) <0.001 Yes - Negative 166 (9.2) 232 (16.7) 365 (17.2) 129 (15.1) Yes - Positive 5 (0.3) 3 (0.2) 2 (0.1) 5 (0.6) Distance to home (km) < 10 km 663 (40.2) 458 (36.1) 688 (34.7) 259 (33.0) <0.001 10-20 km 342 (20.7) 296 (23.3) 408 (20.6) 196 (24.9) 20-50 km 355 (21.5) 246 (19.4) 414 (20.9) 166 (21.1) 50-100 km 142 (8.6) 117 (9.2) 180 (9.1) 70 (8.9) >100 km 147 (8.9) 152 (12.0) 290 (14.6) 95 (12.1)
Mode of diagnosis Symptomatic 1101 (62.2) 1140 (82.8) 1815 (85.9) 746 (88.7) <0.001 Screening 478 (27.0) 154 (11.2) 205 (9.7) 54 (6.4)
Detected incidentally 192 (10.8) 82 (6.0) 92 (4.4) 41 (4.9)
Urgency Elective 1661 (92.2) 1191 (85.9) 1888 (88.7) 593 (69.5) <0.001 Emergency 141 (7.8) 195 (14.1) 240 (11.3) 260 (30.5)
Treatment intent Palliative 46 (2.6) 85 (6.1) 129 (6.1) 442 (51.8) <0.001 Curative 1756 (97.4) 1301 (93.9) 1999 (93.9) 411 (48.2)
WHO checklist No, not available in this hospital 145 (8.3) 202 (15.0) 235 (11.4) 99 (11.9) <0.001 No, but available in this hospital 63 (3.6) 67 (5.0) 106 (5.1) 46 (5.5)
Yes 1541 (88.1) 1079 (80.0) 1725 (83.5) 689 (82.6)
Primary procedure T309 Abdomen: Laparotomy with no other procedure 7 (0.4) 5 (0.4) 5 (0.2) 12 (1.4) <0.001 T43 Abdomen: Diagnostic
laparoscopy with no other
procedure 2 (0.1) 0 (0.0) 1 (0.0) 2 (0.2)
G74 Small bowel: Formation of
ileostomy only 5 (0.3) 6 (0.4) 11 (0.5) 24 (2.8) H04 Colon: Total excision of
colon and rectum 13 (0.7) 10 (0.7) 16 (0.8) 10 (1.2) H05 Colon: Total excision of
colon 34 (1.9) 33 (2.4) 37 (1.7) 11 (1.3)
H06 Colon: Extended excision of
right hemicolon 80 (4.4) 89 (6.4) 117 (5.5) 36 (4.2) H07 Colon: Excision of right
hemicolon 588 (32.7) 324 (23.4) 503 (23.6) 166 (19.5) H08 Colon: Excision of
transverse colon 24 (1.3) 14 (1.0) 22 (1.0) 9 (1.1) H09 Colon: Excision of left
hemicolon 142 (7.9) 110 (7.9) 139 (6.5) 54 (6.3) H10 Colon: Excision of sigmoid
12
H11 Colon: Other excision ofcolon 35 (1.9) 38 (2.7) 26 (1.2) 22 (2.6)
H15 Colon: Formation of any
colonic stoma 22 (1.2) 26 (1.9) 53 (2.5) 116 (13.6) H19 Colon: Other open
operations on colon 15 (0.8) 20 (1.4) 20 (0.9) 33 (3.9) H331 Rectum: Abdominoperineal
resection 83 (4.6) 116 (8.4) 217 (10.2) 51 (6.0) H332 Rectum: Resection with
anastomosis of colon to anus 57 (3.2) 28 (2.0) 93 (4.4) 17 (2.0) H333 Rectum: Anterior resection
with anastomosis 334 (18.6) 292 (21.1) 516 (24.3) 119 (14.0) H335 Rectum: Resection with
closure of rectal stump
(Hartmanns) 48 (2.7) 74 (5.3) 120 (5.6) 53 (6.2) H46 Rectum: Other open
operations on rectum 63 (3.5) 24 (1.7) 39 (1.8) 22 (2.6) Approach Open 763 (42.6) 774 (56.1) 1195 (56.3) 597 (70.4) <0.001 Minimally invasive 1027 (57.4) 606 (43.9) 928 (43.7) 251 (29.6) Site Caecum 233 (13.1) 116 (8.4) 196 (9.3) 96 (11.4) <0.001 Ascending colon 385 (21.7) 240 (17.5) 372 (17.6) 129 (15.3) Transverse colon 136 (7.7) 105 (7.6) 127 (6.0) 72 (8.6) Descending colon 125 (7.0) 125 (9.1) 116 (5.5) 61 (7.2) Sigmoid colon 402 (22.6) 310 (22.6) 387 (18.3) 212 (25.2) High rectum (>10 to 15 cm) 178 (10.0) 173 (12.6) 256 (12.1) 111 (13.2) Middle rectum (>5 to 10 cm) 131 (7.4) 131 (9.5) 283 (13.4) 68 (8.1) Low rectum (< =5 cm from anal
verge) 186 (10.5) 173 (12.6) 379 (17.9) 93 (11.0)
Anastomosis Not performed 269 (15.3) 330 (24.3) 495 (23.9) 327 (39.4) <0.001 Handsewn 330 (18.8) 300 (22.1) 391 (18.9) 153 (18.5) Stapled 1161 (66.0) 727 (53.6) 1188 (57.3) 349 (42.1) Pre-op obstruction No 1575 (91.0) 1075 (79.5) 1678 (81.4) 496 (60.0) <0.001 Yes 155 (9.0) 277 (20.5) 383 (18.6) 330 (40.0) Pre-op perforation No 1750 (98.3) 1258 (93.0) 1983 (94.3) 745 (89.1) <0.001 Yes 30 (1.7) 94 (7.0) 120 (5.7) 91 (10.9) Stoma formed No 1338 (75.4) 839 (61.2) 1143 (54.2) 423 (49.9) <0.001 Yes, loop ileostomy 173 (9.8) 173 (12.6) 378 (17.9) 102 (12.0)
Yes, end ileostomy 47 (2.6) 55 (4.0) 80 (3.8) 31 (3.7) Yes, loop colostomy 51 (2.9) 54 (3.9) 122 (5.8) 105 (12.4) Yes, end colostomy 165 (9.3) 251 (18.3) 385 (18.3) 187 (22.1)
Essential TNM Classification of Malignant Tumours (eTNM), as defined by the Union for International Cancer Control (UICC), for
colorectal cancer:
L, Tumour contained within bowel wall with no nodal involvement (Stage I); A, Tumour through bowel wall with no nodal
involvement (Stage II); R+, Regional lymph node involvement (Stage III); M+, Metastases present (Stage IV). ASA, American
Society of Anesthesiologists operative risk grade; BMI, body mass index; ECOG, Eastern Cooperative Oncology Group; HIV, human
immunodeficiency virus; SD, standard deviation. Data are n (%).
13
Table S3C. Cancer stage by other predictors (gastric).
L
N=450 N=235 A N=505 R+ N=133 M+ p
Age (years) Mean (SD) 64.6 (14.4) 62.7 (14.2) 63.1 (13.0) 61.2 (13.8) 0.068
Sex Male 251 (55.8) 152 (64.7) 317 (62.8) 86 (64.7) 0.048 Female 199 (44.2) 83 (35.3) 188 (37.2) 47 (35.3) ASA I 66 (15.0) 38 (16.3) 101 (20.4) 23 (17.7) <0.001 II 222 (50.5) 110 (47.2) 242 (48.8) 60 (46.2) III 142 (32.3) 78 (33.5) 140 (28.2) 34 (26.2) IV 10 (2.3) 7 (3.0) 12 (2.4) 10 (7.7) V 0 (0.0) 0 (0.0) 1 (0.2) 3 (2.3)
BMI Normal weight (BMI 18.5 to 24.9) 203 (47.9) 107 (48.6) 263 (54.0) 69 (54.8) <0.001 Underweight (BMI < 18.5) 25 (5.9) 21 (9.5) 55 (11.3) 22 (17.5)
Overweight (BMI 25 to 30) 134 (31.6) 79 (35.9) 122 (25.1) 29 (23.0) Obese (BMI >30) 62 (14.6) 13 (5.9) 47 (9.7) 6 (4.8)
>10% weight loss No 285 (70.2) 104 (48.4) 202 (43.0) 33 (26.6) <0.001
Yes 121 (29.8) 111 (51.6) 268 (57.0) 91 (73.4)
ECOG performance status 0 241 (55.5) 103 (45.2) 216 (43.7) 42 (32.3) <0.001
1 117 (27.0) 85 (37.3) 176 (35.6) 44 (33.8)
2 53 (12.2) 27 (11.8) 70 (14.2) 23 (17.7)
3 20 (4.6) 12 (5.3) 27 (5.5) 19 (14.6)
4 3 (0.7) 1 (0.4) 5 (1.0) 2 (1.5)
Smoking No, never 241 (62.0) 124 (57.4) 269 (59.1) 65 (58.6) 0.948
Stopped >6 weeks ago 86 (22.1) 55 (25.5) 106 (23.3) 26 (23.4) Yes, current smoker 62 (15.9) 37 (17.1) 80 (17.6) 20 (18.0)
Diabetes No 376 (85.3) 196 (85.2) 417 (84.2) 108 (81.8) 0.962 Diet 8 (1.8) 5 (2.2) 9 (1.8) 1 (0.8) Medication (non-insulin) 41 (9.3) 20 (8.7) 50 (10.1) 16 (12.1) Insulin 16 (3.6) 9 (3.9) 19 (3.8) 7 (5.3) HIV tested No 363 (80.7) 162 (68.9) 364 (72.1) 85 (63.9) 0.001 Yes - Negative 86 (19.1) 73 (31.1) 140 (27.7) 47 (35.3) Yes - Positive 1 (0.2) 0 (0.0) 1 (0.2) 1 (0.8) Distance to home (km) < 10 km 136 (32.9) 53 (24.5) 122 (25.7) 25 (20.7) 0.002 10-20 km 89 (21.5) 41 (19.0) 87 (18.4) 26 (21.5) 20-50 km 75 (18.1) 40 (18.5) 106 (22.4) 24 (19.8) 50-100 km 51 (12.3) 26 (12.0) 40 (8.4) 10 (8.3) >100 km 63 (15.2) 56 (25.9) 119 (25.1) 36 (29.8)
Mode of diagnosis Symptomatic 340 (76.7) 221 (95.7) 475 (95.4) 130 (97.7) <0.001
Screening 31 (7.0) 1 (0.4) 7 (1.4) 1 (0.8)
Detected incidentally 72 (16.3) 9 (3.9) 16 (3.2) 2 (1.5)
Urgency Elective 436 (96.9) 220 (93.6) 474 (93.9) 113 (85.0) <0.001
Emergency 14 (3.1) 15 (6.4) 31 (6.1) 20 (15.0)
Treatment intent Palliative 17 (3.8) 23 (9.8) 65 (12.9) 89 (66.9) <0.001 Curative 433 (96.2) 212 (90.2) 440 (87.1) 44 (33.1)
WHO checklist No, not available in this hospital 49 (11.3) 31 (13.4) 48 (9.8) 10 (7.9) 0.114 No, but available in this hospital 18 (4.1) 20 (8.7) 24 (4.9) 8 (6.3)
Yes 367 (84.6) 180 (77.9) 417 (85.3) 108 (85.7)
Primary procedure T309 Abdomen: Laparotomy with no other procedure 7 (1.6) 4 (1.7) 13 (2.6) 13 (9.8) <0.001 T43 Abdomen: Diagnostic
laparoscopy with no other procedure 7 (1.6) 6 (2.6) 9 (1.8) 5 (3.8) G27 Stomach: Total excision of
stomach 131 (29.1) 93 (39.6) 214 (42.4) 30 (22.6) G28 Stomach: Partial excision of
stomach 265 (58.9) 102 (43.4) 207 (41.0) 36 (27.1) G32 Stomach: Connection of
stomach to jejunum 17 (3.8) 20 (8.5) 42 (8.3) 35 (26.3) G38 Stomach: Other open
operations on stomach 23 (5.1) 10 (4.3) 20 (4.0) 14 (10.5)
Approach Open 280 (62.5) 182 (77.8) 413 (81.8) 117 (88.0) <0.001
Minimally invasive 168 (37.5) 52 (22.2) 92 (18.2) 16 (12.0)
Site Upper third (cardia/fundus) 87 (19.7) 39 (17.1) 109 (22.0) 25 (19.8) 0.125 Middle third (body) 104 (23.5) 39 (17.1) 90 (18.2) 20 (15.9)
Distal third (antrium/pylorus) 195 (44.1) 109 (47.8) 210 (42.4) 56 (44.4) Entire stomach 56 (12.7) 41 (18.0) 86 (17.4) 25 (19.8)
Anastomosis Not performed 83 (18.9) 29 (12.8) 38 (7.7) 28 (21.7) <0.001 Handsewn 116 (26.4) 81 (35.7) 152 (30.9) 54 (41.9) Stapled 241 (54.8) 117 (51.5) 302 (61.4) 47 (36.4) D2 resection No 205 (49.0) 97 (43.3) 166 (34.2) 87 (69.6) <0.001 Yes 213 (51.0) 127 (56.7) 320 (65.8) 38 (30.4) Pre-op obstruction No 409 (93.4) 200 (87.0) 421 (84.7) 71 (55.9) <0.001 Yes 29 (6.6) 30 (13.0) 76 (15.3) 56 (44.1) Pre-op perforation No 436 (98.9) 223 (96.5) 477 (95.8) 120 (91.6) 0.001 Yes 5 (1.1) 8 (3.5) 21 (4.2) 11 (8.4)
14
Essential TNM Classification of Malignant Tumours (eTNM), as defined by the Union for International Cancer Control (UICC), for
gastric cancer:
L, Tumour contained within stomach wall with no nodal involvement (Stage I); A, Tumour through stomach wall with no nodal
involvement (Stage II); R+, Regional lymph node involvement (Stage III); M+, Metastases present (Stage IV). ASA, American
Society of Anesthesiologists operative risk grade; BMI, body mass index; ECOG, Eastern Cooperative Oncology Group; HIV, human
immunodeficiency virus; SD, standard deviation. Data are n (%).
15
Figure S6A. Comparison between preoperative clinical and postoperative final pathological staging.
Preoperative clinical staging performed using Essential TNM Classification of Malignant Tumours (eTNM), as defined by the Union
for International Cancer Control (UICC).
16
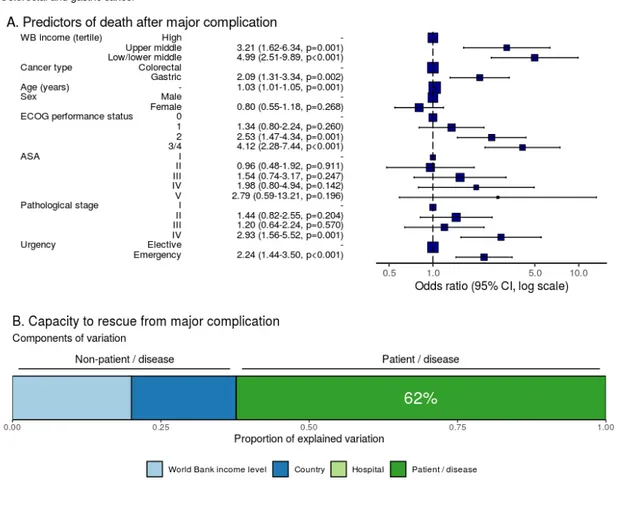
Figure S6B. Capacity to rescue from major complication: sensitivity analysis using postoperative final pathological staging.
A,
multilevel logistic regression model for predictors of death after major complication in colorectal and gastric cancer. B,
proportion of 30-day mortality variation explained at the level of patient/disease, hospital, country, and country income group,
in patients with colorectal or gastric cancer who died after major complication. The “variance explained” at each of the 4
levels of the model (marginal pseudo-R
2) is expressed as a proportion of the total “variance explained” (conditional
17
Table S4A. Surgical procedure (breast).
High Upper middle Low/lower middle
N=4220 N=1319 N=2867
Mode of diagnosis Symptomatic 2073 (49.1) 935 (70.9) 2397 (83.6)
Screening 1831 (43.4) 177 (13.4) 115 (4.0) Detected incidentally 243 (5.8) 196 (14.9) 338 (11.8) (Missing) 73 (1.7) 11 (0.8) 17 (0.6) Urgency Elective 4200 (99.5) 1309 (99.2) 2842 (99.1) Emergency 19 (0.5) 10 (0.8) 22 (0.8) (Missing) 1 (0.0) 0 (0.0) 3 (0.1)
Treatment intent Palliative 50 (1.2) 70 (5.3) 126 (4.4)
Curative 4168 (98.8) 1249 (94.7) 2738 (95.5)
(Missing) 2 (0.0) 0 (0.0) 3 (0.1)
WHO checklist No, not available in this hospital 191 (4.5) 91 (6.9) 314 (11.0) No, but available in this hospital 206 (4.9) 76 (5.8) 164 (5.7)
Yes 3616 (85.7) 1138 (86.3) 2358 (82.2)
(Missing) 207 (4.9) 14 (1.1) 31 (1.1)
Primary procedure B27 Mastectomy 1257 (29.8) 869 (65.9) 1658 (57.8)
B28 Partial mastectomy / wide local excision / lumpectomy 2766 (65.5) 370 (28.1) 1109 (38.7)
B32 Open biopsy of breast 58 (1.4) 22 (1.7) 16 (0.6)
B37 Other operations on breast 137 (3.2) 57 (4.3) 78 (2.7)
(Missing) 2 (0.0) 1 (0.1) 6 (0.2)
SNLB No, not available in this hospital 33 (0.8) 279 (21.2) 303 (10.6)
No, but available in this hospital 1021 (24.2) 503 (38.1) 1690 (58.9)
Yes, single technique 1656 (39.2) 301 (22.8) 504 (17.6)
Yes, dual technique 1446 (34.3) 206 (15.6) 192 (6.7)
(Missing) 64 (1.5) 30 (2.3) 178 (6.2)
Axillary lymph node dissection No 3177 (75.3) 479 (36.3) 770 (26.9)
Yes 998 (23.6) 820 (62.2) 1989 (69.4)
(Missing) 45 (1.1) 20 (1.5) 108 (3.8)
Margin check No, not available in this hospital 199 (4.7) 289 (21.9) 246 (8.6) No, but available in this hospital 1664 (39.4) 562 (42.6) 1840 (64.2)
Yes, by x-ray 1412 (33.5) 17 (1.3) 58 (2.0)
Yes, by frozen section 678 (16.1) 416 (31.5) 624 (21.8)
(Missing) 267 (6.3) 35 (2.7) 99 (3.5)
Primary reconstruction No, not available in this hospital 190 (4.5) 243 (18.4) 260 (9.1) No, but available in this hospital 3170 (75.1) 816 (61.9) 2256 (78.7)
Yes, immediate - prosthesis 243 (5.8) 118 (8.9) 41 (1.4)
Yes, immediate - flap 466 (11.0) 125 (9.5) 202 (7.0)
Yes, planned at later stage 146 (3.5) 16 (1.2) 105 (3.7)
(Missing) 5 (0.1) 1 (0.1) 3 (0.1)
18
Table S4B. Surgical procedure (colorectal).
High
N=4174 Upper middle N=1113 Low/lower middle N=928
Mode of diagnosis Symptomatic 2939 (70.4) 1012 (90.9) 887 (95.6)
Screening 841 (20.1) 43 (3.9) 10 (1.1)
Detected incidentally 334 (8.0) 52 (4.7) 26 (2.8)
(Missing) 60 (1.4) 6 (0.5) 5 (0.5)
Urgency Elective 3644 (87.3) 952 (85.5) 773 (83.3)
Emergency 530 (12.7) 161 (14.5) 155 (16.7)
Treatment intent Palliative 367 (8.8) 177 (15.9) 165 (17.8)
Curative 3807 (91.2) 936 (84.1) 763 (82.2)
WHO checklist No, not available in this hospital 241 (5.8) 293 (26.3) 148 (15.9)
No, but available in this hospital 152 (3.6) 43 (3.9) 89 (9.6)
Yes 3649 (87.4) 755 (67.8) 673 (72.5)
(Missing) 132 (3.2) 22 (2.0) 18 (1.9)
Primary procedure T309 Abdomen: Laparotomy with no other procedure 12 (0.3) 4 (0.4) 13 (1.4) T43 Abdomen: Diagnostic laparoscopy with no other procedure 4 (0.1) 0 (0.0) 1 (0.1) G74 Small bowel: Formation of ileostomy only 26 (0.6) 15 (1.3) 5 (0.5) H04 Colon: Total excision of colon and rectum 25 (0.6) 10 (0.9) 14 (1.5)
H05 Colon: Total excision of colon 77 (1.8) 23 (2.1) 20 (2.2)
H06 Colon: Extended excision of right hemicolon 207 (5.0) 37 (3.3) 81 (8.7) H07 Colon: Excision of right hemicolon 1240 (29.7) 197 (17.7) 157 (16.9) H08 Colon: Excision of transverse colon 45 (1.1) 13 (1.2) 12 (1.3)
H09 Colon: Excision of left hemicolon 300 (7.2) 81 (7.3) 69 (7.4)
H10 Colon: Excision of sigmoid colon 436 (10.4) 150 (13.5) 132 (14.2)
H11 Colon: Other excision of colon 97 (2.3) 13 (1.2) 13 (1.4)
H15 Colon: Formation of any colonic stoma 105 (2.5) 47 (4.2) 67 (7.2) H19 Colon: Other open operations on colon 49 (1.2) 32 (2.9) 7 (0.8) H331 Rectum: Abdominoperineal resection 260 (6.2) 97 (8.7) 114 (12.3) H332 Rectum: Resection with anastomosis of colon to anus 114 (2.7) 43 (3.9) 38 (4.1) H333 Rectum: Anterior resection with anastomosis 865 (20.7) 274 (24.6) 125 (13.5) H335 Rectum: Resection with closure of rectal stump (Hartmann’s) 196 (4.7) 59 (5.3) 42 (4.5) H46 Rectum: Other open operations on rectum 115 (2.8) 17 (1.5) 16 (1.7)
(Missing) 1 (0.0) 1 (0.1) 2 (0.2)
Approach Open 1729 (41.4) 681 (61.2) 654 (70.5)
Laparoscopic (+/- open specimen extraction) 2092 (50.1) 363 (32.6) 233 (25.1)
Laparoscopic converted to open 213 (5.1) 46 (4.1) 39 (4.2)
Robotic 113 (2.7) 22 (2.0) 0 (0.0)
Robotic converted to open 2 (0.0) 0 (0.0) 0 (0.0)
(Missing) 25 (0.6) 1 (0.1) 2 (0.2) Site Caecum 494 (11.8) 82 (7.4) 72 (7.8) Ascending colon 832 (19.9) 152 (13.7) 153 (16.5) Transverse colon 319 (7.6) 65 (5.8) 63 (6.8) Descending colon 273 (6.5) 77 (6.9) 80 (8.6) Sigmoid colon 830 (19.9) 274 (24.6) 212 (22.8) High rectum (>10 to 15 cm) 473 (11.3) 156 (14.0) 93 (10.0) Middle rectum (>5 to 10 cm) 411 (9.8) 134 (12.0) 70 (7.5)
Low rectum (< =5 cm from anal verge) 505 (12.1) 158 (14.2) 173 (18.6)
(Missing) 37 (0.9) 15 (1.3) 12 (1.3)
Anastomosis Not performed 872 (20.9) 293 (26.3) 265 (28.6)
Handsewn 664 (15.9) 222 (19.9) 296 (31.9) Stapled 2555 (61.2) 575 (51.7) 319 (34.4) (Missing) 83 (2.0) 23 (2.1) 48 (5.2) Pre-op obstruction No 3366 (80.6) 836 (75.1) 656 (70.7) Yes 653 (15.6) 260 (23.4) 242 (26.1) (Missing) 155 (3.7) 17 (1.5) 30 (3.2) Pre-op perforation No 3891 (93.2) 1028 (92.4) 852 (91.8) Yes 228 (5.5) 69 (6.2) 46 (5.0) (Missing) 55 (1.3) 16 (1.4) 30 (3.2) Stoma formed No 2750 (65.9) 561 (50.4) 460 (49.6)
Yes, loop ileostomy 512 (12.3) 196 (17.6) 123 (13.3)
Yes, end ileostomy 130 (3.1) 53 (4.8) 31 (3.3)
Yes, loop colostomy 161 (3.9) 82 (7.4) 92 (9.9)
Yes, end colostomy 597 (14.3) 204 (18.3) 193 (20.8)
(Missing) 24 (0.6) 17 (1.5) 29 (3.1)
19
Table S4C. Surgical procedure (gastric).
N=712 High Upper middle N=289 Low/lower middle N=336
Mode of diagnosis Symptomatic 577 (81.0) 272 (94.1) 326 (97.0)
Screening 35 (4.9) 5 (1.7) 1 (0.3) Detected incidentally 85 (11.9) 9 (3.1) 7 (2.1) (Missing) 15 (2.1) 3 (1.0) 2 (0.6) Urgency Elective 681 (95.6) 273 (94.5) 300 (89.3) Emergency 30 (4.2) 16 (5.5) 36 (10.7) (Missing) 1 (0.1) 0 (0.0) 0 (0.0)
Treatment intent Palliative 79 (11.1) 45 (15.6) 71 (21.1)
Curative 632 (88.8) 244 (84.4) 265 (78.9)
(Missing) 1 (0.1) 0 (0.0) 0 (0.0)
WHO checklist No, not available in this hospital 65 (9.1) 38 (13.1) 35 (10.4)
No, but available in this hospital 32 (4.5) 3 (1.0) 37 (11.0)
Yes 579 (81.3) 243 (84.1) 261 (77.7)
(Missing) 36 (5.1) 5 (1.7) 3 (0.9)
Primary procedure T309 Abdomen: Laparotomy with no other procedure 12 (1.7) 11 (3.8) 14 (4.2) T43 Abdomen: Diagnostic laparoscopy with no other procedure 14 (2.0) 8 (2.8) 6 (1.8) G27 Stomach: Total excision of stomach 269 (37.8) 117 (40.5) 84 (25.0) G28 Stomach: Partial excision of stomach 338 (47.5) 126 (43.6) 154 (45.8) G32 Stomach: Connection of stomach to jejunum 52 (7.3) 18 (6.2) 46 (13.7) G38 Stomach: Other open operations on stomach 26 (3.7) 9 (3.1) 32 (9.5)
(Missing) 1 (0.1) 0 (0.0) 0 (0.0)
Approach Open 435 (61.1) 225 (77.9) 284 (84.5)
Laparoscopic (+/- open specimen extraction) 242 (34.0) 49 (17.0) 28 (8.3)
Laparoscopic converted to open 23 (3.2) 12 (4.2) 24 (7.1)
Robotic 8 (1.1) 3 (1.0) 0 (0.0)
Robotic converted to open 0 (0.0) 0 (0.0) 0 (0.0)
(Missing) 4 (0.6) 0 (0.0) 0 (0.0)
Site Upper third (cardia/fundus) 142 (19.9) 45 (15.6) 73 (21.7)
Middle third (body) 172 (24.2) 49 (17.0) 34 (10.1)
Distal third (antrum/pylorus) 291 (40.9) 120 (41.5) 167 (49.7)
Entire stomach 95 (13.3) 67 (23.2) 49 (14.6)
(Missing) 12 (1.7) 8 (2.8) 13 (3.9)
Anastomosis Not performed 106 (14.9) 31 (10.7) 44 (13.1)
Handsewn 146 (20.5) 86 (29.8) 172 (51.2) Stapled 448 (62.9) 162 (56.1) 106 (31.5) (Missing) 12 (1.7) 10 (3.5) 14 (4.2) D2 resection No 309 (43.4) 92 (31.8) 156 (46.4) Yes 369 (51.8) 185 (64.0) 154 (45.8) (Missing) 34 (4.8) 12 (4.2) 26 (7.7) Pre-op obstruction No 619 (86.9) 254 (87.9) 239 (71.1) Yes 81 (11.4) 29 (10.0) 83 (24.7) (Missing) 12 (1.7) 6 (2.1) 14 (4.2) Pre-op perforation No 683 (95.9) 278 (96.2) 307 (91.4) Yes 24 (3.4) 8 (2.8) 14 (4.2) (Missing) 5 (0.7) 3 (1.0) 15 (4.5)
20
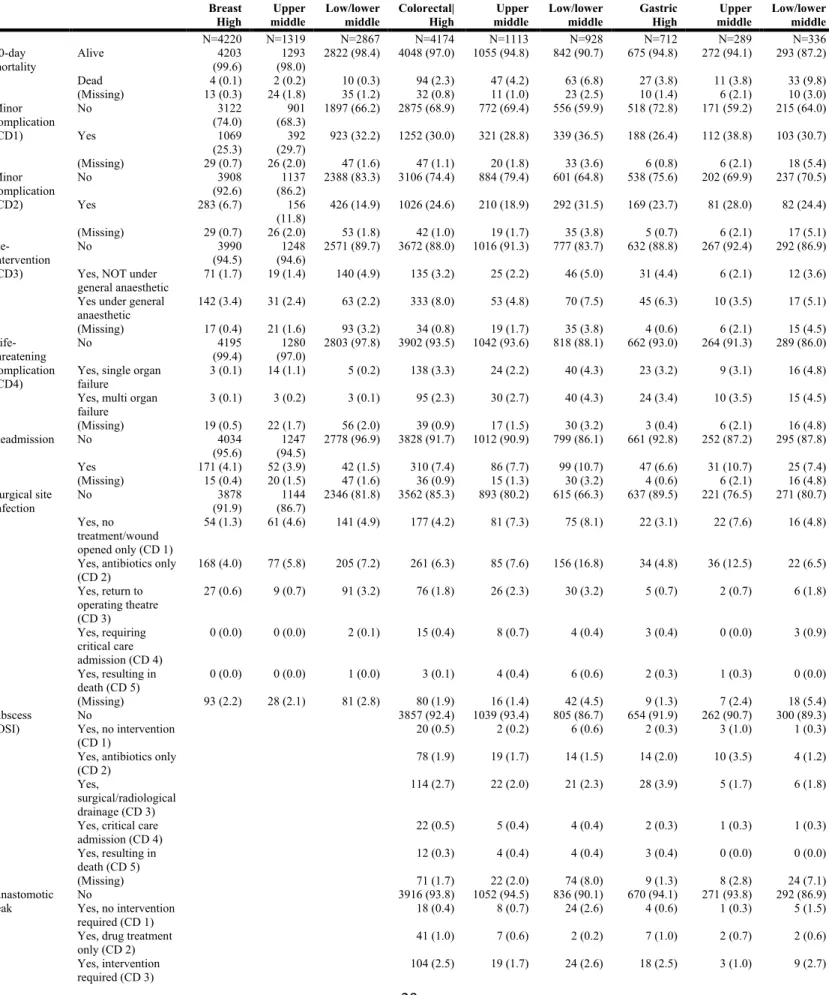
Table S5. Detailed outcomes stratified by cancer and country income level.
Breast High Breast Upper middle Breast Low/lower
middle Colorectal| High
Colorectal Upper middle
Colorectal Low/lower
middle Gastric High
Gastric Upper middle Gastric Low/lower middle N=4220 N=1319 N=2867 N=4174 N=1113 N=928 N=712 N=289 N=336 30-day mortality Alive (99.6) 4203 (98.0) 1293 2822 (98.4) 4048 (97.0) 1055 (94.8) 842 (90.7) 675 (94.8) 272 (94.1) 293 (87.2) Dead 4 (0.1) 2 (0.2) 10 (0.3) 94 (2.3) 47 (4.2) 63 (6.8) 27 (3.8) 11 (3.8) 33 (9.8) (Missing) 13 (0.3) 24 (1.8) 35 (1.2) 32 (0.8) 11 (1.0) 23 (2.5) 10 (1.4) 6 (2.1) 10 (3.0) Minor complication (CD1) No 3122 (74.0) (68.3) 901 1897 (66.2) 2875 (68.9) 772 (69.4) 556 (59.9) 518 (72.8) 171 (59.2) 215 (64.0) Yes 1069 (25.3) (29.7) 392 923 (32.2) 1252 (30.0) 321 (28.8) 339 (36.5) 188 (26.4) 112 (38.8) 103 (30.7) (Missing) 29 (0.7) 26 (2.0) 47 (1.6) 47 (1.1) 20 (1.8) 33 (3.6) 6 (0.8) 6 (2.1) 18 (5.4) Minor complication (CD2) No 3908 (92.6) (86.2) 1137 2388 (83.3) 3106 (74.4) 884 (79.4) 601 (64.8) 538 (75.6) 202 (69.9) 237 (70.5) Yes 283 (6.7) 156 (11.8) 426 (14.9) 1026 (24.6) 210 (18.9) 292 (31.5) 169 (23.7) 81 (28.0) 82 (24.4) (Missing) 29 (0.7) 26 (2.0) 53 (1.8) 42 (1.0) 19 (1.7) 35 (3.8) 5 (0.7) 6 (2.1) 17 (5.1) Re-intervention (CD3) No 3990 (94.5) (94.6) 1248 2571 (89.7) 3672 (88.0) 1016 (91.3) 777 (83.7) 632 (88.8) 267 (92.4) 292 (86.9) Yes, NOT under
general anaesthetic 71 (1.7) 19 (1.4) 140 (4.9) 135 (3.2) 25 (2.2) 46 (5.0) 31 (4.4) 6 (2.1) 12 (3.6) Yes under general
anaesthetic 142 (3.4) 31 (2.4) 63 (2.2) 333 (8.0) 53 (4.8) 70 (7.5) 45 (6.3) 10 (3.5) 17 (5.1) (Missing) 17 (0.4) 21 (1.6) 93 (3.2) 34 (0.8) 19 (1.7) 35 (3.8) 4 (0.6) 6 (2.1) 15 (4.5) Life-threatening complication (CD4) No 4195 (99.4) (97.0) 1280 2803 (97.8) 3902 (93.5) 1042 (93.6) 818 (88.1) 662 (93.0) 264 (91.3) 289 (86.0) Yes, single organ
failure 3 (0.1) 14 (1.1) 5 (0.2) 138 (3.3) 24 (2.2) 40 (4.3) 23 (3.2) 9 (3.1) 16 (4.8) Yes, multi organ
failure 3 (0.1) 3 (0.2) 3 (0.1) 95 (2.3) 30 (2.7) 40 (4.3) 24 (3.4) 10 (3.5) 15 (4.5) (Missing) 19 (0.5) 22 (1.7) 56 (2.0) 39 (0.9) 17 (1.5) 30 (3.2) 3 (0.4) 6 (2.1) 16 (4.8) Readmission No 4034 (95.6) (94.5) 1247 2778 (96.9) 3828 (91.7) 1012 (90.9) 799 (86.1) 661 (92.8) 252 (87.2) 295 (87.8) Yes 171 (4.1) 52 (3.9) 42 (1.5) 310 (7.4) 86 (7.7) 99 (10.7) 47 (6.6) 31 (10.7) 25 (7.4) (Missing) 15 (0.4) 20 (1.5) 47 (1.6) 36 (0.9) 15 (1.3) 30 (3.2) 4 (0.6) 6 (2.1) 16 (4.8) Surgical site infection No (91.9) 3878 (86.7) 1144 2346 (81.8) 3562 (85.3) 893 (80.2) 615 (66.3) 637 (89.5) 221 (76.5) 271 (80.7) Yes, no treatment/wound opened only (CD 1) 54 (1.3) 61 (4.6) 141 (4.9) 177 (4.2) 81 (7.3) 75 (8.1) 22 (3.1) 22 (7.6) 16 (4.8) Yes, antibiotics only
(CD 2) 168 (4.0) 77 (5.8) 205 (7.2) 261 (6.3) 85 (7.6) 156 (16.8) 34 (4.8) 36 (12.5) 22 (6.5) Yes, return to operating theatre (CD 3) 27 (0.6) 9 (0.7) 91 (3.2) 76 (1.8) 26 (2.3) 30 (3.2) 5 (0.7) 2 (0.7) 6 (1.8) Yes, requiring critical care admission (CD 4) 0 (0.0) 0 (0.0) 2 (0.1) 15 (0.4) 8 (0.7) 4 (0.4) 3 (0.4) 0 (0.0) 3 (0.9) Yes, resulting in death (CD 5) 0 (0.0) 0 (0.0) 1 (0.0) 3 (0.1) 4 (0.4) 6 (0.6) 2 (0.3) 1 (0.3) 0 (0.0) (Missing) 93 (2.2) 28 (2.1) 81 (2.8) 80 (1.9) 16 (1.4) 42 (4.5) 9 (1.3) 7 (2.4) 18 (5.4) Abscess
(OSI) No Yes, no intervention 3857 (92.4) 1039 (93.4) 805 (86.7) 654 (91.9) 262 (90.7) 300 (89.3)
(CD 1) 20 (0.5) 2 (0.2) 6 (0.6) 2 (0.3) 3 (1.0) 1 (0.3)
Yes, antibiotics only
(CD 2) 78 (1.9) 19 (1.7) 14 (1.5) 14 (2.0) 10 (3.5) 4 (1.2)
Yes,
surgical/radiological drainage (CD 3)
114 (2.7) 22 (2.0) 21 (2.3) 28 (3.9) 5 (1.7) 6 (1.8) Yes, critical care
admission (CD 4) 22 (0.5) 5 (0.4) 4 (0.4) 2 (0.3) 1 (0.3) 1 (0.3)
Yes, resulting in
death (CD 5) 12 (0.3) 4 (0.4) 4 (0.4) 3 (0.4) 0 (0.0) 0 (0.0)
(Missing) 71 (1.7) 22 (2.0) 74 (8.0) 9 (1.3) 8 (2.8) 24 (7.1)
Anastomotic
leak No Yes, no intervention 3916 (93.8) 1052 (94.5) 836 (90.1) 670 (94.1) 271 (93.8) 292 (86.9)
required (CD 1) 18 (0.4) 8 (0.7) 24 (2.6) 4 (0.6) 1 (0.3) 5 (1.5)
Yes, drug treatment
only (CD 2) 41 (1.0) 7 (0.6) 2 (0.2) 7 (1.0) 2 (0.7) 2 (0.6)
Yes, intervention
21
Yes, critical careadmission &/or intervention (CD 4) 61 (1.5) 8 (0.7) 7 (0.8) 7 (1.0) 3 (1.0) 7 (2.1) Yes, resulting in death (CD 5) 11 (0.3) 5 (0.4) 3 (0.3) 3 (0.4) 2 (0.7) 0 (0.0) (Missing) 23 (0.6) 14 (1.3) 32 (3.4) 3 (0.4) 7 (2.4) 21 (6.2) Post-operative bleed No 4015 (95.1) (91.6) 1208 2752 (96.0) 3941 (94.4) 1041 (93.5) 856 (92.2) 671 (94.2) 237 (82.0) 302 (89.9) Yes, no intervention required (CD 1) 102 (2.4) 74 (5.6) 45 (1.6) 56 (1.3) 35 (3.1) 17 (1.8) 8 (1.1) 27 (9.3) 5 (1.5) Yes, transfusion only (CD 2) 8 (0.2) 1 (0.1) 13 (0.5) 87 (2.1) 18 (1.6) 10 (1.1) 15 (2.1) 13 (4.5) 2 (0.6) Yes, surgical/radiological intervention required (CD 3) 61 (1.4) 12 (0.9) 17 (0.6) 38 (0.9) 5 (0.4) 7 (0.8) 5 (0.7) 0 (0.0) 2 (0.6)
Yes, critical care admission &/or intervention (CD 4) 0 (0.0) 1 (0.1) 0 (0.0) 10 (0.2) 3 (0.3) 6 (0.6) 6 (0.8) 3 (1.0) 5 (1.5) Yes, resulting in death (CD 5) 0 (0.0) 0 (0.0) 1 (0.0) 4 (0.1) 2 (0.2) 3 (0.3) 3 (0.4) 1 (0.3) 2 (0.6) (Missing) 34 (0.8) 23 (1.7) 39 (1.4) 38 (0.9) 9 (0.8) 29 (3.1) 4 (0.6) 8 (2.8) 18 (5.4) Seroma No 3340 (79.1) (78.8) 1039 2040 (71.2) 0 (0.0) 0 (0.0) 0 (0.0) 0 (0.0) 0 (0.0) 0 (0.0) Yes, no intervention/aspirati on only (CD 1) 653 (15.5) (15.6) 206 552 (19.3) Yes, antibiotic treatment only (CD 2) 45 (1.1) 33 (2.5) 35 (1.2) Yes, intervention required (CD 3) 62 (1.5) 9 (0.7) 62 (2.2) Yes, critical care
admission &/or intervention (CD 4) 0 (0.0) 0 (0.0) 0 (0.0) Yes, resulting in death (CD 5) 0 (0.0) 0 (0.0) 0 (0.0) (Missing) 120 (2.8) 32 (2.4) 178 (6.2) Length of
Stay (days) Mean (SD) 1.8 (2.3) 3.1 (3.1) 2.7 (3.7) 10.1 (8.8) 8.9 (6.8) 9.0 (7.1) 12.0 (31.3) 9.9 (6.2) 10.3 (7.0)
CD, Clavien-Dindo complication grade. OSI, organ space infection.
22
Table S6A. Breast cancer logistic regression analyses: 30-day mortality.
Dependent:
30-day mortality Alive Dead OR (univariable) (multivariable) OR
OR (multivariable reduced) OR (multilevel) WB income (tertile) High 4203 (99.9) 4 (0.1) - - - - Upper middle 1293 (99.8) 2 (0.2) 1.63 (0.23-8.34, p=0.575) 1.41 (0.17-8.66, p=0.721) 1.79 (0.24-9.76, p=0.518) 1.90 (0.07-50.90, p=0.702) Low/lower middle 2822 (99.6) 10 (0.4) 3.72 (1.24-13.58, p=0.026) 15.53, p=0.127) 3.19 (0.75- 4.32 (1.18-18.27, p=0.033) 8.46 (0.66-108.04, p=0.100) Age (years) Mean (SD) 0.0 (1.0) 0.5 (1.0) 1.67 (1.02-2.77,
p=0.042) 1.61 (0.88-3.09, p=0.138) 1.63 (0.92-2.99, p=0.105) 2.10 (1.03-4.28, p=0.041) >10% weight loss No 6815 (99.9) 10 (0.1) - - - - Yes 362 (99.5) 2 (0.5) 3.77 (0.58-14.35, p=0.088) 1.32 (0.17-6.34, p=0.758) - - (Missing) 1141 (99.7) 4 (0.3) 2.39 (0.65-7.16, p=0.142) 2.46 (0.53-8.65, p=0.192) - - ECOG performance status 0 5276 (99.9) 4 (0.1) - - - - 1 1688 (99.6) 6 (0.4) 4.69 (1.34-18.36, p=0.017) 11.75, p=0.140) 2.79 (0.70- 3.55 (0.98-14.35, p=0.056) 4.34 (1.04-18.11, p=0.044) 2 748 (99.9) 1 (0.1) 1.76 (0.09-11.94, p=0.612) 1.08 (0.05-7.79, p=0.946) 1.18 (0.06-8.37, p=0.883) 0.69 (0.05-9.63, p=0.782) 3/4 172 (97.7) 4 (2.3) 30.67 (7.20-130.70, p<0.001) 58.54, p=0.004) 11.02 (2.03- 11.16 (2.16-57.05, p=0.003) 114.76, p=0.008) 15.38 (2.06-Diabetes No 6811 (99.8) 11 (0.2) - - - - Yes 1139 (99.7) 4 (0.3) 2.17 (0.60-6.37, p=0.184) 1.37 (0.35-4.44, p=0.617) 1.19 (0.32-3.71, p=0.775) 1.02 (0.24-4.39, p=0.975) Urgency Elective 8270 (99.8) 15 (0.2) - - - - Emergency 48 (98.0) 1 (2.0) 11.49 (0.63-58.43, p=0.019) 33.88, p=0.179) 4.92 (0.23- - -
Treatment intent Palliative 239 (98.4) 4 (1.6) - - - -
Curative 8078 (99.9) 12 (0.1) 0.09 (0.03-0.32, p<0.001) 0.36 (0.08-1.90, p=0.196) 0.20 (0.06-0.83, p=0.016) 0.14 (0.03-0.63, p=0.011) Stage 0 509 (99.8) 1 (0.2) - - - - I 4504 (99.9) 3 (0.1) 0.34 (0.04-6.86, p=0.349) 0.24 (0.03-4.97, p=0.226) - - II 134 (99.3) 1 (0.7) 3.80 (0.15-96.48, p=0.346) 39.74, p=0.828) 1.39 (0.05- - - III 2859 (99.8) 6 (0.2) 1.07 (0.18-20.20, p=0.951) 13.66, p=0.720) 0.66 (0.09- - - IV 271 (98.9) 3 (1.1) 5.63 (0.72-114.21, p=0.135) 26.27, p=0.983) 1.03 (0.08- - -
OR, odds ratio; WB, World Bank; ECOG, Eastern Cooperative Oncology Group; SD, standard deviation. Data are n (%) and OR
(95% confidence interval, p-value). Multilevel model includes hospital and country as random intercepts.
23
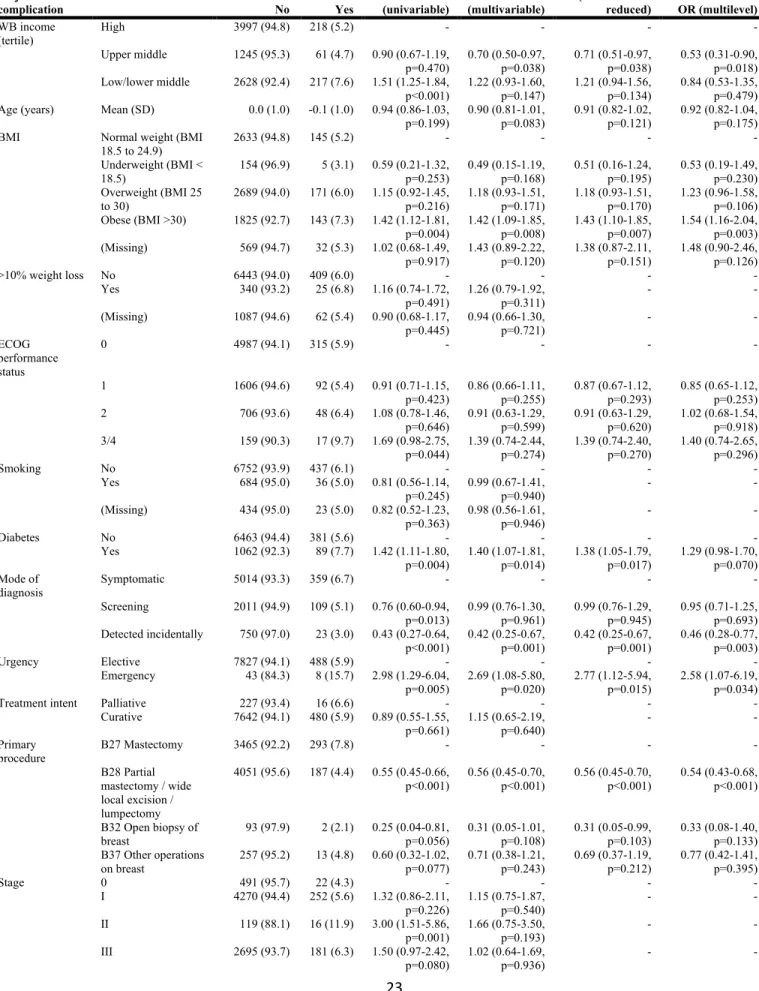
Table S6B. Breast cancer logistic regression analyses: major complication.
Dependent: Major
complication No Yes (univariable) OR (multivariable) OR
OR (multivariable reduced) OR (multilevel) WB income (tertile) High 3997 (94.8) 218 (5.2) - - - - Upper middle 1245 (95.3) 61 (4.7) 0.90 (0.67-1.19, p=0.470) 0.70 (0.50-0.97, p=0.038) 0.71 (0.51-0.97, p=0.038) 0.53 (0.31-0.90, p=0.018) Low/lower middle 2628 (92.4) 217 (7.6) 1.51 (1.25-1.84, p<0.001) 1.22 (0.93-1.60, p=0.147) 1.21 (0.94-1.56, p=0.134) 0.84 (0.53-1.35, p=0.479) Age (years) Mean (SD) 0.0 (1.0) -0.1 (1.0) 0.94 (0.86-1.03,
p=0.199) 0.90 (0.81-1.01, p=0.083) 0.91 (0.82-1.02, p=0.121) 0.92 (0.82-1.04, p=0.175) BMI Normal weight (BMI
18.5 to 24.9) 2633 (94.8) 145 (5.2) - - - - Underweight (BMI < 18.5) 154 (96.9) 5 (3.1) 0.59 (0.21-1.32, p=0.253) 0.49 (0.15-1.19, p=0.168) 0.51 (0.16-1.24, p=0.195) 0.53 (0.19-1.49, p=0.230) Overweight (BMI 25 to 30) 2689 (94.0) 171 (6.0) 1.15 (0.92-1.45, p=0.216) 1.18 (0.93-1.51, p=0.171) 1.18 (0.93-1.51, p=0.170) 1.23 (0.96-1.58, p=0.106) Obese (BMI >30) 1825 (92.7) 143 (7.3) 1.42 (1.12-1.81, p=0.004) 1.42 (1.09-1.85, p=0.008) 1.43 (1.10-1.85, p=0.007) 1.54 (1.16-2.04, p=0.003) (Missing) 569 (94.7) 32 (5.3) 1.02 (0.68-1.49, p=0.917) 1.43 (0.89-2.22, p=0.120) 1.38 (0.87-2.11, p=0.151) 1.48 (0.90-2.46, p=0.126) >10% weight loss No 6443 (94.0) 409 (6.0) - - - - Yes 340 (93.2) 25 (6.8) 1.16 (0.74-1.72, p=0.491) 1.26 (0.79-1.92, p=0.311) - - (Missing) 1087 (94.6) 62 (5.4) 0.90 (0.68-1.17, p=0.445) 0.94 (0.66-1.30, p=0.721) - - ECOG performance status 0 4987 (94.1) 315 (5.9) - - - - 1 1606 (94.6) 92 (5.4) 0.91 (0.71-1.15, p=0.423) 0.86 (0.66-1.11, p=0.255) 0.87 (0.67-1.12, p=0.293) 0.85 (0.65-1.12, p=0.253) 2 706 (93.6) 48 (6.4) 1.08 (0.78-1.46, p=0.646) 0.91 (0.63-1.29, p=0.599) 0.91 (0.63-1.29, p=0.620) 1.02 (0.68-1.54, p=0.918) 3/4 159 (90.3) 17 (9.7) 1.69 (0.98-2.75, p=0.044) 1.39 (0.74-2.44, p=0.274) 1.39 (0.74-2.40, p=0.270) 1.40 (0.74-2.65, p=0.296) Smoking No 6752 (93.9) 437 (6.1) - - - - Yes 684 (95.0) 36 (5.0) 0.81 (0.56-1.14, p=0.245) 0.99 (0.67-1.41, p=0.940) - - (Missing) 434 (95.0) 23 (5.0) 0.82 (0.52-1.23, p=0.363) 0.98 (0.56-1.61, p=0.946) - - Diabetes No 6463 (94.4) 381 (5.6) - - - - Yes 1062 (92.3) 89 (7.7) 1.42 (1.11-1.80, p=0.004) 1.40 (1.07-1.81, p=0.014) 1.38 (1.05-1.79, p=0.017) 1.29 (0.98-1.70, p=0.070) Mode of diagnosis Symptomatic 5014 (93.3) 359 (6.7) - - - - Screening 2011 (94.9) 109 (5.1) 0.76 (0.60-0.94, p=0.013) 0.99 (0.76-1.30, p=0.961) 0.99 (0.76-1.29, p=0.945) 0.95 (0.71-1.25, p=0.693) Detected incidentally 750 (97.0) 23 (3.0) 0.43 (0.27-0.64, p<0.001) 0.42 (0.25-0.67, p=0.001) 0.42 (0.25-0.67, p=0.001) 0.46 (0.28-0.77, p=0.003) Urgency Elective 7827 (94.1) 488 (5.9) - - - - Emergency 43 (84.3) 8 (15.7) 2.98 (1.29-6.04, p=0.005) 2.69 (1.08-5.80, p=0.020) 2.77 (1.12-5.94, p=0.015) 2.58 (1.07-6.19, p=0.034)
Treatment intent Palliative 227 (93.4) 16 (6.6) - - - -
Curative 7642 (94.1) 480 (5.9) 0.89 (0.55-1.55, p=0.661) 1.15 (0.65-2.19, p=0.640) - - Primary procedure B27 Mastectomy 3465 (92.2) 293 (7.8) - - - - B28 Partial mastectomy / wide local excision / lumpectomy 4051 (95.6) 187 (4.4) 0.55 (0.45-0.66, p<0.001) 0.56 (0.45-0.70, p<0.001) 0.56 (0.45-0.70, p<0.001) 0.54 (0.43-0.68, p<0.001) B32 Open biopsy of breast 93 (97.9) 2 (2.1) 0.25 (0.04-0.81, p=0.056) 0.31 (0.05-1.01, p=0.108) 0.31 (0.05-0.99, p=0.103) 0.33 (0.08-1.40, p=0.133) B37 Other operations on breast 257 (95.2) 13 (4.8) 0.60 (0.32-1.02, p=0.077) 0.71 (0.38-1.21, p=0.243) 0.69 (0.37-1.19, p=0.212) 0.77 (0.42-1.41, p=0.395) Stage 0 491 (95.7) 22 (4.3) - - - - I 4270 (94.4) 252 (5.6) 1.32 (0.86-2.11, p=0.226) 1.15 (0.75-1.87, p=0.540) - - II 119 (88.1) 16 (11.9) 3.00 (1.51-5.86, p=0.001) 1.66 (0.75-3.50, p=0.193) - - III 2695 (93.7) 181 (6.3) 1.50 (0.97-2.42, p=0.080) 1.02 (0.64-1.69, p=0.936) - -
24
IV 253 (92.0) 22 (8.0) 1.94 (1.05-3.59,p=0.033) 1.25 (0.63-2.47, p=0.521) - -
OR, odds ratio; WB, World Bank; BMI, Body Mass Index; ECOG, Eastern Cooperative Oncology Group; SD, standard deviation.
Data are n (%) and OR (95% confidence interval, p-value). Multilevel model includes hospital and country as random intercepts.
25
Table S6C. Breast cancer logistic regression analyses: all complications.
Dependent: Any
complication No Yes (univariable) OR (multivariable) OR
OR (multivariable reduced) OR (multilevel) WB income (tertile) High 2869 (68.1) 1346 (31.9) - - - - Upper middle 829 (63.5) 477 (36.5) 1.23 (1.08-1.40, p=0.002) 0.98 (0.84-1.14, p=0.820) 0.99 (0.85-1.15, p=0.921) 1.13 (0.66-1.92, p=0.658) Low/lower middle 1644 (57.8) 1201 (42.2) 1.56 (1.41-1.72, p<0.001) 1.06 (0.93-1.22, p=0.377) 1.08 (0.94-1.24, p=0.288) 0.90 (0.54-1.51, p=0.688) Age (years) Mean (SD) -0.0 (1.0) 0.0 (1.0) 1.06 (1.02-1.11,
p=0.006) 1.09 (1.03-1.16, p=0.002) 1.09 (1.03-1.16, p=0.002) 1.07 (1.01-1.14, p=0.022)
ASA (>3) No 5081 (64.6) 2784 (35.4) - - - -
Yes 261 (52.1) 240 (47.9) 1.68 (1.40-2.01,
p<0.001) 1.77 (1.33-2.35, p<0.001) 1.76 (1.32-2.32, p<0.001) 1.86 (1.30-2.66, p=0.001) BMI Normal weight (BMI
18.5 to 24.9) 1860 (67.0) 918 (33.0) - - - - Underweight (BMI < 18.5) 105 (66.0) 54 (34.0) 1.04 (0.74-1.45, p=0.811) 0.93 (0.64-1.34, p=0.709) 0.96 (0.66-1.37, p=0.824) 0.82 (0.55-1.21, p=0.322) Overweight (BMI 25 to 30) 1801 (63.0) 1059 (37.0) 1.19 (1.07-1.33, p=0.002) 1.09 (0.96-1.22, p=0.173) 1.08 (0.96-1.22, p=0.187) 1.16 (1.03-1.32, p=0.019) Obese (BMI >30) 1154 (58.6) 814 (41.4) 1.43 (1.27-1.61, p<0.001) 1.27 (1.11-1.44, p<0.001) 1.26 (1.10-1.43, p=0.001) 1.42 (1.22-1.65, p<0.001) (Missing) 422 (70.2) 179 (29.8) 0.86 (0.71-1.04, p=0.122) 0.82 (0.64-1.04, p=0.110) 0.80 (0.63-1.01, p=0.068) 1.07 (0.80-1.42, p=0.654) >10% weight loss No 4384 (64.0) 2468 (36.0) - - - - Yes 203 (55.6) 162 (44.4) 1.42 (1.15-1.75, p=0.001) 1.18 (0.93-1.49, p=0.163) - - (Missing) 755 (65.7) 394 (34.3) 0.93 (0.81-1.06, p=0.258) 0.88 (0.74-1.03, p=0.118) - - ECOG performance status 0 3564 (67.2) 1738 (32.8) - - - - 1 1007 (59.3) 691 (40.7) 1.41 (1.26-1.57, p<0.001) 1.21 (1.07-1.37, p=0.002) 1.22 (1.07-1.38, p=0.002) 1.26 (1.10-1.45, p=0.001) 2 440 (58.4) 314 (41.6) 1.46 (1.25-1.71, p<0.001) 1.30 (1.10-1.55, p=0.003) 1.31 (1.10-1.56, p=0.002) 1.64 (1.32-2.04, p<0.001) 3/4 83 (47.2) 93 (52.8) 2.30 (1.70-3.11, p<0.001) 1.74 (1.24-2.44, p=0.001) 1.75 (1.25-2.44, p=0.001) 1.82 (1.24-2.67, p=0.002) Smoking No 4588 (63.8) 2601 (36.2) - - - - Yes 461 (64.0) 259 (36.0) 0.99 (0.84-1.16, p=0.912) 1.23 (1.03-1.46, p=0.021) 1.23 (1.03-1.46, p=0.021) 1.32 (1.10-1.59, p=0.003) (Missing) 293 (64.1) 164 (35.9) 0.99 (0.81-1.20, p=0.899) 0.97 (0.74-1.24, p=0.785) 0.94 (0.73-1.21, p=0.631) 1.02 (0.77-1.36, p=0.869) Diabetes No 4506 (65.8) 2338 (34.2) - - - - Yes 672 (58.4) 479 (41.6) 1.37 (1.21-1.56, p<0.001) 1.14 (0.99-1.32, p=0.063) 1.15 (0.99-1.32, p=0.059) 1.05 (0.90-1.23, p=0.508) Mode of diagnosis Symptomatic 3292 (61.3) 2081 (38.7) - - - - Screening 1512 (71.3) 608 (28.7) 0.64 (0.57-0.71, p<0.001) 0.88 (0.77-1.00, p=0.047) 0.87 (0.76-0.99, p=0.040) 0.80 (0.69-0.92, p=0.002) Detected incidentally 468 (60.5) 305 (39.5) 1.03 (0.88-1.20, p=0.699) 1.00 (0.84-1.19, p=0.986) 1.00 (0.84-1.19, p=0.982) 0.87 (0.71-1.07, p=0.189) Urgency Elective 5316 (63.9) 2999 (36.1) - - - - Emergency 26 (51.0) 25 (49.0) 1.70 (0.98-2.96, p=0.058) 1.22 (0.67-2.20, p=0.503) - -
Treatment intent Palliative 142 (58.4) 101 (41.6) - - - -
Curative 5200 (64.0) 2922 (36.0) 0.79 (0.61-1.03, p=0.075) 1.04 (0.77-1.42, p=0.787) - - Primary procedure B27 Mastectomy 2077 (55.3) 1681 (44.7) - - - - B28 Partial mastectomy / wide local excision / lumpectomy 3004 (70.9) 1234 (29.1) 0.51 (0.46-0.56, p<0.001) 0.57 (0.52-0.64, p<0.001) 0.57 (0.52-0.64, p<0.001) 0.57 (0.51-0.64, p<0.001) B32 Open biopsy of breast 82 (86.3) 13 (13.7) 0.20 (0.10-0.34, p<0.001) 0.27 (0.14-0.48, p<0.001) 0.27 (0.14-0.47, p<0.001) 0.22 (0.11-0.42, p<0.001) B37 Other operations on breast 175 (64.8) 95 (35.2) 0.67 (0.52-0.87, p=0.002) 0.81 (0.62-1.07, p=0.143) 0.81 (0.62-1.07, p=0.145) 0.85 (0.62-1.17, p=0.317) Stage 0 365 (71.2) 148 (28.8) - - - - I 3068 (67.8) 1454 (32.2) 1.17 (0.96-1.43, p=0.128) 1.01 (0.81-1.26, p=0.941) 1.01 (0.82-1.27, p=0.906) 0.98 (0.78-1.24, p=0.889)
26
II 68 (50.4) 67 (49.6) 2.43 (1.65-3.58, p<0.001) 1.37 (0.88-2.13, p=0.157) 1.39 (0.89-2.15, p=0.143) 1.29 (0.81-2.07, p=0.285) III 1655 (57.5) 1221 (42.5) 1.82 (1.49-2.24, p<0.001) 1.27 (1.01-1.60, p=0.046) 1.28 (1.01-1.62, p=0.039) 1.31 (1.02-1.68, p=0.036) IV 153 (55.6) 122 (44.4) 1.97 (1.45-2.67, p<0.001) 1.23 (0.87-1.75, p=0.238) 1.24 (0.89-1.73, p=0.208) 1.22 (0.85-1.75, p=0.278)OR, odds ratio; WB, World Bank; BMI, Body Mass Index; ECOG, Eastern Cooperative Oncology Group; SD, standard deviation.
Data are n (%) and OR (95% confidence interval, p-value). Multilevel model includes hospital and country as random intercepts.
27
Table S7A. Colorectal cancer logistic regression analyses: mortality.
Dependent:
30-day mortality Alive Dead OR (univariable) (multivariable) OR
OR (multivariable reduced) (multilevel) OR WB income (tertile) High 4048 (97.7) 94 (2.3) - - - - Upper middle 1055 (95.7) 47 (4.3) 1.92 (1.33-2.73, p<0.001) 2.11 (1.35-3.28, p=0.001) 2.20 (1.42-3.37, p<0.001) 2.06 (1.11-3.83, p=0.021) Low/lower middle 842 (93.0) 63 (7.0) 3.22 (2.31-4.46, p<0.001) 3.46 (2.13-5.62, p<0.001) 3.75 (2.37-5.93, p<0.001) 4.59 (2.39-8.80, p<0.001) Age (years) Mean (SD) -0.0 (1.0) 0.4 (1.1) 1.53 (1.31-1.79,
p<0.001) 1.61 (1.33-1.96, p<0.001) 1.65 (1.37-1.99, p<0.001) 1.69 (1.39-2.07, p<0.001) Sex Male 3316 (96.5) 119 (3.5) - - - - Female 2622 (96.9) 84 (3.1) 0.89 (0.67-1.18, p=0.433) 0.65 (0.46-0.92, p=0.015) 0.67 (0.48-0.94, p=0.020) 0.68 (0.48-0.96, p=0.028) ASA (>3) No 5626 (97.2) 164 (2.8) - - - - Yes 319 (88.9) 40 (11.1) 4.30 (2.96-6.13, p<0.001) 1.82 (1.11-2.94, p=0.015) 1.82 (1.12-2.91, p=0.013) 2.03 (1.22-3.40, p=0.007) BMI Normal weight
(BMI 18.5 to 24.9) 2386 (97.0) 75 (3.0) - - - - Underweight (BMI < 18.5) 250 (87.7) 35 (12.3) 4.45 (2.89-6.74, p<0.001) 2.33 (1.38-3.87, p=0.001) 2.51 (1.52-4.07, p<0.001) 2.51 (1.49-4.23, p=0.001) Overweight (BMI 25 to 30) 2015 (98.0) 42 (2.0) 0.66 (0.45-0.97, p=0.035) 0.78 (0.50-1.20, p=0.261) 0.79 (0.51-1.20, p=0.268) 0.81 (0.52-1.27, p=0.360) Obese (BMI >30) 977 (97.5) 25 (2.5) 0.81 (0.50-1.27, p=0.379) 0.96 (0.54-1.64, p=0.873) 0.92 (0.52-1.54, p=0.750) 0.98 (0.56-1.72, p=0.956) (Missing) 317 (92.2) 27 (7.8) 2.71 (1.69-4.22, p<0.001) 1.88 (0.94-3.62, p=0.065) 1.49 (0.78-2.70, p=0.208) 1.51 (0.79-2.90, p=0.215) >10% weight loss No 3660 (98.0) 76 (2.0) - - - - Yes 1555 (94.2) 96 (5.8) 2.97 (2.19-4.05, p<0.001) 1.23 (0.84-1.82, p=0.289) - - (Missing) 730 (95.8) 32 (4.2) 2.11 (1.37-3.18, p<0.001) 0.85 (0.45-1.52, p=0.591) - - ECOG performance status 0 2959 (98.9) 33 (1.1) - - - - 1 1690 (97.3) 47 (2.7) 2.49 (1.60-3.94, p<0.001) 1.67 (1.02-2.76, p=0.044) 1.70 (1.05-2.80, p=0.032) 1.64 (0.99-2.71, p=0.053) 2 740 (93.8) 49 (6.2) 5.94 (3.81-9.37, p<0.001) 2.92 (1.75-4.94, p<0.001) 2.98 (1.81-4.98, p<0.001) 2.95 (1.75-4.98, p<0.001) 3/4 299 (81.5) 68 (18.5) 20.39 (13.34-31.77, p<0.001) 11.46, p<0.001) 6.71 (3.99- 11.88, p<0.001) 7.07 (4.27- 11.95, p<0.001) 6.98 (4.08-Smoking No 4638 (96.7) 157 (3.3) - - - - Yes 746 (97.4) 20 (2.6) 0.79 (0.48-1.24, p=0.333) 0.86 (0.48-1.47, p=0.601) - - (Missing) 561 (95.4) 27 (4.6) 1.42 (0.92-2.12, p=0.099) 0.90 (0.48-1.58, p=0.717) - - Diabetes No 4696 (97.0) 144 (3.0) - - - - Yes 1108 (95.6) 51 (4.4) 1.50 (1.07-2.06, p=0.015) 1.18 (0.79-1.74, p=0.405) - - Mode of diagnosis Symptomatic 4607 (96.2) 181 (3.8) - - - - Screening 877 (99.0) 9 (1.0) 0.26 (0.12-0.48, p<0.001) 1.00 (0.43-2.04, p=0.992) - - Detected incidentally 396 (96.8) 13 (3.2) 0.84 (0.45-1.42, p=0.538) 1.04 (0.47-2.07, p=0.914) - - Urgency Elective 5199 (97.7) 121 (2.3) - - - - Emergency 746 (90.0) 83 (10.0) 4.78 (3.57-6.38, p<0.001) 1.60 (1.00-2.57, p=0.049) 1.63 (1.03-2.58, p=0.038) 1.70 (1.05-2.75, p=0.032)
28
Curative 5339 (97.8) 120 (2.2) 0.16 (0.12-0.22, p<0.001) 0.33 (0.22-0.52, p<0.001) 0.35 (0.23-0.54, p<0.001) 0.34 (0.21-0.53, p<0.001) Approach Open 3144 (94.9) 169 (5.1) - - - - Minimally invasive 2774 (98.8) 34 (1.2) 0.23 (0.15-0.33, p<0.001) 0.62 (0.40-0.95, p=0.032) 0.60 (0.38-0.91, p=0.019) 0.65 (0.41-1.02, p=0.063)Operative site Right-side 2121 (96.2) 84 (3.8) - - - -
Left-side 1651 (95.7) 75 (4.3) 1.15 (0.83-1.58, p=0.398) 0.91 (0.62-1.32, p=0.610) 0.88 (0.60-1.27, p=0.483) 0.84 (0.57-1.24, p=0.378) High/mid rectum 1297 (97.7) 31 (2.3) 0.60 (0.39-0.91, p=0.018) 0.59 (0.35-0.97, p=0.042) 0.67 (0.41-1.08, p=0.107) 0.66 (0.40-1.09, p=0.105) Low rectum 818 (98.8) 10 (1.2) 0.31 (0.15-0.57, p<0.001) 0.43 (0.20-0.85, p=0.025) 0.42 (0.19-0.83, p=0.020) 0.42 (0.20-0.89, p=0.024) Pre-op obstruction No 4718 (97.9) 102 (2.1) - - - - Yes 1038 (91.5) 96 (8.5) 4.28 (3.21-5.70, p<0.001) 1.16 (0.73-1.82, p=0.533) 1.17 (0.75-1.82, p=0.488) 1.14 (0.72-1.82, p=0.576) Pre-op perforation No 5551 (97.1) 165 (2.9) - - - - Yes 303 (90.2) 33 (9.8) 3.66 (2.44-5.35, p<0.001) 1.63 (0.98-2.65, p=0.051) 1.66 (1.02-2.66, p=0.038) 1.75 (1.05-2.92, p=0.031)
Stage 0 0 (NaN) 0 (NaN) - - - -
I 1744 (97.6) 43 (2.4) - - - - II 1330 (96.9) 43 (3.1) 1.31 (0.85-2.02, p=0.215) 0.87 (0.51-1.47, p=0.593) 0.91 (0.55-1.51, p=0.704) 0.97 (0.57-1.63, p=0.896) III 2051 (97.1) 62 (2.9) 1.23 (0.83-1.83, p=0.311) 0.98 (0.60-1.61, p=0.935) 0.99 (0.62-1.61, p=0.978) 0.97 (0.59-1.59, p=0.900) IV 780 (93.4) 55 (6.6) 2.86 (1.91-4.32, p<0.001) 0.83 (0.46-1.50, p=0.540) 0.85 (0.48-1.52, p=0.587) 0.85 (0.47-1.55, p=0.599)
OR, odds ratio; WB, World Bank; ASA, American Society of Anesthesiologists operative risk grade;
BMI, Body Mass Index; ECOG,
Eastern Cooperative Oncology Group; SD, standard deviation. Data are n (%) and OR (95% confidence interval, p-value). Multilevel
model includes hospital and country as random intercepts.
29
Table S7B. Colorectal cancer logistic regression analyses: major complication.
Dependent: Major
complication No Yes (univariable) OR (multivariable) OR
OR (multivariable reduced) (multilevel) OR WB income (tertile) High 3572 (85.8) 590 (14.2) - - - - Upper middle 982 (88.7) 125 (11.3) 0.77 (0.63-0.94, p=0.013) 0.71 (0.56-0.89, p=0.004) 0.73 (0.58-0.91, p=0.006) 0.70 (0.48-1.02, p=0.061) Low/lower middle 738 (80.9) 174 (19.1) 1.43 (1.18-1.72, p<0.001) 1.38 (1.07-1.77, p=0.012) 1.38 (1.08-1.74, p=0.008) 1.25 (0.84-1.86, p=0.276) Age (years) Mean (SD) -0.0 (1.0) 0.1 (1.0) 1.14 (1.06-1.23,
p<0.001) 1.15 (1.05-1.27, p=0.003) 1.13 (1.03-1.23, p=0.010) 1.14 (1.04-1.25, p=0.007) Sex Male 2920 (84.6) 531 (15.4) - - - - Female 2365 (86.9) 357 (13.1) 0.83 (0.72-0.96, p=0.012) 0.80 (0.68-0.94, p=0.008) 0.78 (0.67-0.92, p=0.003) 0.78 (0.67-0.92, p=0.003) ASA (>3) No 5034 (86.5) 785 (13.5) - - - - Yes 258 (71.3) 104 (28.7) 2.58 (2.03-3.28, p<0.001) 2.07 (1.52-2.81, p<0.001) 2.05 (1.52-2.74, p<0.001) 2.22 (1.64-3.01, p<0.001) BMI Normal weight
(BMI 18.5 to 24.9) 2139 (86.5) 335 (13.5) - - - - Underweight (BMI < 18.5) 220 (75.6) 71 (24.4) 2.06 (1.53-2.74, p<0.001) 1.78 (1.27-2.46, p=0.001) 1.72 (1.24-2.36, p=0.001) 1.67 (1.20-2.32, p=0.002) Overweight (BMI 25 to 30) 1796 (87.0) 268 (13.0) 0.95 (0.80-1.13, p=0.582) 0.98 (0.81-1.18, p=0.813) 0.98 (0.81-1.18, p=0.838) 0.98 (0.81-1.19, p=0.870) Obese (BMI >30) 850 (84.7) 154 (15.3) 1.16 (0.94-1.42, p=0.167) 1.16 (0.91-1.47, p=0.222) 1.18 (0.94-1.48, p=0.152) 1.19 (0.95-1.51, p=0.136) (Missing) 287 (82.5) 61 (17.5) 1.36 (1.00-1.82, p=0.046) 1.04 (0.69-1.54, p=0.847) 0.93 (0.63-1.34, p=0.696) 0.92 (0.62-1.36, p=0.664) >10% weight loss No 3251 (86.7) 497 (13.3) - - - - Yes 1379 (83.1) 281 (16.9) 1.33 (1.14-1.56, p<0.001) 1.02 (0.84-1.24, p=0.835) - - (Missing) 662 (85.6) 111 (14.4) 1.10 (0.87-1.36, p=0.415) 0.83 (0.62-1.11, p=0.214) - - ECOG performance status 0 2672 (89.0) 331 (11.0) - - - - 1 1504 (86.0) 244 (14.0) 1.31 (1.10-1.56, p=0.003) 1.19 (0.98-1.44, p=0.079) 1.19 (0.99-1.44, p=0.069) 1.19 (0.98-1.45, p=0.078) 2 640 (80.5) 155 (19.5) 1.96 (1.58-2.41, p<0.001) 1.55 (1.22-1.97, p<0.001) 1.57 (1.24-1.98, p<0.001) 1.54 (1.21-1.96, p<0.001) 3/4 248 (67.2) 121 (32.8) 3.94 (3.08-5.03, p<0.001) 2.27 (1.68-3.05, p<0.001) 2.24 (1.67-2.99, p<0.001) 2.16 (1.59-2.91, p<0.001) Smoking No 4151 (86.1) 668 (13.9) - - - - Yes 643 (83.6) 126 (16.4) 1.22 (0.99-1.49, p=0.063) 1.26 (0.99-1.59, p=0.053) - - (Missing) 498 (84.0) 95 (16.0) 1.19 (0.93-1.49, p=0.155) 0.99 (0.73-1.33, p=0.967) - - Diabetes No 4207 (86.4) 661 (13.6) - - - - Yes 961 (82.6) 202 (17.4) 1.34 (1.12-1.59, p=0.001) 1.21 (0.99-1.46, p=0.060) 1.22 (1.01-1.47, p=0.041) 1.18 (0.98-1.44, p=0.085)
Mode of diagnosis Symptomatic 4082 (84.9) 728 (15.1) - - - -
Screening 806 (90.4) 86 (9.6) 0.60 (0.47-0.75, p<0.001) 0.85 (0.65-1.11, p=0.246) - - Detected incidentally 345 (83.7) 67 (16.3) 1.09 (0.82-1.42, p=0.541) 1.16 (0.84-1.58, p=0.363) - - Urgency Elective 4654 (87.1) 688 (12.9) - - - - Emergency 638 (76.0) 201 (24.0) 2.13 (1.78-2.54, p<0.001) 1.59 (1.20-2.10, p=0.001) 1.56 (1.24-1.95, p<0.001) 1.55 (1.23-1.96, p<0.001)
Treatment intent Palliative 554 (79.0) 147 (21.0) - - - -
Curative 4738 (86.5) 742 (13.5) 0.59 (0.49-0.72,
p<0.001) 0.91 (0.69-1.20, p=0.482) 0.94 (0.74-1.19, p=0.592) 0.91 (0.71-1.16, p=0.439)
Approach Open 2768 (83.0) 568 (17.0) - - - -
Minimally
invasive 2500 (88.7) 317 (11.3) 0.62 (0.53-0.72, p<0.001) 0.84 (0.71-1.00, p=0.053) 0.83 (0.70-0.98, p=0.027) 0.80 (0.67-0.96, p=0.017)
Operative site Right-side 1932 (86.9) 290 (13.1) - - - -
Left-side 1476 (85.0) 260 (15.0) 1.17 (0.98-1.41, p=0.082) 1.13 (0.92-1.38, p=0.238) 1.12 (0.92-1.36, p=0.260) 1.13 (0.92-1.38, p=0.243) High/mid rectum 1132 (84.9) 201 (15.1) 1.18 (0.97-1.44, p=0.090) 1.36 (1.09-1.70, p=0.006) 1.38 (1.11-1.71, p=0.003) 1.41 (1.13-1.75, p=0.002) Low rectum 703 (84.9) 125 (15.1) 1.18 (0.94-1.48, p=0.143) 1.51 (1.17-1.94, p=0.001) 1.48 (1.15-1.88, p=0.002) 1.53 (1.19-1.96, p=0.001) Pre-op obstruction No 4215 (87.1) 625 (12.9) - - - -
30
Yes 915 (79.9) 230 (20.1) 1.70 (1.43-2.00, p<0.001) 0.94 (0.72-1.21, p=0.618) - - Pre-op perforation No 4974 (86.6) 768 (13.4) - - - - Yes 238 (69.6) 104 (30.4) 2.83 (2.21-3.60, p<0.001) 1.94 (1.45-2.57, p<0.001) 1.98 (1.49-2.61, p<0.001) 1.93 (1.45-2.57, p<0.001)Stage 0 0 (NaN) 0 (NaN) - - - -
I 1579 (88.0) 216 (12.0) - - - - II 1162 (84.3) 216 (15.7) 1.36 (1.11-1.67, p=0.003) 1.14 (0.91-1.44, p=0.252) - - III 1814 (85.6) 305 (14.4) 1.23 (1.02-1.48, p=0.031) 1.09 (0.87-1.35, p=0.460) - - IV 700 (82.6) 147 (17.4) 1.54 (1.22-1.93, p<0.001) 1.08 (0.80-1.45, p=0.618) - -