7 © The Author(s) 2019
A. C. Smaal et al. (eds.), Goods and Services of Marine Bivalves,
https://doi.org/10.1007/978-3-319-96776-9_2
Global Production of Marine Bivalves.
Trends and Challenges
J. W. M. Wijsman, K. Troost, J. Fang, and A. Roncarati
Abstract The global production of marine bivalves for human consumption is
more than 15 million tonnes per year (average period 2010–2015), which is about 14% of the total marine production in the world. Most of the marine bivalve pro-duction (89%) comes from aquaculture and only 11% comes from the wild fishery. Asia, especially China, is by far the largest producer of marine bivalves, account-ing for 85% of the world production and responsible for the production growth. In other continents, the production is stabilizing or decreasing (Europe) the last decades. In order to stimulate growth, sustainability (Planet, Profit, People) of the aquaculture activities is a key issue. Environmental (Planet) aspects for sustainable aquaculture include the fishery on seed resources, carrying capacity, invasive spe-cies and organic loading. Food safety issues due to environmental contaminants and biotoxines should be minimized to increase the reliability of marine bivalves as a healthy food source and to stimulate market demands. Properly designed mon-itoring programs are important tools to accomplish sustainable growth of marine bivalve production. Abstract in Chinese 在2010~2015年间,海水双壳贝类的年产量超过1500万 吨,约占同时段全球海洋渔业总量的14%。其中约89%的贝类产量来自于水产 养殖,野生采捕量仅占11%左右。亚洲(尤其是中国)是迄今为止最大的海水双 壳贝类生产地,约占世界总产量的85%,同时也是全球双壳贝类生产的主要增 长点。相比之下,在其他大陆(如欧洲)等地双壳贝类的产量在过去几十年均 保持稳定或呈下降趋势。经济效益和可持续性是驱动养殖产量持续稳定增长 J. W. M. Wijsman (*) · K. Troost
Wageningen UR, Wageningen Marine Research, Yerseke, The Netherlands e-mail: [email protected]; [email protected]
J. Fang
Yellow Sea Fisheries Research Institute, Chinese Academy of Fishery Sciences, Qingdao, China
e-mail: [email protected]
A. Roncarati
URDIS Centre, University of Camerino, San Benedetto del Tronto, AP, Italy e-mail: [email protected]
的关键因素。在可持续性方面,应重点关注养殖方式、养殖容量、入侵物种 以及富营养化等因素,并将由环境污染物和生物毒素引起的食品安全问题最 小化,这是提高海水双壳贝类作为食品可靠性并刺激市场需求的必要条件。 合理的环境监测计划是保障双壳贝类产业可持续发展的重要手段。
Keywords Bivalves · Oysters · Mussels · China · Europe · Stock assessment ·
Sustainability
关键词 双壳贝类 · 牡蛎 · 贻贝 · 中国 · 欧洲 · 资源评估 · 可持续性
2.1 Introduction
Food production has been recognised as one of the most direct provisioning ecosystem functions of marine environments (Costanza et al. 1997). Food production of marine ecosystems comprises various types of organisms of which macroalgae, fish, crusta-ceans and molluscs are the most important. The increase of marine food production has been recognised as an important solution to fulfil the increasing protein demands of the growing world population in the future (Naylor et al. 2000). The total global food pro-duction of marine ecosystems in the period 2009 to 2014 was 104.3 million tonnes per year and consisted of wild capture (80.4 million tonnes per year) and marine aquacul-ture (23.9 million tonnes per year) (FAO 2016a, b). Marine bivalves account for about 14% of the global marine production (tonnes) in this period. Most of the marine bivalve production (89%) comes from aquaculture, with a total economic value of 20.6 billion US$ per year. Only 11% of the marine bivalve production comes from the wild fishery. However, the seed resources that form the basis for aquaculture production are often fished or collected from natural stocks as well. Due to decreasing seed resources and environmental issues with the seed fishery, more and more of the seed resources for marine bivalve aquaculture are produced within land-based hatcheries. The direct cap-ture production of marine bivalves remained relatively constant since the 1970’s (1.78 million tonnes per year), but the aquaculture production of marine bivalves increased from 1.18 million tonnes per year in the period 1970–1974 to 13.47 million tonnes per year in the period 2010–2015.
The total market value of marine bivalves is about 23 billion US$ per year (2010–2015), however, the full economic value is much higher due to the economic benefits from secondary products and services (e.g. shucking and packaging houses, transport, manufacture of prepared products and retail sales) (Schug et al. 2009). The value of the production in terms of US$ kg−1 is depending on the market demands and the supply of the specific species.
Marine bivalves are appreciated by consumers due to their nutritional benefits as well as their taste. Bivalves are healthy sources of energy and protein, rich in vita-mins (A and D) and essential minerals (iodine, selenium calcium), low in fat and a good source of omega-3 fatty acids with well-established health benefits (Orban
et al. 2002; Schug et al. 2009; EFSA 2014). Selenium for example is an essential trace element that is required by the human body for proper functioning of the thy-roid gland, and may help protect against free radical damage of the tissue. Most of the dietary human intake of selenium occurs via plants (Brazil nuts) and seafood (Ariard et al. 1993; Kristan et al. 2015). There is evidence that selenium deficiency may be related to a variety of degenerative diseases (Reilly 1998). However, it is also known that there is also a narrow concentration window between essentiality and toxicity of selenium for humans (Kristan et al. 2015). The unavoidable presence of environmental contaminants, such as mercury and biotoxins in bivalves could also result in a risk to the health of consumers (Sadhu et al. 2015; Visciano et al. 2016). Regular monitoring programs, therefore, are essential to prevent food safety issues.
Marine bivalves are also a sustainable type of food production. As herbivores, they are low in the trophic chain. The trophic position of marine bivalves like mus-sels, oysters, clams and cockles is 2 (herbivores), while the average trophic position of the total marine capture fishery is 3.1 (Duarte et al. 2009).
In contrast to the intensive fish aquaculture, bivalve aquaculture is an extensive form of aquaculture while the bivalves feed on algae that occur naturally in the ecosystem and no additives such as vitamins and antibiotics are added. The produc-tion relies merely on the natural productivity of marine phytoplankton, either in the form of living algae or as detritus, transported to the bivalves by water flow e.g., currents and tidal exchange. Bivalves can enhance primary production by increased nutrient recycling (Prins and Smaal 1994). At high stocking densities, however, the bivalves can result in overgrazing and thereby reduce primary production (Smaal et al. 2013b; Filgueira et al. 2015). Management by farmers is an important factor whereas the farmers will try to maximise their profits within their aquaculture sites. This is done by growing the bivalves at specific locations where the conditions for growth and survival are maximized (Capelle 2017). Numerous management activi-ties are possible among which active removal of predators (Calderwood et al. 2016) and thinning-out and sorting the bivalves to optimise growth efficiency and shape. The moment of harvesting is also decided by the farmers, based on the quality of the bivalves but also on market prices.
Since aquaculture of marine bivalves takes place in natural environments, it often results in conflicts with other functions such as nature conservation, recreation, eco-nomic development, etc. Also the fishery on marine bivalves might result in con-flicts since natural stocks that are an important food source for fish and birds are removed from the system (Ens et al. 2004; Ens 2006). Moreover, the fishery with dredges is a bottom disturbing activity that might impact the seafloor integrity. Also aquaculture often depends on the wild fishery for the seed resources (Smaal and Lucas 2000).
For aquaculture purposes, bivalves and associated organisms are often translo-cated between sites and ecosystems which has resulted in introduction and spread-ing of (invasive) exotic species (Minchin and Gollasch 2002; Wolff 2005). Proper management of bivalve transports are important to reduce environmental impact.
In this paper an overview is given of the trends in global production of marine bivalves based on FAO data. The production figures for different continents are
discussed and compared with each other. As case studies, the trends and developments in China – by far the largest producer of marine bivalves – and Europe are pre-sented. In China, the production of marine bivalves is still increasing tremendously due to the increasing protein demand of the growing population. In Europe, how-ever, the total production is decreasing the last decades due to various reasons such as competing claims on space, diseases and carrying capacity issues. For both case studies an overview is presented of the trends and developments of production, import and export and legislation. Finally, in this paper, special attention is paid to stock assessment of marine bivalves since this provides essential information for sustainable management of natural stocks in order to reduce environmental impact of the fishery on marine bivalves. This is based on a case study of the stock assess-ment for natural bivalve species in the Wadden Sea, The Netherlands.
2.2 Global Trends
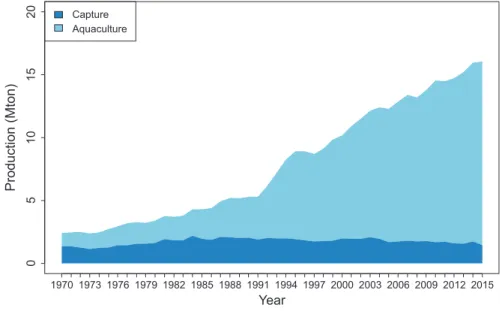
In the FAO Global Fishery and Aquaculture Statistics database a total 79 marine bivalve species are listed as cultured and 93 species are listed as captured species. They can be grouped into four major groups: clams, oysters, mussels and cockles. Clams and oysters are the major species groups that contribute 38% and 33%, respectively, to the global production. Scallops account for 17% and mussels for 13% of the global production. The global production of marine bivalves is more than 15 million tonnes per year (data FishStat FAO 2010–2015) (Fig. 2.1). More than 85% of the total marine bivalve production in comes from Asia (Fig. 2.2). As a
1970 1973 1976 1979 1982 1985 1988 1991 1994 1997 2000 2003 2006 2009 2012 2015 05 10 15 20 Year Production (Mton ) Capture Aquaculture
Fig. 2.1 Evolution of the total global production (million tonnes per year) of marine bivalves by the fishery and aquaculture. (Data from FAO FishStat (1970–2015))
1970 1975 1980 1985 1990 1995 2000 2005 2010 2015 0 5 10 15 Year Production (Mton) Asia 1970 197 51 98 01 98 51 99 01 995 2000 2005 2010 2015 0.0 0.5 1.0 1.5 Year Production (Mton) Amer icas 1970 1975 1980 1985 1990 1995 2000 2005 2010 2015 0.0 0.5 1.0 1.5 Year Production (Mton) Europe 1970 1975 1980 1985 1990 1995 2000 2005 2010 2015 0.00 0.05 0.10 0.15 Year Production (Mton) Oceania 197 01 97 51 980 198 51 99 01 995 2000 2005 2010 2015 0.000 0.002 0.004 0.006 0.008 0.010 Year Production (Mton) Afr ica
Clams Mussels Oysters Scallops
Fig . 2.2 Ev olution of the total production (million tonnes per year) of marine bi valv es by the fishery and aquaculture together for the dif ferent continents from 1970 to 2015. Marine bi valv
es are grouped as clams, mussels, o
ysters and scallops. (Data from F
A
result the production in Asia, specifically China, largely dominates the patterns and trends in the world production.
The total production of marine bivalves is the result of a complex interaction between the market demand and the production capacity of the system. If the market demand increases, this will be a trigger to increase production. However, the pro-duction will be limited by the carrying capacity of the system. There are different types of carrying capacity that could potentially limit the production: physical, pro-duction, ecological and social carrying capacity (Inglis et al. 2000; Gibbs 2009; Smaal and Van Duren 2018).
The bivalve production in Asia is increasing on average with 0.42 million tonnes per year since 1990. The majority of the production in Asia comes from clams (5.4 million tonnes in 2015) and oysters (ca 5.1 million tonnes in 2015). The pro-duction of scallops and mussels in 2015 was 2.3 and 1.1 million tonnes, respec-tively. Production in Asia is dominated by the production in China (more than 90% of the marine bivalve production in Asia). Other marine bivalve producing countries of importance in Asia are Japan (0.75 million tonnes per year), Republic of Korea (0.4 million tonnes per year) and Thailand (0.23 million tonnes per year). The major reason for the increase in marine bivalve production in China is the increased demand for proteins from the growing population and the increased standard of liv-ing in China. As a result, social and ecological carryliv-ing capacity are no major issues yet. Spatial and production carrying capacity limitations might be occurring locally since the availability of suitable productive sites can sometimes be limiting. The wild fishery on marine bivalves in China is not specifically documented in the Fishstat database. Japan is the most important country in Asia in terms of the fishery on marine bivalves, mainly scallops, with an average yearly production of 0.38 mil-lion tonnes in the period 2010–2015. In Indonesia the fishery on blood cockles produce on average about 74 thousand tonnes per year (2010–2015).
North and south America is responsible for 9% of the global marine bivalve pro-duction. Most of the aquaculture production is in Chile (mussels and scallops), Peru (scallops), the United States (American and Pacific cupped oysters, hard clams) and Canada (mussels). The wild fishery is mainly practiced in the United Stated of America on scallops, hard clams and surf clams, with a mean total production of about 510 thousand tonnes per year (2010–2015). Also in Canada there is a wild fishery (ca 92 thousand tonnes per year) mainly on Atlantic deep-sea scallops. The total production in north and south America increased from about 1 million tonnes per year in the period 1995–2000 to about 1.3 million tonnes per year in the period 2010–2015. This increase is mainly due to the increase of aquaculture production. Clams used to be the most important species but the production is slightly decreas-ing since 1988. This is mainly due to a decrease in wild catches of clams in the United States from about 450 thousand tonnes per year in 1985 to a total production of 250 thousand tonnes per year at present (2010–2015). From 2000 the mussel-, but also the scallop production is increasing in the Americas. The increase in mussel production is mainly due to an increase in the aquaculture production in Chile with a tenfold increase in this century from 23 thousand tonnes in 2000 to a current
production of about 244 thousand tonnes per year (2010–2015). In the United States of America, the wild fishery on oysters decreased from 200 thousand tonnes in the early 70’s of the last century to a production of about 59 thousand tonnes per year in the period 2010–2015. The aquaculture production of eastern oysters increased from about 106 thousand tonnes per year in the period 1995–1999 to a total produc-tion of 142 thousand tonnes per year at present (2010–2015).
In Europe, responsible for 5.5% of the world production of marine bivalves, the production has decreased since 1998. This decrease is mainly due to a decrease in mussel production by aquaculture activities from about 600 thousand tonnes per year in 1998 to about 465 thousand tonnes per year in the period 2010 to 2015. The production of bottom culture mussels in the Netherlands is responsible for part of this reduction since the production in the Netherlands decreased from 113 thousand tonnes in 1998 to 46 thousand tonnes per year in the period 2010–2015. The produc-tion is limited by a reducproduc-tion in physical space due to competing claims with nature conservation and occasional recruitment failures. Production of oysters, clams and scallops in Europe is much lower than the mussel production. The oyster production decreased from 150 thousand tonnes in 1998 to about 94 thousand tonnes per year (average 2010–2015), with the largest production in France (ca 78 thousand tonnes per year). In Ireland, however, the production of oysters is increasing. Almost 25% of the marine bivalve production in Europe, yearly about 205 thousand tonnes per year, comes from the fishery. The highest capture production is in the UK (scallops and cockles), Denmark (blue mussels), France (scallops) and Italy (venus clams).
The production in Africa and Oceania is less than 1% of the world production. In Oceania mussels, mainly produced in New Zealand, are by far the most important bivalve species, with a total production of about 94 thousand tonnes per year (2010– 2015). In Australia there is additionally some production of flat and cupped oysters. The fishery on marine bivalves is very limited in Oceania. In Africa, there is some fisheries (ca 2 thousand tonnes per year) on carpet shells and cupped oysters in Tunisia and Senegal. Mussels are cultured in South Africa with a total production of 800 tonnes per year. The low production in Africa is low due to the limited market demands. The local community has no tradition in consuming bivalves, since it is often difficult to keep the healthy sanitary conditions.
2.3 China
2.3.1 Aquaculture Production in China
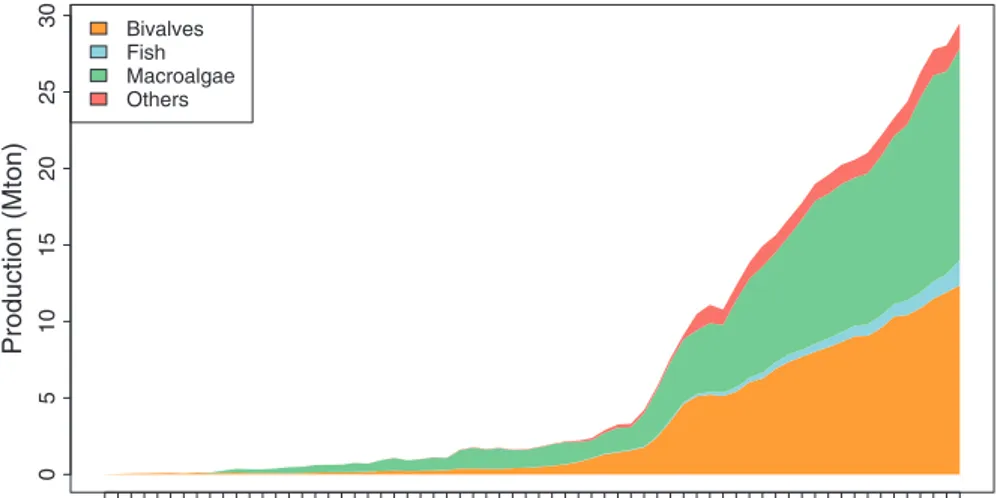
Aquaculture production of China is the highest in the world (61.5 million tonnes in 2015). The total output of marine aquaculture in China in 2015 was 29.5 mil-lion tonnes and consists of marine bivalve production of 12.4 mil29.5 mil-lion tonnes, macroalgae production of 13.8 million tonnes, fish production around 1.6 million
tonnes1 and other organisms (e.g. molluscs, crustaceans, echinoderms) about
1.7 million tonnes (FAO FishStat). Marine bivalves represented 42% of the total mariculture production in China in 2015. The production increased from an aver-age of 51 thousand tonnes per year in 1950–1959 to 335 thousand tonnes per year in 1975–1979, 7.3 million tonnes per year in 2000–2004 to 12.4 million tonnes in 2015 (Fig. 2.3). Besides marine bivalves, macroalgae are also responsible for the enormous growth in marine aquaculture production in China since 1990 (Fig. 2.3). The major shellfish cultured in China include 8 categories (oysters, clams, scal-lops, mussels, razor clams, cockles, sea snails and abalones) and 48 species (Tang et al. 2016), among which oysters, clams and scallops yield more than 1 million tonnes annually, and the production of mussels and razor clams fall between 0.5 to 1 million tonnes each year.
2.3.2 Trends and Developments
Bivalve aquaculture has a long history in China, the record of oyster farming can be traced back to 2400 years ago, in the ancient book “Pisciculture” written by Fan Li, a famous politician, strategist, Taoist and Economist. In the 1950s and 1960s of the twentieth century, the main species of Chinese bivalve culture were oyster and mus-sel. The major farming methods were tideland cultivation and natural sea area nurs-ing (Liu 1959).
1 In the China Fishery statistical yearbook a production of 1.3 million tonnes fish is reported for
2015. 1950 1954 1958 1962 1966 1970 1974 1978 1982 1986 1990 1994 1998 2002 2006 2010 2014 05 10 15 20 25 30 Year Production (Mton) Bivalves Fish Macroalgae Others
Fig. 2.3 Changes in mariculture production (million tonnes per year) in China. (Data from FAO FishStat (1950–2015))
In the beginning of 1970s, the technologies for seed production of mussel in hatcheries and natural sea seed collection made great progress, which promoted the rapid development of mussel culture industry. In 1977, the national mussel farming area was more than 2000 ha, and the annual production exceeded 60,000 tonnes, about 200 times and 75 times respectively compared to those in 1970. In late 1970s, the success in artificial breeding of cockles Tegillarca granosa, and Sinonovacula
constricta, clams Ruditapes philippinarum and Cyclina sinensis laid the foundation for development of the large-scale culture of these species. In the early 1980s, the breakthrough of artificial breeding in hatcheries and natural sea seed collection of
Chlamys farreri, had led to the rapidly development of the scallop culture at indus-trial level. Particularly, the introduction of bay scallop Argopecten irradians from Atlantic coast in 1982 brought a prosperous stage for Chinese scallop aquaculture development.
New Eco-farming aquaculture modes such as integrated aquaculture of shellfish and seaweed in shallow-sea, and pond farming of shrimp-shellfish, has contributed greatly to the development of modern Chinese marine aquaculture. In recent years, China has carried out research on varieties of shellfish selective breeding. Until to 2015, 18 new varieties of shellfish were determined by genetic and selective breed-ing, including oysters, scallops, hard clams, abalone, pearl oyster and manila clam, which had been certificated by the national new variety committee in China. Shellfish farming methods now include maritime longline culture (northern China) and raft culture (southern China), mud flat farming, bottom sow farming, and pond culture. Integrated aquaculture of shellfish-fish, shellfish-shrimp and shellfish- seaweed has become the new trend for mariculture development in China.
From 2005 to 2014, the bivalve culture production maintained an overall growth. During these 10 years, production of scallops, clams, oysters and mussels increased by 80.4%, 40.8%, and 30.0% and 19.3%, respectively. Shellfish prices showed over-all rise during the last 10 years with inter-annual fluctuations. In 2015, the domestic shellfish wholesale price data shows that, the average price of live oysters was increased from 0.87 US$/kg to 0.98 US$/kg, an increase of approximately 12.1%. The average price of live razor clam, from the same period last year, increased from 3.99 US$/kg to 4.09 US$/kg, an increase of slightly 1.9%. Scallop adductor muscle average price, reduced by 7.8% from 3.50 US$/kg to 3.23 US$/kg in the same period last year; the average price of fresh clams decreased from 1.16 US$/kg to 1.13 US$/kg compare to the same period last year, down by 2.6%.
2.3.3 Import and Export
In 2014, scallops, oysters and mussels were the major imported and exported mol-luscs, with the net import and export being 33.3 thousand tonnes and 32.1 thousand tonnes, respectively. The scallops, oysters and mussels import were 29.0 thousand tonnes, 2.6 thousand tonnes and 1.6 thousand tonnes, respectively, and the export of these 3 bivalve species were 29.2 thousand tonnes, 1.3 thousand tonnes and
1.5 thousand tonnes for each. The annual import and export volume were 135.7 and 453.0 million US dollars respectively. From 2008 to 2014, China imported shellfish mainly from the United States, Japan, North Korea, South Korea, France and New Zealand, and the shellfish exported went to United States, South Korea, Hong Kong, Macao and Australia. In 2014, the Chinese imports of oysters, scallops and mussels were mainly from France, Japan and North Korea, while the export of these species went to Hong Kong, the United States and South Korea. Data from China Customs show that from January to October 2015, China’s shellfish export amount and rev-enue was 219 thousand tonnes (1.87% increase compared to the same period in 2014) and 1.38 billion US$ (1.11% decrease compared to the same period in 2014).
2.3.4 Legislation
The impact of marine bivalve culture to the environment is expected to be relatively small. This is mainly due to the filtering capacity, removing particles from the water column. Moreover, no additives (food, antibiotics, etc.) are added to the system. Nevertheless, there are many laws and regulations related to mariculture in China (Table 2.1). Besides the state-level management, protection and zoning regulations, there are also provincial level laws and regulations on natural resources exploitation and development. For instance, “Marine Functional Zoning of Shandong Province” has clearly clarified the scope and area that can be applied for aquaculture. Since 2007, the Ministry of Agriculture Fisheries Bureau executed the functional zoning for shellfish mariculture in Guangdong Province and 11 other areas. Reference from the relevant provisions of the EU, the Ministry announced the “Requirements for shellfish mariculture regional zoning”, which defined the 3 categories of shellfish products according to the content of Escherichia coli (MPN/100 g) in meat and juice in the shellfish. For category one, the Escherichia coli content should be no more
Table 2.1 Relevant legislation concerning marine shellfish production in China “Law on the Administration of Sea Area Use of the People’s Republic of China”, 2002 “Law on Marine Environmental Protection of the People’s Republic of China”, 2000 “Fisheries Law of the People’s Republic of China”
“Standard for Seawater Quality of the People’s Republic of China” (GB3097-1997), 1997 “National Marine Functional Zoning (2011–2020)”, 2012
“Regulations of Marine Environmental Protection of Shandong Province”, 2004 “Regulations on the Administration of Sea Area Use in Shandong Province” 2004 “Marine Functional Zoning of Shandong Province”, 2012
“Requirements for Shellfish Mariculture Regional Zoning”
“Law of Quality and Safety of Agricultural Products of People’s Republic of China” “Provisions on the Administration of Aquaculture Quality”
“Provisional Regulations on Supervision and Management of Shellfish Production Environment” “Provisions on the Hygiene Management of Exporting Shellfish”
than 230 E. coli/100 g, bivalves can be put into the market directly; the second category refers to the Escherichia coli content can be greater than 230 E. coli/100 g and no more than 4600 E. coli/100 g, which can be put into the market directly without raw food permit. Bivalves with Escherichia coli content more than 4600 E. coli/100 g and no more than 46,000 E. coli/100 g are in the third category, which need to be kept depurated until reached the standard in the second category before sales.
2.4 Europe
2.4.1 Aquaculture Production in Europe
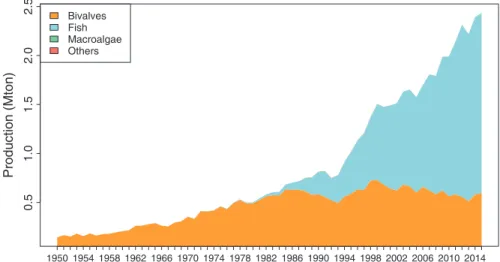
In Europe, aquaculture production has remained relatively constant in the last years. In 2015, the total output of European aquaculture was 3.0 million tonnes, of which the majority (2.4 million tonnes) was marine production (FAO FishStat). The marine aquaculture production was represented almost exclusively by fish production (about 1.8 million tonnes) and bivalve production (about 598 thousand tonnes) (FEAP 2016; FAO 2017). Culture of other marine organisms like macroalgae and crustaceans is negligible in Europe (Fig. 2.4). The most important species (freshwa-ter and marine) reared in Europe in 2015 are Atlantic salmon (1.6 million tonnes per year), mussels (497 thousand tonnes per year), rainbow trout (290 thousand tonnes per year), common carp (154 thousand tonnes per year), Pacific cupped oyster (89 thousand tonnes per year), gilthead sea bream (79 thousand tonnes per year) and European sea bass (68 thousand tonnes per year) (FAO 2017). Among the EU
1950 1954 1958 1962 1966 1970 1974 1978 1982 1986 1990 1994 1998 2002 2006 2010 2014 0. 51 .0 1.5 2.0 2.5 Year Production (Mton) Bivalves Fish Macroalgae Others
Fig. 2.4 Changes in mariculture production (million tonnes per year) in Europe. Macroalgae and others are hardly visible. (Data from FAO FishStat (1950–2015))
Member States, the largest producers of marine aquaculture products are Norway (1.4 million tonnes, mainly Atlantic salmon), Spain (271 thousand tonnes per year), United Kingdom (196 thousand tonnes per year), France (161 thousand tonnes per year) and Greece (103 thousand tonnes per year). With regard to the aquaculture of marine bivalves in the different countries, Mediterranean mussels accounted for 83.0% of the marine aquaculture in Spain whereas in France, the largest volumes were produced by Pacific cupped oyster (46.6%), blue mussel (37.9%) and Mediterranean mussel (8.8%). The growth of marine Aquaculture production in Europe is mainly caused by the increase in fish culture (Atlantic salmon) since 1985–1990 (Fig. 2.4). The production of marine bivalves by European aquaculture is decreasing from an average production of 661 thousand tonnes per year in the period 1995–1999 to an average of 560 thousand tonnes per year in the period 2010–2014.
2.4.2 Trends and Developments
In Europe, bivalve aquaculture has ancient origins, both for oysters and mussels. Images on archaeological findings (pots) date back the oyster farm to Roman times, between the second and first century BC. In Italy, in the lakes Lucrino and Fusaro (Campania Region) flat oysters were reared for the Roman nobles consumption. In Spain, in the fourth century BC, the natives used to leave bivalve molluscs in large deposits denominated ‘concheiros’; the first findings of bivalve culture were discov-ered near to the Roman villages in the first century A.D. In France, the mussel culture was practised in the intertidal zone since the thirteenth century using wooden stakes called “bouchots”. This technique spread widely along the French Atlantic coastline over the nineteenth century, while Northern European countries (the Netherlands, Ireland and the United Kingdom) developed bottom culture plots where juveniles were spread over the plots in shallow water, generally in bays or in sheltered areas on the ground. The French “bouchot” system, currently still in use, consists of ropes carrying young mussels placed on vertical poles and then, as the mussels grow, they move onto the pole where they will grow until they reach their commercial size. In the Middle Ages, oyster culture was widespread in the Sea of Taranto (Puglia Region, Italy). Under the kingdom of Ferdinand IV of Bourbon, around 1764, oysters contin-ued to be farmed in the Fusaro Lake. In the sixteenth century, in Spain, people com-ing from Portugal began to gather mussels, clams, and cockles in the ria of Arosa (NW Spain). At the turn of the nineteenth century, flat oyster culture was well devel-oped especially in the Bay of Arcachon (France), reaching 15–20,000 tonnes per year between 1908 and 1912. In 1979 the disease caused by the exotic parasite
Bonamia ostreae broke down the productions (Buestel et al. 2009). Between 1971 and 1973, after the depletion of the Portuguese oyster (Crassostrea angulata) deci-mated by several successive diseases, several hundred tonnes of Crassostrea gigas were imported from Canada and the species became established and an abundant spat was settled in Marennes-Oleron (France). In the Mediterranean, flat oysters
were cultured until 1950 when high mortalities strongly reduced productions due to a disease caused by the protozoan, Marteilia refringens.
In the Netherlands, due to numerous conflicts in the nineteenth century among fishermen for the open access to fish blue mussels (Mytilus edulis) and flat oysters (Ostrea edulis) in the delta region in the southwest of the Netherlands, the rearing system changed and mussel and oyster fishermen could rent exclusive access rights to plots in the sea. This plot system facilitated the beginning of bottom culture of blue mussel and flat oyster because only the person who rented the plot draw the benefits from the harvest. In 1952, plots to grow mussels could also be leased in the shallow Wadden Sea in the north of the Netherlands and this led to the development of a second region where blue mussel was cultured.
Mussels became important in Spain when farmers started culturing them in the beginning of the twentieth century. In longline systems, mussels are cultured on ropes that remain suspended in the water from a long line composed of buoys, whereas oysters are introduced in trays or “poches”, attached to the rope. The long lines can be semi-submerged, submerged or buoyant depending on the farming environment. “Bateas mussel rafts” are largely employed in Spain. Rafts are com-posed of a solid structure from which the mussels hang in the water. In the bottom mussels system, predominantly used in the Netherlands, Germany, Ireland and the UK, large flat boats equipped with 2 to 4 dredges, fish juvenile mussels from natural beds which then are relayed in sheltered areas for further growth until they reach the commercial size. Currently, the Pacific cupped oyster is the most widely reared oyster species in Europe thanks to its fast growth, adaptability to different settings and improving breeding lines in the hatchery. Since 2008, high mortalities have been recorded in many European countries due to herpesviruses affecting larvae, spats and juveniles of cupped oysters highlighting the emergence of a global prob-lem involving not only the European countries, but also New Zealand and Australia. Concerning clams (Ruditapes decussatus, Tapes philippinarum), the farming began in the 1980s, when harvesting wild stocks by hand or by dredging was discouraged in order to protect resources. Currently, clam farming depends mainly on natural recruitment and reproduction in hatchery. Spat is grown in nursery areas or tanks and seeded in shallow areas managed by fishermen’s cooperatives.
2.4.3 Import and Export
Data from EUMOFA Report 2016, based on the elaboration of Eurostat data, show that in 2015, EU imports of mussels totalled 200,000 tonnes, the lowest volume in the past 6 years, 10,000 tonnes less than the average import volume from 2010– 2014. France, the EU’s largest market, recorded stable imports in 2015 when com-pared with the 2010–2014 average, while Italy, the second largest importer, demonstrated a remarkable increase in import volumes (+28%) compared with the average volume imported in the 2010–2014 period. Portugal recorded a significant growth of the import as well. Otherwise, import to all other EU markets declined
rather sharply: the Netherlands (−49%), the UK and Germany (−19% each), and Spain and Belgium (−10% each). This reduction in imports can be explained by the economic crisis as well as the increase in prices (average price from US$ 10.30 per kg in 2010 to US$ 15.40 per kg in 2015). European bivalve export amounted at 20,000 tonnes (+9% respect to 2014) and 172 million US$ (+24% respect to 2014). EU self-sufficiency for this commodity fell to 61%. The EU consumption of mus-sels registered a slightly fluctuating trend from 2005 to 2014, with the apparent consumption moving from 1.36 kg per capita in 2005 to 1.27 kg per capita in 2014. Chile and New Zealand are the two main suppliers of mussels to Europe, providing the market with frozen and conserved products. Intra-EU trade is well developed with a value around half the total value of the EU supply. There are major trade flows from Spain, the Netherlands and Denmark (wild mussels in the case of Denmark) to Belgium, France and Italy. The European consumption of scallop in 2014 was almost at the same level as in 2005. Its peak of 0.63 kg per capita was registered in 2010, and a 4% decrease was recorded between 2013 and 2014, due to the reduction in catches in the United Kingdom and France of 11% and 29%, respectively. Since 2005, consumption of clam has remained stable at an average of 0.35 kg per capita (EUFOMA 2016).
2.4.4 Legislation, Environmental Issues
In the European Union, in 1979, the “Shellfish Water Directive 79/923/EEC” cerning the quality of shellfish waters to protect populations from the harmful con-sequences resulting from the discharge of polluting substances into the sea, was enacted. This legislation has laid down and updated official controls for monitoring bivalve production and relaying areas (Table 2.2). The authorities, based on faecal indicator organisms (E. coli), determine the classification of a production area and the treatment required in growing areas during the production cycle and for the end- product. The classification marks three classes: Class A (≤230 E. coli/100 g), mol-luscs can be harvested for direct human consumption; Class B (90% of samples must be ≤4600 E. coli/100 g; all samples must be less than 46,000 E. coli/100 g), molluscs can be sold for human consumption after purification in an approved plant, or after re-laying in an approved Class A re-laying area, or after an EC-approved heat treatment process; Class C (≤46,000 E. coli/100 g), molluscs can be sold for human consumption only after re-laying for at least 2 months in an approved re- laying area followed, where necessary, by treatment in a purification centre, or after an EC-approved heat treatment process. The European Food Safety Authority Panel on Biological Hazards has reviewed the hazards and has also determined the need to restrict shellfish harvesting from areas contaminated with faecal pollution. Molluscs must not be subject to production or collected in prohibited areas. In 2010, the EU Commission Regulation was enacted to identify the presence of OsHV-1 μvar associated with the massive mortality in oysters in order to reduce the spread
of the virus to uninfected regions. According to the regulation, disease control mea-sures must be implemented. This includes the establishment of containment areas and the restriction of movement from these areas if OsHV-1 μvar is identified.
2.5 Stock Assessment
Culture of some marine bivalve species is dependent on fishery on wild stocks. Seed is for instance collected using spat collectors, or fished in the natural environment. Culture of such species (e.g. blue mussels (Mytilus edulis) and Pacific cupped oys-ters Crassostrea gigas) is therefore dependent on the availability of natural stocks. The natural stocks of most bivalve species show large fluctuations from year to year, depending on the success of natural spatfall. Moreover, the spatial heterogeneity is high because many species occur locally within dense beds. Stock assessments are of key importance for fisheries regulation and management and provide essential information for impact assessment studies.
We illustrate the role of stock assessment with the case study of blue mussels in the Dutch part of the Wadden Sea. The Netherlands is, after Spain and France the third producer of mussels in Europe, with a total production of about 63 million kg per year (1990–2015). In contrast to the suspended culture in Spain, in the Netherlands the mussels are mainly cultured on-bottom at designated culture plots
Table 2.2 Relevant legislation concerning marine shellfish production in Europe
“Regulation (EC) NO 178 of the European Parliament and of the Council laying down the general principles and requirements of food law, establishing the European Food Safety Authority and laying down procedures in matters of food safety”, 2002
“Commission Decision establishing special health checks for the harvesting and processing of certain bivalve molluscs with a level of amnesic shellfish poison (ASP) exceeding the limit laid down by Council Directive 91/492/EEC”, 2002
“Regulation (EC) No 852 of the European Parliament and of the Council on the hygiene of foodstuffs”, 2004
“Regulation (EC) No 853 of the European Parliament and of the Council laying down specific hygiene rules for on the hygiene of foodstuffs”, 2004
“Regulation (EC) No 854 of the European Parliament and of the Council laying down specific rules for the organisation of official controls on products of animal origin intended for human consumption”, 2004
“Commission Regulation (EC) No 2073 on microbiological criteria for foodstuffs”, 2005 “Commission Regulation (EC) No 2074 laying down implementing measures for certain products under Regulation (EC) No 853/2004 of the European Parliament and of the Council and for the organisation of official controls under Regulation (EC) No 854/2004 of the European Parliament and of the Council and Regulation (EC) No 882/2004 of the European Parliament and of the Council, derogating from Regulation (EC) No 852/2004 of the European Parliament and of the Council and amending Regulations (EC) No 853/2004 and (EC) No 854/2004”, 2005 “Commission Regulation (EC) No 1664 amending Regulation (EC) No 2074/2005 as regards implementing measures for certain products of animal origin intended for human consumption and repealing certain implementing measures”, 2006
that are located in the Wadden Sea and in the Oosterschelde. The mussels are cultured by about 50 companies, operating 60 vessels (Capelle 2017). The mussel culture depends largely on natural seed resources. Mussel seed is dredged from naturally occurring subtidal mussel beds in the Wadden Sea in Autumn and Spring. From there they are translocated to the culture plots in the Wadden Sea and the Oosterschelde where they are kept for 1–3 years until they reach consumption size. The mussels are harvested mainly in Summer and Autumn and sold at the auction in Yerseke. From there they are processed and distributed over Europe (mainly Belgium, France, the Netherlands, Germany).
Since 1992 the natural mussel stock in the subtidal areas of the Wadden Sea is assessed annually from two different surveys. A quantitative survey in early Spring and a qualitative survey in Autumn (Van Stralen et al. 2016, 2017). In Autumn, the mussel seed fishery is exclusively allowed in subtidal areas that are designated as being unstable due to starfish (Asterias rubens) predation and exposure to unfavour-able hydrodynamic conditions. In other words, in areas where the seed beds are likely to disappear before, or in the course of, the following winter. Designation of areas as stable or instable was made based on survey results since 1992 and expert judgement of fishermen and fisheries inspectors (Smaal et al. 2014). To determine the amount of mussels to be fished during the autumn fisheries in these instable areas, an estimate of the total stock of seed mussels is made in late summer or early autumn. A qualitative assessment of starfish abundance gives insight in the likeli-hood of particular beds disappearing before winter, which is used in the fisheries plan to identify beds to be fished first. In early spring a second stock assessment is carried out, with the primary purpose to prepare the fisheries permit for the spring fisheries, and with the secondary purpose to be able to assess effects of changes in the fisheries policy and management. Where the autumn assessment is a qualitative survey, the spring assessment is set up as a quantitative survey in which not only mussels but all species of bivalves, starfish and crabs are recorded. This dataset gives insight in distribution patterns of mussels and other bivalves, fishery impacts, as well as the main benthic predators, and is therefore of key importance in studies on effects of fisheries and changes in fisheries and nature policy (Smaal et al. 2013a).
The autumn assessment is carried out with a mussel dredge. Historical informa-tion as well as observainforma-tions by fisheries inspectors and fishermen is used to deter-mine the areas with a high encounter probability. Using the mussel dredge, operated by a commercial mussel fisheries vessel, the bed contours and kilograms per square meter are estimated. The total seed mussel stock, as well as the exploitable stock size in areas open to the fishery in autumn is estimated based on the dredge data and expert judgement.
The spring assessment is carried out with a suction dredge. For stations with a water depth over 10 meters a towed bottom dredge is used. Both sampling gears fish along a track with known length (ca 150 m) and surface area. The sampling loca-tions are distributed along a stratified regular sampling grid where the distance between stations is smaller in areas with a high encounter probability. The encoun-ter probability is estimated based on the autumn survey, the autumn fishery (gps- data of the fishing vessels), historical information and observations by fisheries
inspectors and fishermen. During the Spring survey (March–April) 400–600 locations are sampled within a period of 3–4 weeks. The samples are sieved over a mesh of 5 mm, and all species of shellfish, crabs and starfish are counted and weighed per station (total wet weight). The total stock is calculated as the sum of all stations: biomass (wet weight) per square meter per station multiplied by the surface area the sampling station is representative for (which is determined by the stratum).
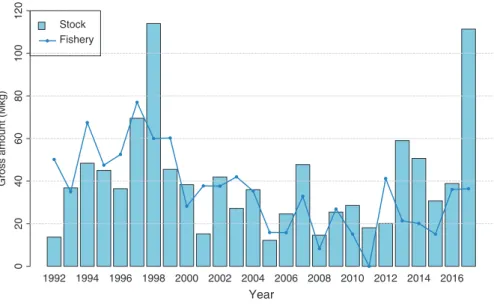
The amount of wild sublittoral mussels in the western Wadden Sea (Spring sur-vey) is presented in Fig. 2.5 (bars). The lines indicate the total amount that has been harvested for grow-out on mussel culture plots in spring and autumn. As can be seen from this figure, in some years more seed has been fished than found during the spring survey. This is due to a new recruitment during the summer months, after the spring survey and spring fisheries and before autumn fisheries of the same year.
Due to competing claims with shellfish-eating birds, one of the nature conserva-tion goals in the Wadden Sea, a transiconserva-tion from bottom fisheries to seed collecconserva-tion using suspended seed collectors (SMCs) has taken place within the mussel culture since 2010. According to an agreement between the mussel producers’ organiza-tion, NGO’s and the Dutch government, a gradually increasing portion of the stable areas are closed for fishing. The area available for SMCs is proportionally increased. The total harvest of the SMCs in the Wadden Sea increased from 1.3 Mkg in 2009 to 15.2 Mkg in 2016 (Capelle and Van Stralen 2017). The SMCs resulted in a more
1992 1994 1996 1998 2000 2002 2004 2006 2008 2010 2012 2014 2016 Year Gross amount (Mkg) 02 04 06 08 0 100 120 Stock Fishery
Fig. 2.5 Total wild stock of mussels in the sublitoral part of the western Wadden Sea (spring sur-vey) and the total gross amount seed fished (Spring and Autumn) of that year. To calculate the Gross amount 40% debris and associated fauna is assumed for mussel seed and 25% for adult mussels. It is also assumed that the seed will gain 20% in weight between survey and fishery
stable supply of mussel seed for the mussel farmers, making them less depending on the fluctuations in natural spatfall on the bottom. Data from the stock assessments are an essential tool for the (evaluation of the) management decisions.
2.6 Conclusions
Food production is an important provisioning ecosystem function of marine bivalves. The global production is growing, although this growth is mainly caused by the increase in aquaculture production in Asia, in particular China. The bivalve farming has already become a considerable scale industry in China and has pro-vided high quality proteins for humans. The production in North and South America, however, is stabilizing since 2000 and the production in Europe is decreasing.
It is expected that the global production of marine bivalves, particularly in Asia, will continue to grow in the future in order to fulfil part of the protein demand of the growing world population, especially since bivalves are a sustainable form of pro-tein production. The expected growth in production of marine bivalves will come mainly from an increase in aquaculture production since it can be foreseen that the production from wild catches is relatively limited and will probably only decrease in the future. Sustainability (People, Profit, Planet) is an important factor for a fur-ther increase in marine bivalve production. Bivalve aquaculture is depending to a large extent, if not completely, on natural ecosystems, which are in many cases nature conservation areas. Removal of seed resources and microalgae as food source for the bivalves can, in some areas, result in competing claims with other ecosystem values.
Stock assessments are of primary importance in determining sustainable seed supply. The case study Wadden Sea shows that annual monitoring of bivalve stocks, resulting in long-term time series, is important for the year-to-year management of bivalve stocks since it gives insight in the population dynamics as well as potential ecological impacts of fisheries and aquaculture targeted on marine bivalves. This can also be applied to other regions where aquaculture is depending on wild stocks.
With increasing emphasis on sustainability, the balance between aquaculture development and ecology/environment has become a new requirement and chal-lenge in both research and commercial aspects. The development of a sustainable bivalve aquaculture will promote employment in the coastal fishing zones support-ing diversification in areas linked to changes in the fisheries sector. It could be of great socio-economic importance because it would allow the recovery and enhance-ment of traditional activities related to the region. New opportunities for local man-agement of commercial fishing may open up to guarantee the characteristics of the product being of great interest to the consumer.
Acknowledgements Dr. Yuze Mao from YSFRI is acknowledged for providing valuable information on aquaculture production in China. The authors are grateful to the referees Dr. J. Grant and Dr. R. Filgueira for their valuable comments on the manuscript.
References
Ariard JC, Berthet B, Boutaghou S (1993) Seasonal selenium variations in mussels and oysters from a French marine farm. J Food Compos Anal 6:370–380
Buestel D, Ropert M, Prou J, Goulletquer P (2009) History, status, and future of oyster culture in France. J Shellfish Res 28:813–820
Calderwood J, O’Connor NE, Roberts D (2016) Efficiency of starfish mopping in reducing preda-tion on cultivated benthic mussels (Mytilus edulis Linnaeus). Aquaculture 452:88–96
Capelle JJ (2017) Production efficiency of mussel bottom culture. PhD thesis, Wageningen University
Capelle JJ, Van Stralen MR (2017) Invang van mosselzaad in MZI’s. Resultaten 2016. Wageningen Marine Research, Report number: C044/17, 30 pages
Costanza R, D’Arge R, De Groot R, Farber S, Grasso M, Hannon B, Limburg K, Naeem S, O’Neill RV, Paruelo J, Raskin RG, Sutton P, Van Den Belt M (1997) The value of the world’s ecosystem services and natural capital. Nature 387:253–260
Duarte CM, Holmer M, Olsen Y, Soto D, Marba N, Guiu J, Black KD, Karakassis I (2009) Will the oceans help feed humanity? Bioscience 59:967–976
EFSA (2014) Scientific opinion on health benefits of seafood (fish and shellfish) consumption in relation to health risks associated with exposure to methylmercury. EFSA J 12(7):80
Ens BJ (2006) The conflict between shellfisheries and migratory waterbirds in the Dutch Wadden Sea. Waterbirds around the world. In: Broere GC, Galbraith CA, Stroud DA (eds) Waterbirds around the world. The Stationery Office, Edinburth, pp 806–811
Ens BJ, Smaal AC, De Vlas J (2004) The effects of shellfish fishery on the ecosystems of the Dutch Wadden Sea and Oosterschelde. Final report of thesecond phase of the scientific evaluation of the Dutch shellfish fishery policy (EVA II), Report number: C056/04
EUFOMA (2016) Highlights the EU in the world EU market, supply consumption, trade EU land-ings aquaculture processing. www.eumofa.eu
FAO (2016a) The state of world fisheries and aquaculture. Contributing to food security and nutri-tion for all. Food and Agriculture Organisanutri-tion of the United Nanutri-tions, Report, 200 pages FAO (2016b) FAO yearbook. Fishery and Aquaculture Statistics. 2014. Food and Agriculture
Organisation of the United Nations, Report, 76 pages
FAO (2017) FAO yearbook. Fishery and Aquaculture Statistics. 2015. Food and Agriculture Organisation of the United Nations Report, 78 pages
FEAP (2016) European aquaculture production report 2007–2015. FEAP Secretariat, Report, 46 pages
Filgueira R, Comeau LA, Guyondet T, Mckindsey CW, Byron CJ (2015) Modelling carrying capac-ity of bivalve aquaculture: a review of definitions and methods. Encyclopedia of Sustainabilcapac-ity Science and Technology
Gibbs MT (2009) Implementation barriers to establishing a sustainable coastal aquaculture sector. Mar Policy 33:83–89
Inglis GJ, Hayden BJ, Ross AH (2000) An overview of factors affecting the carrying capacity of coastal embayments for mussel culture. NIWA, Report number: Client Report: CHC00/69, 38 pages
Kristan U, Planišek P, Benedik L, Falnoga I, Stibilj V (2015) Polonium-210 and selenium in tis-sues and tissue extracts of the mussel Mytilus galloprovincialis (Gulf of Trieste). Chemosphere 119:231–241
Liu CG (1959) The earliest literature of aquaculture worldwide- scientific value of “Pisciculture” by Fan Li (written in Chinese). China Fish 22:45–46
Minchin D, Gollasch S (2002) Vectors – how exotics get around. In: Leppäkoski E, Gollasch S, Olenin S (eds) Invasive aquatic species of Europe. Distribution, impacts and management. Kluwer Academic Publishers, Dordrecht, pp 183–192
Naylor RL, Goldburg RJ, Primavera JH, Kautsky N, Beveridge MCM, Clays J, Folke C, Lubchenco J, Mooney H, Troell M (2000) Effects of aquaculture on world fish supplies. Nature 405:1017–1024
Orban E, Di Lena G, Nevigato T, Casini I, Marzetti A, Caprioni R (2002) Seasonal changes in meat content, condition index and chemical composition of mussels (Mytilus galloprovincialis) cultured in two different Italian sites. Food Chem 77:57–65
Prins TC, Smaal AC (1994) The role of the blue mussel Mytilus edulis in the cycling of nutrients in the Oosterschelde estuary (The Netherlands). Hydrobiologia 282(283):413–429
Reilly C (1998) Selenium: a new entrant into the functional food arena. Trends Food Sci Technol 9:114–118
Sadhu AK, Kim JP, Furrell H, Bostock B (2015) Methyl mercury concentrations in edible fish and shellfish from Dunedin, and other regions around the South Island, New Zealand. Mar Pollut Bull 101:386–390
Schug DM, Baxter K, Wellman K (2009) Valuation of ecosystem services from shellfish resto-ration, enhancement and management: a review of the literature. Northern Economics Inc., Report, 58 pages
Smaal AC, Lucas L (2000) Regulation and monitoring of marine aquaculture in The Netherlands. J Appl Ichtyol 16:187–191
Smaal AC, van Duren L (2018) Bivalve aquaculture carrying capacity: concepts and assessment tools. In: Smaal AC (ed) Goods and services of marine bivalves. Springer, Dordrecht, pp 451–483
Smaal AC, Craeymeersch J, Drent J, Jansen JM, Glorius S, Van Stralen MR (2013a) Effecten van mosselzaadvisserij op sublitorale natuurwaarden in de westelijke Waddenzee: samenvattend eindrapport. Wageningen IMARES, Report number: C006/13, 162 pages
Smaal AC, Schellekens T, Van Stralen MR, Kromkamp JC (2013b) Decrease of the carrying capac-ity of the Oosterschelde estuary (SW Delta, NL) for bivalve filter feeders due to overgrazing? Aquaculture 404-405:28–34
Smaal AC, Brinkman AG, Schellekens T, Aguera A, Van Stralen MR (2014) Ontwikkeling en sta-biliteit van sublitorale mosselbanken, samenvattend eindrapport. IMARES, Report
Tang Q, Han D, Mao Y, Zhang W, Shan X (2016) Species composition, non-fed rate and trophic level of Chinese aquaculture. J Fish Sci China 23:729–758
Van Stralen MR, Troost K, Van den Ende D (2016) Inventarisatie van het sublitorale wilde mos-selbestand in de Oosterschelde en Voordelta in de zomer en najaar van 2016. MarinX, Report number: 2016.169, 9 pages
Van Stralen M, Van den Ende D, Troost K (2017) Inventarisatie van het sublitorale wilde mos-selbestand in de westelijke Waddenzee in het voorjaar van 2017. MarinX, Report number: 2017.175, 25 pages
Visciano P, Schirone M, Berti M, Milandri A, Tofalo R, Suzzi G (2016) Marine biotoxins: occur-rence, toxicity, regulatory limits and reference methods. Front Microbiol 7:1–10
Wolff WJ (2005) Non-indigenous marine and estuarine species in the Netherlands. Zoologische mededelingen 79:1–116
Open Access This chapter is licensed under the terms of the Creative Commons Attribution 4.0 International License (http://creativecommons.org/licenses/by/4.0/), which permits use, sharing, adaptation, distribution and reproduction in any medium or format, as long as you give appropriate credit to the original author(s) and the source, provide a link to the Creative Commons license and indicate if changes were made.
The images or other third party material in this chapter are included in the chapter’s Creative Commons license, unless indicated otherwise in a credit line to the material. If material is not included in the chapter’s Creative Commons license and your intended use is not permitted by statutory regulation or exceeds the permitted use, you will need to obtain permission directly from the copyright holder.