Contents lists available atScienceDirect
Technological Forecasting & Social Change
journal homepage:www.elsevier.com/locate/techforeDemand-pull and environmental innovations: Estimating the e
ffects of
innovative public procurement
Claudia Ghisetti
European Commission, Joint Research Centre (JRC), Unit I.1, Modelling, Indicators & Impact Evaluation, Via E. Fermi 2749, TP 361, Ispra, VA I-21027, Italy
A R T I C L E I N F O
JEL classification: Q55 O3 Q58 H57 Keywords: Environmental innovation Government policy Public procurement Demand-pull innovationA B S T R A C T
This paper contributes to the emerging literature on the adoption of environmental innovation, by investigating the so far unexplored role of governmental demand in stimulating‘greener’ production choices. Specifically, the role of innovative public procurement in driving the adoption and diffusion of sustainable manufacturing technologies is analysed. Results, based onfirm-level data in the 28 Member States of the European Union, Switzerland and the USA, are obtained through non-parametric matching techniques. Those outline the crucial role of innovative public procurement in the uptake of environmental innovations. This confirms the relevance of such policy instrument in allowing countries to achieve a decarbonised and sustainable growth path which is compatible with competitiveness goals.
1. Introduction
It is difficult to identify the right amount of resources for the market to invest in knowledge creation. This creates the space for market (Arrow, 1962) or even broader systemic failures. The market may fail to provide adequate levels of research and development (R & D) invest-ments because of the limited appropriability of such activities and the intrinsic uncertainty that characterises any innovation project. This condition may lead to sub-optimal supply of knowledge and, as a consequence, to overall social losses, unless properly designed policies for science, technology and innovation are adopted. Rationales for such policies are discussed by Laranja et al. (2008) and Flanagan et al. (2011).
Within this framework, a broad research effort has aimed to un-derstand the role of specific policies to stimulate innovation. Most of it has been focused on the role of R & D subsidies to counterbalance such under-investment and to stimulatefirm's innovative activities, as well as on R & D subsidies' negative side-effects, experienced when they crowd out private investments ((Antonelli and Crespi, 2013; Bloom et al., 2002; David et al., 2000; Hussinger, 2008), among others).
Only recently has there been a turn towards demand-oriented in-novation policies, in particular on public procurement (Edler et al., 2012; OECD, 2011), to stimulate innovation, and very few (though robust) empirical analyses have been focused on understanding the effects of public procurement on innovative activities as an alternative or complementary policy instrument (Aschhoff and Sofka, 2009;
Guerzoni and Raiteri, 2015). In parallel, a new and fast-growing re-searchfield has emerged about a peculiar typology of innovation, that of environmental innovations, whose investigation requires a more systemic lens than‘standard’ innovations (Rennings, 2000). As these environmental innovations are of importance for both the policy and the business realm and have the potential to lead to win-win solutions whereby competitiveness and environmental sustainability are com-bined (EEA, 2014), it is relevant to investigate whether or not gov-ernmental demand can play a role and foster their development and diffusion.
This article bridges these two research lines and investigates, em-pirically, whether or not public procurement is a valuable policy in-strument to stimulate environmental innovations and, indirectly, to contribute to decoupling economic growth and environmental pressure in order to meet European 2020 and 2030 climate and energy targets (EC, 2014). This is, to the author's knowledge, thefirst paper to explore such a research question empirically, which is thefirst way in which this article is original. The analysis of the role of procurement for sus-tainability is not new; indeed, there are crucial contributions on the topic such as the extensive work of the Organisation for Economic Co-operation and Development (OECD) on sustainable procurement (e.g. (OECD, 2015)) and the United Nations Environmental Programme's work on sustainable procurement (e.g. (UNEP, 2013)). Sustainable procurement has been put at the centre of the international agenda, as the United Nations 2030 Agenda for Sustainable Development explicitly states the need to ‘promote public procurement practices that are
http://dx.doi.org/10.1016/j.techfore.2017.07.020
Received 20 January 2017; Received in revised form 19 May 2017; Accepted 17 July 2017 E-mail address:[email protected].
Available online 24 July 2017
0040-1625/ © 2017 The Author. Published by Elsevier Inc. This is an open access article under the CC BY license (http://creativecommons.org/licenses/BY/4.0/).
sustainable, in accordance with national policies and priorities’ to reach one of the 17 Sustainable Development Goals (UN, 2015). The main originality lies in the empirical testing of the presence of a statistically relevant effect of procurement in stimulating environmental innova-tions. The second element of originality is that generalisable results are provided, as the empirical approach is grounded onfirm-level data from a wide range of countries: the EU-28, Switzerland and the USA. The empirical approach accounts for the non-randomised nature of the as-signment of public procurement tenders to applicantfirms by applying a quasi-experimental approach through non-parametric matching techniques.
The rest of the paper is structured as it follows:Section 2discusses the background literature, Section 3describes the empirical strategy, Section 4discusses the main results andSection 5provides concluding remarks and identifies future lines of research.
2. Innovative public procurement and environmental innovations: discussion of the literature
The role of governmental demand in shaping the direction and speed of technological change has been recognised as crucial in the economics of innovation literature: an analysis of seven industries in the USA (semiconductors, commercial aircraft, computers, agriculture, pharmaceuticals, motor vehicles, residential and construction) dating back to 1982 confirmed the pivotal role of public policies in guiding technical progress (Nelson, 1982). Governmental support to innovative activities through public procurement (PP) is seen as a fundamental driver for the uptake of crucial technologies, as happened in the case of general-purpose technologies, which were driven by defence-related procurement in the USA (Ruttan, 2006). Those technologies– mainly steam engines, electric motors and semiconductors– in turn played the role of enabling technologies that fostered widespread technical pro-gress and eventually led to economic growth (Bresnahan and Trajtenberg, 1995).Geroski (1990)expresses a preference for PP over subsidies to stimulate industrial innovation because of subsidies' in-efficiencies, characterised by their being ‘unconscionably expensive’ and by the high probability that they attract‘second-best’ projects in which the rate of return on publicly funded R & D will be lower than that on privately funded R & D. In contrast, Geroski observes that government procurement has a positive net effect on R & D investments over a broad cluster of innovations (including electronic devices, nu-clear power, chemical products, and engines and transport equipment). PP is recognised as a successful stimulus for innovation when certain conditions are met: (i) when it expresses a clear and consistent set of needs to be addressed by the innovative effort in a clear contract spe-cification; (ii) when quality is placed at the centre of the tender, rather than merely price; (iii) when it provides an assured market for early products with uncertain commercial possibilities; and (iv) when it forces contractors to share information and encourages the entry of new competitors so that it stimulates technology diffusion (Geroski, 1990). The author concludes that‘there is very little question that procurement policy can stimulate industrial innovativeness, and more than a vague suspicion that it can be a far more potent stimulus than a policy of generalised R & D subsidies’ (Geroski, 1990).
Only recently there has been an increasing tendency to reconsider the role of demand-oriented policies in European innovation policies and a discussion has emerged on the role of innovation policies to support ‘Grand Challenges’ in terms of societal and economic goals (Edler et al., 2012; Foray et al., 2012). Those challenges relate to the fields of health, pharmaceuticals, energy, environment, transport and logistics, security, and digital content (Aho et al., 2006). Among the array of demand-side policy instruments, PP helps to reduce the risks linked to innovation investments with unknown demand, very low expected market size or uncertain development, all of which discourage firms from bearing the costs of innovation (Helpman and Trajtenberg, 1994).
In line with this trend, the European Commission has chosen to set a non-binding target of 50% of public tendering to be compliant with its sustainability requirements by 2010, in order to favour improvements in the environmental, energy and social performance of products and services and the development of a Green Public Procurement initiative (EC, 2008). This initiative outlines common criteria to be followed and the need to increase information on the benefits and life cycle costs of environmental friendly products. The strategy has been explicitly linked not only to the creation of market opportunity for existing green small and medium-sized enterprises (SMEs) but also to a stimulus for innovation and diversification in traditional sectors1
via the increase in demand for green(er) products and services. In principle, the strategy should stimulate a critical mass of demand for greener goods and ser-vices which otherwise would be difficult to get onto the market, as European public authorities are consumers for an amount of EUR 2 trillion per year (16% of the EU's gross domestic product (GDP)) (EC, 2008). Overall,‘green’ PP is a (procurement) procedure that leads to the purchase of‘greener’ products, whose impact on the environment throughout their whole life cycle is lower than comparable products or solutions. This provides a stimulus for innovation and creates a minimum critical mass for sustainable goods and services, thus helping to overcome the problem of under-investments in innovation due to the uncertain demand. In reality, this non-binding target has not been reached, as mutually reinforcing obstacles are hindering those organi-sations that should launch and promote‘green’ tenders from doing so (for a discussion see (Testa et al., 2016)).
The focus of the current study is not on‘green’ PP, usually referred to as an environmental policy tool (for a discussion see (Lundberg and Marklund, 2011), or (Parikka-Alhola, 2008)), but rather on innovative PP, a category that has recently received attention and is increasingly seen as a crucial instrument for innovation policy. Regular PP occurs when a public institution buys already existing products or services for which no R & D is involved and supplier selection depends on readily available information about price, quantity and performance, given the existence of standardised markets (Edquist and Zabala-Iturriagagoitia, 2012; Uyarra and Flanagan, 2010). Innovative PP (IPP) occurs whenever public institutions invest in products or services that have not yet been developed but could be developed within a reasonable timeframe, and that can help satisfy human needs or solve societal problems; thus IPP explicitly stimulates an innovative effort (Edquist and Zabala-Iturriagagoitia, 2012). The latter case of procurement (IPP) is the main object of the current study. Public procurement for innovation has been acknowledged as an important demand-side policy instrument, as it has ‘the potential to improve delivery of public policy and services, often generating improved innovative dynamics and benefits from the asso-ciated spillovers’, but, at the same time, ‘it has been neglected or downplayed for many years’ (Edler and Georghiou, 2007), probably because of the stringent competition rules adopted in Europe (Edquist et al., 2000).
The rationale for using PP to stimulate innovation is threefold, as discussed byEdler and Georghiou (2007): (i) IPP is a major part of local demand and this affects decisions by multinational enterprises (MNEs) about where to locate and the dynamics of innovation in countries; (ii) IPP can help overcome market (information asymmetries) and system (poor interaction) failures relating to innovative products; and (iii) purchasing innovative solutions contributes to improving public infra-structure and services. Intelligent and tailored intermediation services may, however, be needed to make this instrument more effective in connecting supply and demand (Edler and Yeow, 2016). Predicting longer term societal needs and trends in emerging technologies can also make this instrument more effective, as discussed in the case of an
1Although the traditional sector might not benefit from green procurement stimulus
because it lacks systemic perspectives and skills in negotiation and inter-organisational planning (Rizzi et al., 2014).
Italian regional innovation policy by Vecchiato and Roveda (2014). Overall, IPP is an important source of innovation because it counteracts market and systemic innovation failures, which otherwise would lead to under-investment in innovative activity (Edler and Georghiou, 2007).
Empirical analyses of the role of IPP in stimulating innovation are surprisingly rather scarce, but they strongly confirm that it is a driver of innovation (Aschhoff and Sofka, 2009; Guerzoni and Raiteri, 2015). Aschhoff and Sofka (2009)focus on Germanfirms and find that PP leads to heterogeneous effects on firms' innovation performance: it is particularly effective for smaller firms in geographical areas under economic stress, thus suggesting that it may be of particular relevance for firms facing limited resource constraints. Guerzoni and Raiteri (2015)provide original evidence on how the interactions of demand-and supply-side technology policies affect firms' innovative activities, finding that the interaction of R & D subsidies, R & D tax credits and IPP helps explain innovation, but also that IPP is more effective than R & D subsidies in stimulating innovation.
This theoretical and empirical literature is bridged by an emerging research field on a peculiar subset of innovations, environmental in-novations (EI), which are characterised by special features (Rennings, 2000) and a multifaceted nature, which place their investigation at the crossroads between environmental economics and innovation studies (Ghisetti et al., 2015; Horbach et al., 2012; Horbach et al., 2013).
Academic contributions to this emerging researchfield (for a review see (Barbieri et al., 2016)) acknowledge that environmental regulation and standards provide valuable incentives for EI uptake and diffusion, although some articlesfind statistically significant results and others do not (Ghisetti and Pontoni, 2015). Furthermore, by analysing European SMEs and the barriers to their innovative activities,Marin et al. (2015) identify six clusters of heterogeneous ‘eco-innovators’ profiles; they stress that this diversity has to be accounted for when designing en-vironmental and innovation policies, as policies can have different ef-fects onfirms in different clusters. From a theoretical point of view, governments can stimulate EI by exploiting multiple (even combined) instruments: (i) environmental policy instruments, such as market-/ incentive-based instruments, command and control regulation ments, voluntary agreements or information-/education-based instru-ments; and/or (ii) innovation policy instruments, such as enforcing/ easing the intellectual property right (IPR) protection mechanism, al-locating tax credits for innovation, subsidising R & D activities, fa-vouring public R & D or establishing technology transfer instruments (Del Rìo et al., 2010).
Recently it has been argued that PP can be useful to support public research to facilitate advances at the technological frontier and also to meet the EU 2020 targets of socio-economic and environmental sus-tainability. The uptake of climate-friendly technologies (namely EI) may be influenced by public policies, since the transition to more sus-tainable production requires the invention, adoption and diffusion of radical and, consequently, riskier innovations, and high levels of in-vestment, which are unlikely to be sustainable by the private sector on its own (Mowery et al., 2010). Alternative-energy technologies are potentially deployed to replace already existing technologies and, in-itially, may be less reliable and/or more costly, and require public support for their early-stage deployment. As IPP reduces the investment risks inherent in radical innovations with uncertain markets and de-mand, and it can create niches for the emergence of early-stage en-vironmental technologies, it can be a valuable instrument to encourage their early adoption and to allow their easier diffusion. Furthermore, the more radical the innovation, the higher the entry and switching costs; the lack of adequate policy instruments can be associated with technological lock-in and path dependency effects favouring ‘dirtier’ established technologies (Oltra and Saint Jean, 2009). As IPP can create niches that EI can exploit, coherently with the‘lead market approach’ (Beise and Rennings, 2005; Edler and Georghiou, 2007; Horbach et al., 2014), it can favour the early-stage adoption of EI to make them widespread afterwards. Overall, there is agreement that governmental
intervention is needed to favour the adoption and diffusion of EI and that IPP might be well positioned to be a valuable policy instrument to this end. However, there is still no empirical confirmation that IPP ef-fectively stimulates EI.
This paper draws on the literature described so far and itfills this research gap by empirically testing whether or not IPP affects firms' environmental strategies. As stated in the introduction, it is thefirst empirical analysis testing the role of IPP as a policy instrument for EI. For the reasons outlined above, the expectation, and consequently the main research hypothesis, is that IPP positively influences firms' choices towards the adoption of EI.
3. Data and empirical strategy
The recent Innobarometer dataset, entitled Flash Eurobarometer 415: Innobarometer 2015 - The Innovation Trends at EU Enterprises (EC, 2015), is exploited for the empirical strategy. The survey was carried out in February 2015 by the consortium TNS Political and Social using a computer-assisted telephone interviewing (CATI) system, at the request of the European Commission Directorate-General for Internal Market, Industry, Entrepreneurship and SMEs (DG GROW) and under the co-ordination of the Directorate-General for Communication. It covers businesses with one or more employees in the manufacturing, service and industry sectors and the sample is stratified by size, sector and country. Respondents were general managers, financial directors or owners. It is a valuable source of information, as it is the only available survey that combines, at thefirm level, information on public pro-curement with information on the adoption of environmental innova-tions. Data on the role of IPP and the adoption of sustainable manu-facturing technologies (or EI) are collected only for manumanu-facturing firms; therefore, the analysis in this paper focuses on manufacturing firms in the EU, Switzerland and the USA and covers all businesses with one or more employees. The full sample, representative of all sectors, amounts to 14,118, but only 3018 of them are manufacturingfirms, thus limiting the operative sample to the latter number, which falls to 3001 after cleaning for the missing variables of interest.
The dependent variable EI takes the value 1 whether thefirm has adopted sustainable manufacturing technologies or is planning to adopt them in the next 12 months. Those are defined in the survey as tech-nologies which use energy and materials more efficiently and drasti-cally reduce emissions.
The core variable of interest, IPP, exploits two questions of the survey, the first aimed at scrutinising whether or not the firm has participated (with or without success) in a PP tender and the second aimed at understanding whether or not innovation was part of the contract (seeTable 2for the full text of the questions). Unfortunately, no information is available on howfirms submit their tender proposals and no qualitative information on the tender is provided.2An overview of the responses given to thefirst of these questions gives an interesting and qualitative picture on the nature and magnitude of the PP phe-nomenon. In the operative sample, 30% of respondents (915 firms) declared that they had submitted at least one tender for a PP contract since January 2012 (with a positive, unknown or negative outcome) and 24% of respondents (702firms) had won at least one PP tender. Interestingly enough, 44% of respondents that had won at least a PP tender declared that they had included innovations as part of the pro-curement contract.
To construct the empirical strategy properly, the main empirical issue to consider is that the assignment of IPP tofirms may be non-randomised: (i)firms submitting a IPP proposal may be self-selected on certain observable characteristics; or (ii) public agencies may try to maximise the effects of the policy by imposing selection criteria related tofirms' characteristics, as part of a strategy of ‘picking the winner’ or
(contrarily)‘aiding the poor’. In other words, there is a potential se-lection problem both on the side of firms and on the side of public funding agencies. Estimating the effect of IPP on EI directly in such a setting could distort the interpretation of results, since the magnitude of the difference in environmental innovativeness depends not only on the consequences of the technology policy.3The non-neutral application and funding process, thoroughly discussed by David et al. (2000), suggests the need to rule out problems of simultaneity and selection bias and to choose a quasi-experimental approach and non-parametric matching method, widely applied in public funding evaluation articles in the field of industrial economics (Almus and Czarnitzki, 2003; Czarnitzki and Lopes-Bento, 2014).
This approach considers IPP to be the treatment variable and di-vides the total sample (3001firms) into a treated group (308 firms) and a control group (2693firms), depending on whether or not firms won a tender for a PP contract explicitly requiring innovations. As expected, and confirmed by the statistics reported inTable 1, the two groups are significantly different. Treated firms are more likely to be environ-mental innovators, are older, are more innovative and have fewer employees than control firms, as is confirmed by t-tests comparing mean differences, whose significance is reported in the last column.
The average treatment effect on the treated firms (ATT), that is the estimation of the effects of IPP on the outcome (EI), is equal to the difference between the average of the target variable EI when the firm is treated (Y1) and the average of the target variable EI when the same
firm is untreated (Y0).
Under random assignment, the independence assumption in Eq.(1) holds, IPP is fully exogenous and the ATT effects of the treatment (IPP) could be estimated as simple between-groups mean difference in the outcome variable EI, as in Eq.(2).
⊥
(Y ; Y ) IPP1 0 (1)
= − = = = − =
= − = =
E(Y | IPP 1) E(Y | IPP 0) E(Y | IPP 1) E(Y | IPP 0) E(Y ) E(Y ) ATT( ATE)
1 0
1 0 (2)
However, as explicitly discussed in this section, the independence assumption does not hold in this setting, as IPP is not exogenous; rather, it is expected to be influenced by certain observable characteristics of firms that drive selection of who gets the treatment and who is ex-cluded.
To properly estimate the effect of IPP as the difference in EI
outcomes depending only on it, ATT should be estimated as in Eq.(3), and each treatedfirm needs to be compared with a hypothetical sce-nario where the samefirm receives no treatment, as the treated and control groups would be different in the outcome even in the absence of the treatment, or, formally:
= − = + = − =
ATT E[Y1 Y | IPP0 1] E[Y | IPP0 1] E[Y | IPP0 0] (3) where:
= − = ≠
E[Y | IPP0 1] E[Y | IPP0 0] 0 (4)
Since the counterfactual situation E[Y0| IPP = 1] is not observable,
as it is not possible to forecast a recipientfirm's EI performance in the absence of the treatment, a non-parametric approach is applied to create comparable groups of firms. Specifically, propensity score matching (PSM) is exploited to create the best pairs of treated and controlfirms. This matching is needed to be able to compare the means of outcomes of pairedfirms in EI in order to estimate ultimately the unbiased effect of the public funding IPP. This pairing is conducted on the basis of their propensity score values, a methodology that allows us to summarise the multidimensionality of the matching criteria as one single value, the propensity score, aimed at capturing the probability thatfirm i accesses the treatment (Rosenbaum and Rubin, 1983). If the common support condition, the stable unit treatment value assumption and the unconfoundedness, or conditional independence assumption, hold, the average treatment effect can be estimated as the difference in the outcome variable EI between the two paired groups of firms, namely treated and controlfirms. The stable unit treatment value as-sumption (SUTVA) assumes that the treatment offirm i does not affect the outcome of another unit. The common support condition requires that the vector of chosen covariates does not perfectly predict the outcome: covariates themselves should not perfectly predict whether firm i receives PP or not. The conditional independence assumption requires that, once it is controlled for all observable variables, the po-tential outcomes are independent of treatment assignment. In this fra-mework, no unobserved factor should influence both PP and EI.Cerulli (2015)discusses the implications and tests of these conditions. Should all these conditions hold, PSM produces unbiased estimates of the effect of the treatment (IPP) on the outcome (EI).
Propensity scores are computed as the probability of receiving the treatment conditional on a set of observable characteristics that simulta-neously influence the decision to engage in IPP and the outcome EI. Selected observable characteristics, constructed at thefirm level, are the perception offinancial constraints as a barrier to firms' innovative activity (FIN), being part of a group (GROUP), the size of thefirm in terms of full-time equivalent employees, as a natural logarithm (Lsize), a positive in-vestment in R & D activities (RD), whether thefirm is young or not, de-pending whether it was established after or before January 2014 Table 1
Description of the variables, statistics and t-test on mean differences.
Variable Description Min. Max. Mean
Full sample (n = 3001) Treated (IPP = 1) Control (IPP = 0) t-Test on mean differences EI The company has adopted sustainable manufacturing
technologies or plans to adopt them in the next 12 months
0 1 0.381 0.497 0.368 ⁎
FIN The company perceives a lack offinancial resources 0 1 0.251 0.221 0.255 NS
GROUP The company is part of a group 0 1 0.313 0.351 0.308 NS
Lsize Natural logarithm of full-time equivalent employees 0 10.08 3.478 3.84 3.44 ⁎
IPP The company won at least one PP contract and included an innovation as part of this contract
0 1 0.103 – – –
RD The company invests in R & D activities 0 1 0.528 0.660 0.513 ⁎
Size Firm's size measured by full-time equivalent employees 1 23,764 162.78 289.16 148.33 ⁎
YOUNG The company was established after January 2014 0 1 0.0746 0.045 0.778 ⁎
⁎Variable mean differences between the two groups are statistically different from zero (t-test p-value < 0.05); NS, the difference between the groups is not statistically different.
3A logit model is estimated with EI as the dependent variable and IPP, standard control
variables, and state and sector dummies as the explanatory variables, and a significant positive effect of PP on EI is found. However, this result (estimates available upon re-quest) is not reliable given the sources of bias described. Accordingly, this result will not be presented.
(YOUNG), and seven sector dummies.4Table 2reports the questions asked in the survey and links them to the aforementioned variables.
Fig. 1depicts the propensity score distribution between the groups, before and after the matching, and shows the reduction in group
differences after the matching and its good quality.
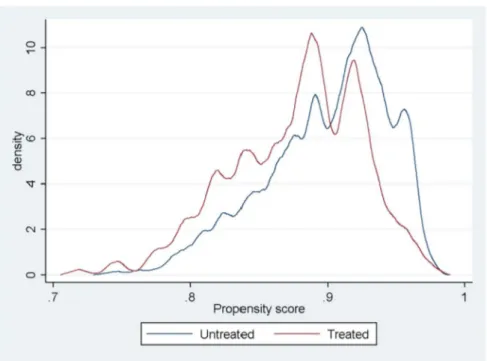
Fig. 2depicts the test for the overlap assumption and shows there is no evidence of this being violated: there is no high probability mass close to 0 or 1, and there are two estimated densities with most of their masses in regions where they overlap.
4. Discussion of results
Once the quality of the propensity scores is confirmed, they are used for the non-parametric matching. The choice is to ground the matching on al-ternative algorithms to better balance the trade-off between bias and effi-ciency (Caliendo and Kopeinig, 2008). The three nearest neighbour Table 2
Questions asked in the survey.
Question Variable
•
(Q11A) Have you used any of the following technologies? (Y/N)◦ Sustainable manufacturing technologies (i.e. technologies which use energy and materials more efficiently and drastically reduce emissions)
•
(Q11B) Do you plan to use any of the following technologies in the next 12 months?◦ Sustainable manufacturing technologies (i.e. technologies which use energy and materials more efficiently and drastically reduce emissions)
EI
•
(Q12) Since January 2012 has your company (One possible choice): ◦ Won at least one public procurementacontract◦ Submitted at least one tender for a public procurement contract and the outcome is unknown ◦ Submitted at least one tender for a public procurement contract without success
◦ Investigated opportunities to bid on one or more public procurement contracts, but have never submitted a tender ◦ Has never submitted a tender nor investigated opportunities to bid on a public procurement contract
•
(Q13) Has your company included any of its innovations as part of any public procurement contract that you have won? (Y/N)IPP
•
(D2) When was your company established (One possible choice): ◦ Before 1 January 2009◦ Between 1 January 2009 and 1 January 2014 ◦ After 1 January 2014
YOUNG
•
(D4) Is your company part of a group? (Y/N) GROUP•
(Q5A–Q5B) Thinking about the commercialisation of your company's innovative goods or services since January 2012, have any of the following been a major problem, a minor problem or not a problem at all?◦ Lack of financial resources: a major problem
FIN
•
(Q4_4) Since January 2012, what percentage of its total turnover has your company invested in Research and development (R & D)? ◦ 0%◦ < 1% ◦ 1–5% ◦ > 5%
RD
•
Size of the company, sample information LsizeNote: Additional possible answers to the original questions which are not relevant have been omitted to improve the clarity of the table.
aThe read-out provided to the respondents states:‘the term “public procurement” describes the purchase of goods, services and public works by governments and public bodies’.
Fig. 1. Propensity score distribution for treated and control groups before and after matching.
4The seven sector dummies included are CA, CB, CC, CD-CG, CH, CI-CL and CM
(Statistical classification of economic activities in the European Community (NACE) Second Revision). Because of data constraints it was not possible to impose country as an observable characteristic upon which to construct the pairing of treated and controlfirms, as none of the algorithms succeeded infinding, within each and every country (30 in the sample), pairs offirms which were similar enough in terms of the remaining observable characteristics.
matching (3NNM) algorithm is the selected algorithm; to provide robust-ness, results under alternative algorithm are also reported. The 3NNM method selects for comparison only the three observations whose propensity scores values are closest to those of treatedfirm i. The alternative algorithms presented are a single nearest neighbour matching (NNM), a 3NNM with a caliper set to impose a minimum degree of quality on the matching, afive nearest neighbour matching (5NNM) and a kernel matching estimator with bootstrapped standard errors (1000 repetitions).5 All tests for matching quality support the validity of the matching: regression t-tests on differences in covariates means after the matching shows that all p-values are lower than 0.05, the log-likelihood ratio is rejected before the matching and not rejected after the matching, pseudo-R2is lower in the matched than in the
unmatchedfirms and the standardised mean bias test falls below 5%. The results of the 3NNM on NNM, 3NNM with a caliper, 5NNM and kernel matching are reported inTable 3, column (1).
Overall, IPP is a significant driver of EI: the ATT (that is, the dif-ference in outcome averages between the treated and control groups after pairing) is positive and significant for the alternative matching algorithm adopted. The number offirms that are environmentally in-novative after being treated by IPP is 11.1 percentage points higher in the treated group than in the control group. This result is comparable across the alternative matching algorithms selected.
To better control for the validity of the results, an important sen-sitivity test is conducted and reported in Table 3, column (2). The homogeneity of firms in the two groups (treated and control) is in-creased by excludingfirms that said they had never submitted an IPP tender or explored the possibility of doing so. The rationale for this sensitivity test is that control and treated group might be too different to be comparable, even after matching, when thefirst includes firm that have not even tried to participate in a tender, in case those are struc-turally different from firms that have tried (successfully or not) to win a PP tender. This poses the risk of affecting the estimation of the effect of IPP for treated firms. After this exclusion, the treated group remains unaltered (308firms) while the control group is reduced to 945 firms. The quality of the matching is confirmed and is reported in the Appendix A. Even with the exclusion, results, reported in column (2),
largely confirm previous findings. Firms that are environmentally in-novative after treatment by IPP are 11.2 percentage points higher in the treated group than in the control group.
Finally, to provide a more comprehensive picture of IPP, its effects on more‘standard’ innovative outcome are estimated. A variable INNO is constructed, which is equal to 1 iffirms are either product or process innovators, and it is used as an outcome variable in the estimates of ATT of IPP treatment. Results (column (3)) show that the effect on more standard innovative outcomes remains significant and positive but is half of that for EI: the number offirms in the treated group is only 6.6 percentage points higher than in the control group. In relation to EI, IPP has twice the effect of standard innovations.
This interesting result can be explained by the introduction of specific policy commitments towards‘green’ PP, such as the European Green Public Procurement Initiative (EC, 2008). Those explicit policy commitments to-wards a green-oriented PP may have led to a transition toto-wards greener PP tenders and, as a consequence, to a higher increase in the environmental
Fig. 2. Overlap assumption.
Table 3
Results and robustness of alternative algorithm and alternative sampling.
Algorithm (1) (2) (3)
ATT ATT reduced sample ATT outcome INNO
3NNM 0.111⁎⁎⁎ 0.112⁎⁎⁎ 0.066⁎⁎⁎ (0.033) (0.037) (0.025) NNM 0122⁎⁎⁎ 0.101⁎⁎⁎ 0.067⁎⁎ (0.038) (0.041) (0.028) 3NNM calipera 0.098⁎⁎⁎ 0.150⁎⁎⁎ 0.064⁎⁎ (0.034) (0.037) (0.025) 5NNM 0.107⁎⁎⁎ 0.116⁎⁎⁎ 0.060⁎⁎ (0.032) (0.036) (0.024) Kernelb 0.121⁎⁎⁎ 0.126⁎⁎⁎ 0.077⁎⁎⁎ (0.029) (0.032) (0.024)
Note: Standard error in parentheses. Preferred algorithm in bold.
⁎p < 0.10. ⁎⁎p < 0.05. ⁎⁎⁎p < 0.01.
aCaliper = 0.25 times propensity scores' standard error. It equals 0.0114 in the whole
sample (columns (1) and (3)) and 0.0198 in the reduced sample (column (2)).
bBootstrapped standard error, 1000 repetitions.
5The teffects psmatch command in Stata14 is used to calculate ATT, since it estimates
standard errors adjusted for thefirst-step estimation of propensity scores, as suggested by Abadie and Imbens (2016). The balancing property of the propensity score is tested using theBecker and Ichino (2002)user-written Stata command pscore and is satisfied.
innovativeness offirms than in their ‘standard’ innovativeness.6
All in all, the results largely confirm that this policy instrument has a positive and significant effect and highlight the need to consider it to build a policy mix to stimulate firms' environmental innovativeness and, more broadly, the transition to a more sustainable society.
An explanation of these results, and in particular through which mechanisms IPP affects EI, comes from the literature reviewed in Section 2. As the full social costs of greenhouse gas emissions and pollution in general are not (yet) reflected in market prices (Fischer and Newell, 2008; Newell, 2010), there is room for public policies to compensate for the risk of under-investment in environmental innova-tions due to the absence of proper market signalling. Furthermore, the early versions of most alternative energy technologies would be han-dicapped in comparison with existing, dirtier technologies from the point of view of prospective adopters, given the high risks associated with those technologies in all stages of the innovation process, from invention to development to commercialisation and diffusion. EI may thus require public support, particularly for early adopters of those technologies. Given the features of PP as an instrument that helps to reduce the risks of innovation investments for which the demand is unknown, the expected market size is very low or development is un-certain, the paper argues that PP may be well placed to stimulate EI, as they may suffer (even more than ‘standard’ innovation) from techno-logical lock-in in favour of dirtier and more established technologies.
Before we discuss the main policy implications of thesefindings, the next subsection outlines an additional robustness control that has been performed to confirm the validity of the results.
4.1. Robustness checks on environmental regulation
As a further robustness control, the role of existing environmental regulation in spurring the adoption of EI is accounted for. As the lit-erature on EI largely agrees that regulatory push and pull stimulus is a core determinant of EI (Frondel et al., 2008; Ghisetti and Pontoni, 2015; Horbach et al., 2012; Rennings, 2000), its omission may bias the results, if EI adoption is driven by specific environmental regulation rather than by any IPP tender. The OECD Environmental Policy Stringency com-posite indicator (OECD EPS) is used to extract country-level indices on the stringency of environmental regulation. This index, ranging from 0 to 6, is selected because it allows international comparability over time (Botta and Koźluk, 2014). It measures the stringency of environmental regulation by putting an explicit or implicit price on polluting or en-vironmentally harmful behaviours and it is based on the degree of stringency of multiple environmental policy instruments, primarily re-lated to climate and air pollution.
As this index is not available for the whole set of countries covered in the previous sections, this analysis is considered only as a robustness control rather than being the principal choice. The following countries are excluded from the robustness check because of data limitations: Bulgaria, Croatia, Cyprus, Estonia, Latvia, Lithuania, Luxembourg, Malta, Romania and Slovenia. Thefinal number of observations falls to 2238, of which 235 are treated and 2003 are not. The last available year (2012) of the index is used to construct the variable EPS, which has been included as an additional explanatory variable of EI.
The results, reported in Table 4, are consistent with previously outlined evidence: ATT using a 3NNM is significant and equals 0.121; it equals 0.129 when a caliper of 0.0125 is imposed.
The previous findings – although not directly comparable, given that n changes, as do the included countries – are confirmed: the number offirms that are environmentally innovative after treatment by IPP is 12 percentage points higher in the treated group than in the
control group, even after controlling for environmental regulation.
5. Concluding remarks
The results previously discussed confirm the expectation that IPP has a role in stimulating the uptake of EI, and thus, indirectly, in con-tributing to the grand societal challenge of climate change. This evi-dence has been proven to be robust to different robustness controls.
Procurement is increasingly seen as a way to improve sustainability. The United Nations 2030 Agenda for Sustainable Development ex-plicitly refers to the need for countries to promote sustainable procure-ment as one of the Sustainable Developprocure-ment Goals (UN, 2015). The European Commission's Green Public Procurement initiative (EC, 2008) sets a non-binding green public procurement target to favour im-provements in the environmental, energy and social performance of products and services and to stimulate their development. The present paper has combined this view in the current article with the increasing interest in procurement as a way to stimulate innovation, as pointed out in the discussion of the innovation literature inSection 2.
All in all, the current empiricalfindings allow us to add a piece of information that is relevant to shaping environmental as well as in-novation policies, with important policy implications. Overall, they support the view that IPP can play a role in improving sustainability through the increased adoption of EI byfirms. This would allow the discussion on the role of sustainable procurement in reaching sustain-ability targets to merge with that on the role of innovative procurement in stimulating innovation, so that we can reach thefinal synthesis that IPP is a policy tool that can positively stimulate not only (standard) innovations but also the peculiar typology of EI. The latter are capable of hitting environmental as well as economic sustainability targets, possibly leading to win-win outcomes (EEA, 2014) and helping the transition to a more sustainable society.
The results of this article go in this direction and suggest that de-mand can affect the rate of adoption of EI and, more precisely, that IPP strongly stimulates EI adoption. This would call for including IPP in the array of innovation policy instruments as well as in the array of reg-ulatory push-pull instruments for decarbonisation, to allow us to meet the sustainability targets that have been set. The literature has indeed already confirmed the role of EI in enhancing competitiveness (Ambec et al., 2008; Porter and Van der Linde, 1995) and reducing environ-mental pressure (Ghisetti and Quatraro, 2017). The diverse nature of innovations, and EI more specifically, indicates the need to be cautious, as a one-size-fits-all model of procurement is unlikely to work: as dis-cussed by Uyarra and Flanagan (Uyarra and Flanagan, 2010), the in-novative procurement model might not work in all procurement con-texts and for all types of goods and services.
A limitation of the current study is that the data used do not shed light on the design of the PP instrument, which instead affects how successful this instrument is in stimulating innovation (Geroski, 1990). PP policy measures might suffer from the presence of perceived barriers to the suppliers (Uyarra et al., 2014) and from the lack of a systematic basis in their design, which results in deficiencies that eventually cause the policy to fail (Georghiou et al., 2014). A further limitation is the Table 4
Results and robustness of alternative algorithm and alternative sampling.
Algorithm ATT including OECD EPS variable
(N = 2238)
3NNM 0.121⁎⁎⁎
(0.0404)
3NNM caliper of 0.0125 0.129⁎⁎⁎
(0.0395)
Standard error in parentheses. Preferred algorithm in bold.
⁎⁎⁎p < 0.01.
6Unfortunately the dataset allows us only to infer this interpretation, as it contains no
information on whether or not the IPP tender also included environmental requirements. Consequently, it cannot be properly tested and it is left for future research.
cross-sectional nature of the data, which does not allow the formulation of causal connections between the variables analysed.
The current research has implications for future studies. It has identified interesting research directions, and left them to future re-search because of constraints and limitations on the data. Quantitative information on the number of tenders that each firm applied for or (even better) won is not available, and it would be of interest to test if IPP affects EI differently depending on whether the firm has a broad and/or deep experience in tenders or is rather immature in thisfield. Secondly, it would be an interesting extension of this work to consider the role of a policy mix that includes IPP policy tools in stimulating EI, asGuerzoni and Raiteri (2015)do with respect to‘standard’ innova-tions. The last interesting extension would be to use panel data to im-prove the conclusion about whether or not there are causal connections between EI and IPP.
Acknowledgment
The author wishes to thank all the participants to the Economics of Innovation and Knowledge BRICK-LEI seminar, to the 13th European Network on the Economics of the Firm (ENEF) 2016 (Turin) meeting, to the 5th edition of the international conference Governance of a Complex World 2016 (Valencia), to the New Developments in Eco-Innovation Research Workshop 2016 (ZEW, Mannheim), to thefifth Italian Association of Environmental and Resource Economists Annual conference 2017 (Rome) and Alberto Marzucchi for fruitful insights and comments. The views expressed are those of the author and do not imply a policy position of the European Commission. Neither the European Commission nor any person acting on behalf of the Commission is responsible for the use which might be made of this publication.
Appendix A
Estimates of the treatment effects of IPP have been carried out on a smaller sample of firms in the control group to exclude all firms that said they had never submitted a PP tender or explored this possibility. This would in principle increase the homogeneity offirms between the treated and control groups to comparefirms that have won a PP tender and those that have at least tried to win one. The methodology is the same described in the article; the chosen matching algorithm is the 3NNM. Tests confirm the quality of the matching (Figs. A1 and A2).
Fig. A1. Distribution of propensity scores in reduced sample.
Fig. A2. Overlap assumption in reduced sample.
Results of thefirst step logistic estimation of the propensity scores used for the matchings in the article are reported inTable A1. Thefirst column shows those of the full sample and the second column shows those of the reduced sample.
Table A1
Robustness on alternative algorithm on subsample offirms.
Propensity score Propensity score on reduced sample
Lsize 0.1156⁎⁎⁎ 0.1090⁎⁎
(0.0425) (0.0455)
GROUP −0.1518 −0.1690
YOUNG −0.4084 −0.3905 (0.2856) (0.3055) RD 0.4835⁎⁎⁎ 0.4171⁎⁎⁎ (0.1323) (0.1410) FIN −0.0546 −0.2112 (0.1495) (0.1618) Constant −2.4237⁎⁎⁎ −1.5670⁎⁎⁎ (0.2088) (0.2289) N 3001 1253 Pseudo-R2 0.0336 0.0307
Note: Standard error in parentheses. Seven sector dummies included.
⁎p < 0.10. ⁎⁎p < 0.05. ⁎⁎⁎p < 0.01.
References
Abadie, A., Imbens, G.W., 2016. Matching on the estimated propensity score. Econometrica 84 (2), 781–807.
Aho, E., Cornu, J., Georghiou, L., Subirá, A., 2006. Creating an innovative Europe. In: Report of the Independent Expert Group on R & D and Innovation Appointed Following the Hampton Court Summit and Chaired by Mr. Esko Aho, Luxembourg. Almus, M., Czarnitzki, D., 2003. The effects of public R & D subsidies on firms' innovation
activities: the case of Eastern Germany. J. Bus. Econ. Stat. 21 (2), 226–236. Ambec, S., Lanoie, P., Stefan, A., Paul, L., 2008. Does it pay to be green? A systematic
overview. Acad. Manag. Perspect. 22 (4), 45–63.
Antonelli, C., Crespi, F., 2013. The“Matthew effect” in R and D public subsidies: the Italian evidence. Technol. Forecast. Soc. Chang. 80 (8), 1523–1534.
Arrow, K.J., 1962. Economic welfare and the allocation of resources for invention. In: Nelson, R.R. (Ed.), The Rate and Direction of Inventive Activity: Economic and Social Factors. Princeton University Press for NBER, Princeton, pp. 609–625.
Aschhoff, B., Sofka, W., 2009. Innovation on demand: can public procurement drive market success of innovations? Res. Policy 38 (8), 1235–1247.http://dx.doi.org/10. 1016/j.respol.2009.06.011.
Barbieri, N., Ghisetti, C., Gilli, M., Marin, G., Nicolli, F., 2016. A survey of the literature on environmental innovation based on main path analysis. J. Econ. Surv. 30 (3), 596–623.http://dx.doi.org/10.1111/joes.12149.
Becker, S.O., Ichino, A., 2002. Estimation of average treatment effects based on pro-pensity scores. Stata J. 2 (4), 358–377.
Beise, M., Rennings, K., 2005. Lead markets and regulation: a framework for analyzing the international diffusion of environmental innovations. Ecol. Econ. 52 (52), 5–17. http://dx.doi.org/10.1016/j.ecolecon.2004.06.007.
Bloom, N., Griffith, R., Van Reenen, J., 2002. Do R & D tax credits work? Evidence from a panel of countries 1979–1997. J. Public Econ. 85 (1), 1–31.
Botta, E., Koźluk, T., 2014. Measuring environmental policy stringency in OECD coun-tries. In: OECD Economics Department Working Papers No. 1177.
Bresnahan, T.F., Trajtenberg, M., 1995. General purpose technologies:“engines of growth”? J. Econ. 65 (1), 83–108.
Caliendo, M., Kopeinig, S., 2008. Some practical guidance for the implementation of propensity score matching. J. Econ. Surv. 22 (1), 31–72.
Cerulli, G., 2015. Econometric Evaluation of Socio-Economic Programs: Theory and Applications. Springer-Verlag, Berlin.
Czarnitzki, D., Lopes-Bento, C., 2014. Innovation subsidies: does the funding source matter for innovation intensity and performance? Empirical evidence from Germany. Ind. Innov. 21 (5), 380–409.
David, P.A., Hall, B.H., Toole, A.A., 2000. Is public R & D a complement or substitute for private R & D? A review of the econometric evidence. Res. Policy 29 (4–5), 497–529. Del Rìo, P., Carrillo-Hermosilla, J., Konnola, T., 2010. Policy strategies to promote
eco-innovation. J. Ind. Ecol. 14 (4), 541–557.
EC, 2008. Communication from the Commission to the European Parliament, the Council, the European Economic and Social Committee and the Committee of the Regions, Public Procurement for a Better Environment, COM/2008/0400. European Commission, Brussels.
EC, 2014. Communication from the Commission to the European Parliament, the Council, the European Economic and Social Committee and the Committee of the Regions, a Policy Framework for Climate and Energy in the Period From 2020 to 2030. European Commission, Brussels.
EC, 2015. Flash Eurobarometer 415: Innobarometer 2015– The Innovation Trends at EU Enterprises. Cologne: TNS Political & Social GESIS Data Archive ZA6589, Datafile version 1.0.0.http://dx.doi.org/10.4232/1.12383.
Edler, J., Georghiou, L., 2007. Public procurement and innovation: resurrecting the de-mand side. Res. Policy 36 (7), 949–963.http://dx.doi.org/10.1016/j.respol.2007.03. 003.
Edler, J., Yeow, J., 2016. Connecting demand and supply: the role of intermediation in public procurement of innovation. Res. Policy 45 (2), 414–426.http://dx.doi.org/10. 1016/j.respol.2015.10.010.
Edler, J., Georghiou, L., Blind, K., Uyarra, E., 2012. Evaluating the demand side: new challenges for evaluation. Res. Eval. 21 (1), 33–47.http://dx.doi.org/10.1093/ reseval/rvr002.
Edquist, C., Zabala-Iturriagagoitia, J.M., 2012. Public procurement for innovation as mission-oriented innovation policy. Res. Policy 41 (10), 1757–1769.http://dx.doi. org/10.1016/j.respol.2012.04.022.
Edquist, C., Hommen, L., Tsipouri, L., 2000. Public Technology Procurement and Innovation. Kluwer, Dordrecht.
EEA, 2014. Resource-efficient green economy and EU policies. In: European Environment Agency Report No. 2/2014, Copenhagen.
Fischer, C., Newell, R., 2008. Environmental and technology policies for climate miti-gation. J. Environ. Econ. Manag. 55, 142–162.http://dx.doi.org/10.1016/j.jeem. 2007.11.001.
Flanagan, K., Uyarra, E., Laranja, M., 2011. Reconceptualising the“policy mix” for in-novation. Res. Policy 40 (5), 702–713.http://dx.doi.org/10.1016/j.respol.2011.02. 005.
Foray, D., Mowery, D.C., Nelson, R.R., 2012. Public R & D and social challenges: what lessons from mission R & D programs? Res. Policy 41 (10), 1697–1702.http://dx.doi. org/10.1016/j.respol.2012.07.011.
Frondel, M., Horbach, J., Rennings, K., 2008. What triggers environmental management and innovation? Empirical evidence for Germany. Ecol. Econ. 6, 1–8.http://dx.doi. org/10.1016/j.ecolecon.2007.08.016.
Georghiou, L., Edler, J., Uyarra, E., Yeow, J., 2014. Policy instruments for public pro-curement of innovation: choice, design and assessment. Technol. Forecast. Soc. Chang. 86, 1–12.http://dx.doi.org/10.1016/j.techfore.2013.09.018.
Geroski, P., 1990. Procurement policy as a tool of industrial policy. Int. Rev. Appl. Econ. 4 (2), 182–198.
Ghisetti, C., Pontoni, F., 2015. Investigating policy and R & D effects on environmental innovation: a meta-analysis. Ecol. Econ. 118, 57–66.http://dx.doi.org/10.1016/j. ecolecon.2015.07.009.
Ghisetti, C., Quatraro, F., 2017. Green technologies and environmental productivity: a cross-sectoral analysis of direct and indirect effects in Italian regions. Ecol. Econ. 132, 1–13.http://dx.doi.org/10.1016/j.ecolecon.2016.10.003.
Ghisetti, C., Marzucchi, A., Montresor, S., 2015. The open eco-innovation mode: an em-pirical investigation of eleven European countries. Res. Policy 44 (5), 1080–1093. http://dx.doi.org/10.1016/j.respol.2014.12.001.
Guerzoni, M., Raiteri, E., 2015. Demand-side vs. supply-side technology policies: hidden treatment and new empirical evidence on the policy mix. Res. Policy 44 (3), 726–747. http://dx.doi.org/10.1016/j.respol.2014.10.009.
Helpman, E., Trajtenberg, M., 1994. A time to sow and a time to reap: growth based on general purpose technology. In: NBER Working Paper No. 4854.
Horbach, J., Rammer, C., Rennings, K., 2012. Determinants of eco-innovations by type of environmental impact: the role of regulatory push/pull, technology push and market pull. Ecol. Econ. 78, 112–122.http://dx.doi.org/10.1016/j.ecolecon.2012.04.005. Horbach, J., Oltra, V., Belin, J., 2013. Determinants and specificities of eco-innovations
compared to other innovations: an econometric analysis for the French and German industry based on the Community Innovation Survey. Ind. Innov. 20 (6), 523–543. Horbach, J., Chen, Q., Rennings, K., Vögele, S., 2014. Do lead markets for clean coal
technology follow market demand? A case study for China, Germany, Japan and the US. Environ. Innov. Soc. Transit. 10, 42–58.
Hussinger, K., 2008. R & D and subsidies at thefirm level: an application of parametric and semiparametric two-step selection models. J. Appl. Econ. 23, 729–747. Laranja, M., Uyarra, E., Flanagan, K., 2008. Policies for science, technology and
in-novation: translating rationales into regional policies in a multi-level setting. Res. Policy 37 (5), 823–835.http://dx.doi.org/10.1016/j.respol.2008.03.006. Lundberg, S., Marklund, P.-O., 2011. The pivotal nature of award methods in green public
procurement. Environ. Econ. 2 (3), 64–73.
Marin, G., Marzucchi, A., Zoboli, R., 2015. SMEs and barriers to eco-innovation in the EU: exploring different firm profiles. J. Evol. Econ. 25 (3), 671–705.
Mowery, D.C., Nelson, R.R., Martin, B.R., 2010. Technology policy and global warming: why new policy models are needed (or why putting new wine in old bottles won't work). Res. Policy 39 (8), 1011–1023.http://dx.doi.org/10.1016/j.respol.2010.05. 008.
Nelson, R.R., 1982. Government and Technical Progress: A Cross-Industry Analysis. Pergamon Press, Oxford.
Newell, R.G., 2010. The role of markets and policies in delivering innovation for climate change mitigation. Oxf. Rev. Econ. Policy 26 (2), 253–269.http://dx.doi.org/10. 1093/oxrep/grq009.
OECD, 2011. Demand-Side Innovation Policies. OECD Publishing, Paris.
OECD, 2015. Going Green: Best Practices for Sustainable Procurement. OECD Publishing, Paris.
Oltra, V., Saint Jean, M., 2009. Sectoral systems of environmental innovation: an appli-cation to the French automotive industry. Technol. Forecast. Soc. Chang. 76 (4), 567–583.http://dx.doi.org/10.1016/j.techfore.2008.03.025.
Parikka-Alhola, K., 2008. Promoting environmentally sound furniture by green public procurement. Ecol. Econ. 68 (1–2), 472–485.http://dx.doi.org/10.1016/j.ecolecon. 2008.05.004.
Porter, M.E., Van der Linde, C., 1995. Toward a new conception of the en-vironment–competitiveness relationship. J. Econ. Perspect. 9 (4), 97–118. Rennings, K., 2000. Redefining innovation: eco-innovation research and the contribution
from ecological economics. Ecol. Econ. 32, 319–332.
Rizzi, F., Frey, M., Testa, F., Appolloni, A., 2014. Environmental value chain in green SME networks: the threat of the Abilene paradox. J. Clean. Prod. 85, 265–275.http://dx. doi.org/10.1016/j.jclepro.2014.09.001.
Rosenbaum, P.R., Rubin, D.B., 1983. The central role of the propensity score in ob-servational studies for causal effects. Biometrika 70 (1), 41–55.http://dx.doi.org/10. 1093/biomet/70.1.41.
Ruttan, V.W., 2006. Is War Necessary for Economic Growth? Military Procurement and Technology Development. Oxford University Press, Oxford.
Testa, F., Annunziata, E., Iraldo, F., Frey, M., 2016. Drawbacks and opportunities of green public procurement: an effective tool for sustainable production. J. Clean. Prod. 112, 1893–1900.http://dx.doi.org/10.1016/j.jclepro.2014.09.092.
UN, 2015. Transforming our world: the 2030 agenda for sustainable development, re-solution adopted by the general assembly of the United Nations on 25 September 2015.http://www.un.org/ga/search/view_doc.asp?symbol=A/RES/70/1&Lang=E.
UNEP, 2013. Sustainable Public Procurement: A Global Review. United Nations Environment Programme(http://www.scpclearinghouse.org/upload/publication_ and_tool/file/437.pdf).
Uyarra, E., Flanagan, K., 2010. Understanding the innovation impacts of public pro-curement. Eur. Plan. Stud. 18 (1), 123–143.
Uyarra, E., Edler, J., Garcia-Estevez, J., Georghiou, L., Yeow, J., 2014. Barriers to in-novation through public procurement: a supplier perspective. Techin-novation 34 (10), 631–645.http://dx.doi.org/10.1016/j.technovation.2014.04.003.
Vecchiato, R., Roveda, C., 2014. Foresight for public procurement and regional innova-tion policy: the case of Lombardy. Res. Policy 43 (2), 438–450.http://dx.doi.org/10. 1016/j.respol.2013.11.003.
Claudia Ghisetti currently works as a researcher for the Joint Research Centre (JRC) of the European Commission. She holds a PhD in European Law and Economics (University of Bologna) and she has been visiting researcher at GREDEG-CNRS, University of Nice-Sophia Antipolis and at the Center for European Economic Research (ZEW) in Mannheim. Before joining the JRC she has been post-doctoral research fellow at the Department of Economics and Management of the University of Ferrara (IT), and Research Associate at the inter-university Research Center on Sustainability Environmental Economics and Dynamics Studies (SEEDS).
Her expertise is in micro-economics empirical analysis in thefields of economics of innovation and environmental economics. She published her research in international journals such as Climate Policy, Ecological Economics, Research Policy, the Journal of Economic Surveys and the Journal of Cleaner Production.