High spatial resolution ozone risk-assessment for
Asian forests
To cite this article: Alessandra De Marco et al 2020 Environ. Res. Lett. 15 104095
View the article online for updates and enhancements.
Recent citations
Emerging challenges of ozone impacts on Asian plants: Actions are needed to protect ecosystem health Zhaozhong Feng et al
-Editorial: Interactions Between Ozone Pollution and Forest Ecosystems Elena Paoletti et al
-Economic impacts of ambient ozone pollution on wood production in Italy Sandro Sacchelli et al
Environmental Research Letters
OPEN ACCESS RECEIVED 15 May 2020 REVISED 17 August 2020 ACCEPTED FOR PUBLICATION 3 September 2020 PUBLISHED 14 October 2020Original content from this work may be used under the terms of the
Creative Commons Attribution 4.0 licence. Any further distribution of this work must maintain attribution to the author(s) and the title of the work, journal citation and DOI.
LETTER
High spatial resolution ozone risk-assessment for Asian forests
Alessandra De Marco1,2, Alessandro Anav1, Pierre Sicard3, Zhaozhong Feng4and Elena Paoletti2
1 Italian National Agency for New Technologies, Energy and the Environment (ENEA), Via Anguillarese 301, Rome, Italy 2 IRET-CNR, Via Madonna del Piano, Sesto Fiorentino, Italy
3 ARGANS, 260 route du Pin Montard, Biot 06410, France
4 Institute of Ecology, Key Laboratory of Agrometeorology of Jiangsu Province, School of Applied Meteorology, Nanjing University of Information Science & Technology, Nanjing 210044, People’s Republic of China
E-mail:[email protected]
Keywords: tropospheric ozone, phytotoxic ozone dose, forests, ozone risk-assessment, Asian forests Supplementary material for this article is availableonline
Abstract
Background tropospheric ozone (O3) is increasing particularly over China and India, and becomes
a major threat to Asian forests. By using the coupled WRF-Chem model at high spatial resolution
(8 km) over Asia in 2015, we showed that both standards AOT40 (European) and W126 (United
States) underestimated the O3 risk to deciduous forests and overestimated it to evergreen forests
compared to the biologically based metric POD1. Both metrics AOT40 and W126 showed different
spatial distribution and exceedance extent with respect to POD1. We found very high potential of
O3 impacts on deciduous forest growth in Asia, while potential O3 impacts on evergreen forest
types were lower. The most limiting factors were light availability, soil water content and air
temperature (65%, 29% and 6%, respectively), making this region of the globe at high O3 risk for
deciduous species and at medium O3 risk for evergreen species. For the first time, the O3 risk to
Asian forests was quantified at high spatial resolution; and our results suggested: (i) a relevant
overestimation of O3 risk to evergreen forests when using AOT40 and W126 relative to the more
biologically based POD1 metric; and (ii) a significant underestimation of O3 risk to the boreal
deciduous forests when using AOT40 and W126 relative to POD1 because of stomatal aperture
permissive condition.
1. Introduction
Tropospheric ozone (O3) is a seriously damaging
air pollutant affecting human health (World Health Organisation 2013, Fu and Tai 2015, Cohen et al 2017), materials (Screpanti and De Marco 2009) and vegetation (Lu et al 2018, Mills et al 2018). Despite effective control efforts and legislation to reduce O3 precursors emissions, such as nitrogen
oxides (NOx) and non-methanic volatile organic
compounds (NMVOCs), surface O3pollution is still
a major air quality issue over large regions of the globe (Sicard et al2017, Gaudel et al2018), and it is expected to increase in the future because of increas-ing methane emissions (Sicard et al2017) and climate change (Anav et al,2019). The high O3
concentra-tions found over China and India megacities pose a major threat to food production and other ecosystem services in Asia (Tai et al2014, Feng et al2019, Zeng
et al2019).
Several studies reported the decrease of surface O3
mean concentrations in United States (Lefohn et al 2010, Cooper et al2012, Lin et al2017) and West-ern Europe (Sicard et al2013, Paoletti et al2014, EEA 2016, Yan et al 2019). In contrast, in the last dec-ades Asia became the world’s largest emitter of O3
precursors (Hoesly et al 2018). In particular, China emits 30% and 19% of the global emissions of NOx
and NMVOCs, respectively, followed by India with 13% and 11% (Hoesly et al 2018). Some region of East Asia have experienced decreases of O3
precurs-ors emission in recent years such as Beijing, the Pearl River Delta, Taiwan and Japan, and additional work is required to understand the response of surface O3 (Duncan et al2016, Krotkov et al2016, Liu and
Wang2020). Recent analyses of Chinese O3
monit-oring stations (for the years 2015 and 2016) showed that O3 levels were well above the threshold set
to protect forests (Lu et al 2018, Feng et al 2019). All these considerations suggest that O3impacts on
vegetation is a relevant issue in Asia and thus warrant more investigations (Oksanen et al2013, Feng et al
2015).
Due to the lack of observations with sufficient spatial and temporal coverage, especially in South Asia, many studies have used global and regional scale models to supplement the missing informa-tion from in situ measurements (Kunhikrishnan et al 2006, Engardt 2008, Sheel et al 2010). In the past decades, the important role of numerical models has been increasingly recognized and numerous air dispersion or air quality models were developed at various scales to assist in understanding, predicting and controlling air pollution (Lamarque et al2013, Miranda et al2015). These models were successfully applied to air pollution investigation and manage-ment in populated cities and regions worldwide (e.g. Reis et al 2005, Calori et al 2006, Haase et al2014, Anav et al2016).
The current O3 pollution levels may lead to
adverse effects on forest trees in East and Southeast Asia (Lu et al 2018) where high species richness is present (Kier et al 2009). Although some informa-tion on the O3effects on plants species in East Asia is
available, the pollution situation of most Asian coun-tries is not yet well clarified (Koike et al2013). Main reason is the need of high-resolution regional model, to provide better estimates of air pollution with a lower bias and the second one is the low availabil-ity of tropospheric air qualavailabil-ity measurements, needed for model validation. Indeed mostly of the modelling information available for Asia are from global mod-els at horizontal resolution of e.g. ~50 km (Engardt 2008). Several air quality or chemical transport mod-els (CTMs) have been developed and ran to repres-ent the complex mechanisms involved in transport, transformation and deposition processes in East Asia (Han 2007). The CTMs were applied to study air pollution for China as a whole (Hu et al 2016, Li
et al 2016) and for several Chinese regions (Wang
et al2012, Liao et al 2015). Hu et al (2016) applied the Community Multi-scale Air Quality (CMAQ) and Weather Research Forecasting (WRF) modelling system to predict air pollutant concentrations over China. The results showed an overestimation of 1 h and 8 h O3averages, probably due to the coarse
hori-zontal resolution (36 km). A modified WRF-CMAQ modelling system was used to simulate O3
concen-trations in winter (December 2014–February 2015) and summer (June–August 2015) for the Sichuan Basin (Qiao et al2019). Most of the basin was found to exceed the World Health Organisation (WHO) guidelines for 8 h O3 on >70% of winter days and
>40% of summer days. The 1 h and 8 h O3
aver-ages were both greatly over-predicted in winter, but the model performance was acceptable in summer, when the photochemical production of O3 due to
anthropogenic emissions should be strongest in the basin (Qiao et al2019).
The availability of station data used to validation chemistry models was a main issue in this area due to the scarcity of monitored information (Li et al2007). Recently, few authors have validated CTMs results with in situ and satellite observations (e.g. Kumar et al 2012, Sharma et al 2016, Sicard et al 2020). As an example, the WRF-CMAQ model was used in India with different spatial resolution for emissions and meteorological inputs (e.g. 36 km) to assess source and species sensitivities of ground-level O3
concen-trations (Chatani et al2014, Sharma et al2016). Sim-ulations of O3and its precursors have been
conduc-ted using the updaconduc-ted version-2 (HTAP-v2) emission inventory and the offline global chemistry transport model MOZART-4 (Surendran et al2015), showing reasonable model performance, but some disagree-ment in O3 concentrations and seasonal variation
over South Asia were still evident (Surendran et al
2015).
Forests in Asia are important for carbon sequest-ration (Fang et al 2001, Yu et al 2014) and biod-iversity conservation (Myers et al 2000). China has been implementing the most ambitious afforestation programs in the world (Zhang et al2017). Thus, it is important to estimate O3 impacts on forest
ecosys-tems in an area characterized by many different cli-matic conditions and plant species (Xu et al2010).
Different criteria have been developed to define O3 risk assessment for forests (Lefohn et al 2018).
A concentration-based metric, i.e. AOT40 defined as the sum of hourly O3 concentration exceeding
40 ppb across daily and seasonal time windows, is currently used in the European legislation for O3
risk assessment (CLRTAP 2017). The second met-ric, i.e. PODY, developed more recently in Europe, is based on phytotoxic O3 dose entering the leaves,
depending on the stomatal aperture (Paoletti and Manning2007), with an hourly threshold Y that is set to 1 nmol m−2 s−1 for forests (CLRTAP2017). The two metrics showed inconsistent spatial (Anav
et al 2016) and temporal patterns (De Marco et al 2015) from local to regional scales over Europe. The current standard recommended in United States for forest protection is W126 (US Federal Register2015), defined as the sum of the hourly O3 concentrations
during the growing season, and each concentration is weighted by a sigmoidal function to assign greater emphasis to the highest concentrations (Lefohn et al 2018). Ozone critical levels (CLs) were developed for the three metrics, intended as dose (POD1) or concentration below which no effect on forests is expected (Büker et al 2015), that showed a differ-ent sensitivity between evergreen (lower) and decidu-ous species (higher) (Sicard et al2016). Information on PODY in Asia is still limited to specific coun-tries by modelling approaches (e.g. Japan, Hoshika
et al2017) or specific locations with poplar only (Hu
et al2015, Shang et al2017). Tang et al (2013) eval-uated the magnitude and distribution of O3-induced
wheat production loss in China and India using flux-based methods (POD6) and compared different O3
dose metrics (AOT40 and POD6) with a resolution of 40 km. At the moment, similar risk assessment is not available for forests in the same region. There-fore, there is an urgent need to perform regional sim-ulations of POD1 to provide high spatial resolution inputs for a more realistic O3 risk assessment for
forests over Asia.
The main aims of the present study were to (i) evaluate magnitude and distribution of O3 risk to Asian forests at high spatial resolution, by compar-ing concentration-based (AOT40 and W126) and uptake-based (POD1) metrics; (ii) assess the spatial consistency between metrics in order to identify areas where they disagree; (iii) quantify the percentage of the Asian domain exposed to O3 levels exceeding the thresholds of protection for evergreen and deciduous forests in northern, continental and (sub)tropical cli-mates; and (iv) identify the most important climate constraints affecting the stomatal uptake of O3 by Asian forests. We hypothesized that AOT40, W126 and POD1 are uncoupled, and that deciduous forests are at higher risk than evergreen forests, as suggested by a meta-analysis of experimental results in Asia (Li
et al2017).
2. Methods
2.1. WRF-Chem model
We used the Weather Research and Forecasting model (WRF-Chem, v3.9), a coupled climate-chemistry model (Grell et al2005, Skamarock and Klemp2008), to reproduce the regional climate and surface O3
concentrations over South-Eastern Asia. The model domain (figure1) is projected on a lambert conformal map with a horizontal resolution of 8 km, which allows to simulate atmospheric chemical and phys-ical processes at fine spatial scale. The entire year 2015 was simulated, with a spin up of 1 month (1st–31st December 2014).
The initial and boundary conditions for met-eorology, updated every 3 h, were retrieved from the European Centre for Medium-range Weather Forecast ERA5 product (C3S-ERA5 2017), whose outputs are available with a horizontal resolution of ~31 km. Similarly, chemical boundary condi-tions were provided from MOZART-4 (Model for OZone And Related chemical Tracers) every 6 h (Emmons et al 2010) with a horizontal resolution of ~180× 240 km. We used the MOZART scheme to simulate atmospheric chemistry, the MEGAN (Model of Emissions of Gases and Aerosols from Nature) model to estimate biogenic emissions (Guen-ther et al 2012), while fire emissions were taken from the FINN (Fire INventory from NCAR, v1.5) inventory (Wiedinmyer et al2011). Monthly varying anthropogenic emissions were based on the EDGAR-HTAP (Emission Database for Global Atmospheric
Research for Hemispheric Transport of Air Pollu-tion, v2.2) inventory (Janssens-Maenhout et al2015) which is available on a grid of ~10 × 10 km for the year 2010. Ozone concentrations obtained by the model were considered as top of the forest can-opy, because the first layer of WRF/Chem is around 30 m height. The model validation is not showed in this manuscript, but is fully reported by Sicard et al (2020).
2.2. Definition of the forest types
The dominant forest distribution (figure 1) was obtained by merging the USGS landcover distribu-tion and the Koppen climate, following the meth-odology proposed by Anav et al (2016). This allows using the vegetation definition and the paramet-erizations described in chapter 3 of the Mapping Manual (CLRTAP2017) and computing the POD1 and its CL derivation. The six categories of forests identified are boreal deciduous (BD), boreal ever-green (BE), continental deciduous (CD), contin-ental evergreen (CE), (sub)tropical deciduous (TD), and (sub)tropical evergreen (TE) species. For boreal and continental types, we used the parameteriza-tion developed by CLRTAP (2017) for beech/birch (deciduous) and Norway spruce (evergreen). Due to the lack of specific tropical and sub-tropical forest parameterization in CLRTAP (2017) and in the sci-entific literature, we decided to join tropical and sub-tropical forest species in a single category and approx-imate the (sub)tropical species to Mediterranean spe-cies. Indeed, the Koppen classification includes both sub-tropical and Mediterranean climates into the same category C of temperate climates (Kottek et al 2006). For the (sub)tropical type, we thus selected the parameterization suggested for Mediterranean condi-tions (CLRTAP2017) for deciduous oaks (TD) and evergreen oak (TE).
2.3. Estimation of AOT40, W126 and POD1 metrics AOT40 (expressed in ppm h) was computed accord-ing to the followaccord-ing formulation (CLRTAP2017), i.e. as the sum of the hourly exceedances above 40 ppb over the time window between start date of the grow-ing season (SGS) and end date of the growgrow-ing season (EGS) according to figure2, during daylight hours:
AOT40 = EGS
∫
SGS
max ([O3]− 40,0)dt (1)
where [O3] is the hourly O3 concentration (ppb)
and dt is the time step (1 h). The function ‘max-imum’ ensures that only values exceeding 40 ppb are included.
The W126 exposure index (expressed as ppm h) is a non-threshold index that is described as the sigmoidal weighting sum of hourly O3
concen-trations recorded during specified daily and sea-sonal time windows, where each hourly O3value is
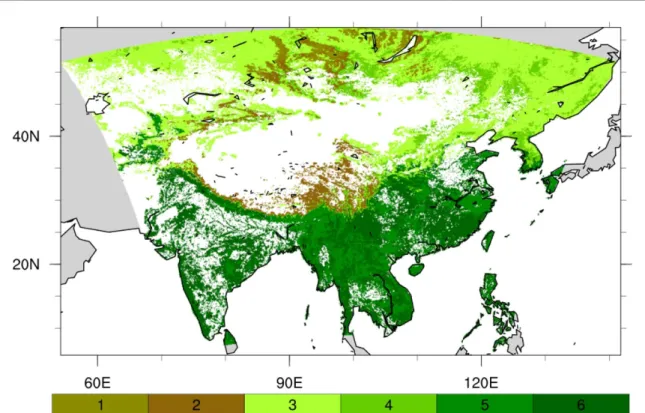
Figure 1. Classification of forest types of Asia, according to the parameterization in CLRTAP (2017). 1 = Boreal Deciduous (BD); 2 = Boreal Evergreen (BE); 3 = Continental Deciduous (CD); 4 = Continental Evergreen (CE); 5 = (Sub)tropical Deciduous (TD); 6 = (Sub)tropical Evergreen (TE). Details on the parameterization are in the text. White color represents grid points without forest cover, and grey color is used outside the domain.
Figure 2. Day of the year (DOY) for start of the growing season and end of the growing season over Asian forests. White color represents grid points without forest cover, and grey color is used outside the domain.
given a weight that increases from zero to one with increasing value (Lefohn et al2018) and is defined as follows: W126 = Σ Wi× Ci (2) Wi= 1 [ 1 + M× exp(−A × Ci 1000 )] (3)
where M = 4403, A = 126, and Ciis the hourly aver-age O3mixing ratio in ppb. Further details about the
index are available in Lefohn et al (2018). For consist-ency W126 and ATO40 were cumulated during the same daylight hours and growing season.
For the PODY, we applied a threshold Y of 1 nmol m−2 s−1 for consistency with the approach recommended by CLRTAP (2017) for forest protec-tion; the POD1 was computed as follows (Simpson
et al 2007, Tuovinen et al 2007, Büker et al 2015, CLRTAP2017): POD1 = EGS ∫ SGS max ( Rc Rb+Rc× gsto× [O3 ]− 1, 0 ) dt (4)
where dt is 1 h, [O3] is the hourly O3concentrations
(ppb), Rbis the quasi-laminar resistance (s m−1), Rc is the leaf surface resistance (s m−1), and gsto is the hourly value of stomatal conductance to O3 (mmol
O3 m−2 PLA s−1, where PLA is the Projected Leaf
Area) computed as following.
gsto=gmax∗ fphen∗ flight∗ max(fmin,ftemp∗ fVPD∗ fSWC) (5) where gstois the actual stomatal conductance and gmax is the maximum stomatal conductance of a plant spe-cies (mmol O3m−2PLA s−1) expressed on a
projec-ted total leaf surface area. The functions flight, ftemp,
fVPD, and are the variation in the maximum species-specific stomatal conductance gmax with photosyn-thetically flux density at the leaf surface (PPFD µmol photons m−2 s−1), surface air temperature (T,◦C), vapor pressure deficit (VPD, kPa), and volumetric soil water content (SWC, m3m−3), respectively. The function fminis the minimum stomatal conductance.
These species-specific functions vary between 0 and 1, with 1 meaning no limitation to gsto, and are expressed as CLRTAP (2017): flight=1− e(−lighta×PPFD) (6) ftemp= ( T− Tmin Topt− Tmin ) ∗ ( Tmax− T Tmax− Topt )(Tmax−Topt Topt−Tmin ) (7) fVPD
=min{1,max[fmin,
× ( (1− fmin)∗ (VPDmin− VPD) VPDmin− VPDmax ) +fmin ]} (8) fSWC=min [ 1, max ( fmin, SWC− WP FC− WP )] (9) where lighta is a dimensionless constant, PPFD is hourly photosynthetic photon flux density, Topt,
Tmin, and Tmax represent the optimum, minimum,
and maximum temperature for gsto, VPDmin and
VPDmax are minimum and maximum VPD for gsto, and WP and FC are the soil water content at wilting point and field capacity, respectively (Anav et al2016, CLRTAP2017).
In addition, fminis the species-specific fraction of
gmaxand fphen, i.e. the phenology of vegetation, is used to compute the duration of the growing season dur-ing which plants can uptake O3. In detail, we used
the seasonal variation of third generation Leaf Area Index, i.e. bi-weekly LAI3g data with ~8 km of spatial resolution (Zhu et al2013) to define the start of the growing season (SGS) and end of the growing season (EGS) (figure2), as described by Anav et al (2018).
2.4. Calculation of CL exceedances and biomass losses
CLs are defined as ‘concentrations, cumulative
expos-ure or cumulative stomatal flux of atmospheric pol-lutants above which direct adverse effects on sensit-ive vegetation may occur according to present know-ledge’ (CLRTAP2017). The parameter usually eval-uated for estimating such adverse effect on forests is a 4% reduction in biomass except for evergreen species where the biomass reduction is set to 2% (CLRTAP2017). Exceedances of O3 CL were
calcu-lated for the three metrics AOT40, W126 and POD1 as recommended by CLRTAP (2017), i.e. as differ-ence between the estimated value in each grid cell and the CL obtained by literature data. We used differ-ent CLs depending on the metric, i.e.: for AOT40 we applied the European CL set to 5 ppm h to protect all forests types (CLRTAP 2015); for W126, we used 7 ppm h or 21 ppm h, as recommended by Environ-mental Protection Agency (EPA2007) to protect the most sensitive tree species or any kind of vegetation; for POD1, we used 5.2 mmol m−2 for BD and CD, 9.2 mmol m−2 for BE and CE, 14.0 mmol m−2 for TD and 47.3 mmol m−2for TE, according to CLRTAP (2017).
After performing a point-wise calculation of the exceedances over the model domain, the non-attainment area of the target value (in %) was calculated relative to the total domain covered by either deciduous or evergreen forests. The biomass losses for each forest type were estimated based on the dose-response functions derived by CLRTAP (2017), as indicated in table S1 (available online at
https://stacks.iop.org/ERL/15/104095/mmedia).
3. Results
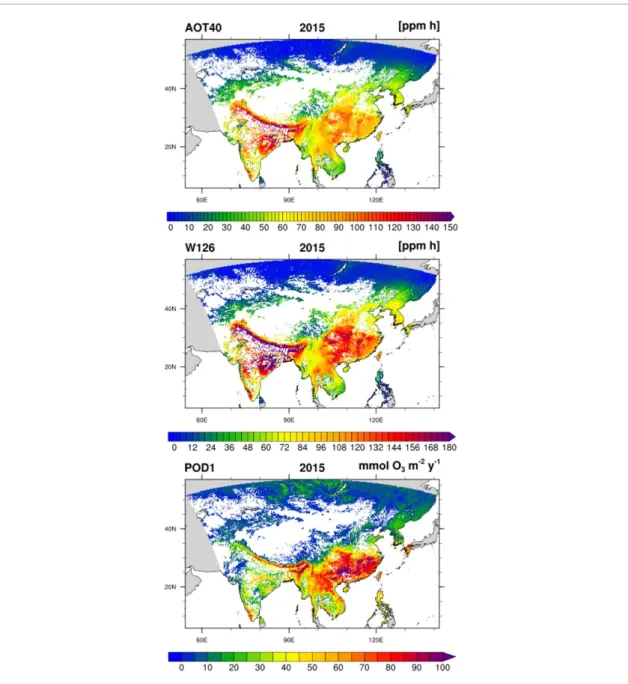
The lowest AOT40 levels were found in South Asia (i.e. Vietnam, Laos and Thailand) dominated by moist and dry broadleaf forest types (figure1) and with lower O3 concentrations (figure 3). The area
with highest AOT40 values was observed in cent-ral China, characterized by high O3concentrations,
especially during growing season (Sicard et al2020) and in the Indo-Gangetic Plain region, character-ized mainly by high-elevation forests e.g. Himalaya (figure1). The spatial distribution of W126 was sim-ilar to AOT40, but the highest and lowest values were amplified due to the nature of the metric. Peaks of W126 were located mainly in Northern and North-eastern India (figure3).
In contrast, the spatial pattern of POD1 was dif-ferent from that of AOT40 and W126 (figure3), with the highest absorbed dose for TD and TE forests and the lowest for BE forests (figure4). A different spatial distribution of hot-spots was observed in the south-ern region, with the highest POD1 values in southsouth-ern China rather than in India (figure3). The average spa-tial correlation coefficient was 0.96 between AOT40
Figure 3. Ozone risk assessment for Asian forests estimated by three metrics (AOT40, W126 and POD1) in 2015. White color represents grid points without forest cover and grey color is used outside the domain.
and W126 and 0.20 between AOT40 and POD1 (data not shown).
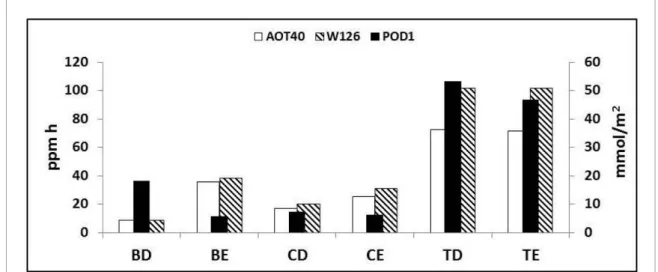
The selected metrics split in terms of dominant vegetation are displayed in figure4; our results indic-ate that, in 2015 the lowest AOT40 and W126 val-ues were found in the northern region (figure 3) dominated by boreal or continental forest species (figure1), while the highest AOT40 and W126 val-ues were observed in the areas where tropical and sub-tropical forests grow (figure4).
Considering the CLs, our results indicate that the AOT40 CL was exceeded over 53%, 93%, 74%, 86%, 98% and 97% of the areas covered by BD, BE, CD, CE, TD and TE forest types, respectively (figure5). The W126 CL recommended for protecting sensit-ive plant species was exceeded over 31%, 87%, 57%, 73%, 98% and 98% of the areas covered by BD, BE, CD, CE, TD and TE forest types, respectively, while
the exceedances of the W126 CL for the protection of all species covered 5%, 59%, 28%, 43%, 93% and 94% of the areas covered by BD, BE, CD, CE, TD and TE forest types, respectively. For both AOT40 and W126, the main attainment areas (i.e. achieving the air-quality standard) were in boreal and continental climates, with deciduous species showing lower risk than evergreen species. Regarding the POD1, 99%, 12%, 65%, 18%, 93% and 46% of the areas covered by BD, BE, CD, CE, TD and TE forest types exceeded the respective CLs (figure 5). The POD1-based O3
risk was higher for deciduous forests than evergreen forests, despite the shorter duration of the growing season.
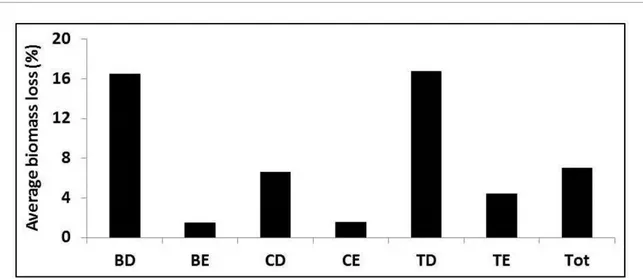
To link the POD1 to the forests biomass loss, we applied the dose-response function to the differ-ent forests type. The average POD1-driven biomass loss for the six forest types is shown in figure6. The
Figure 4. Average value of AOT40 (white bars), W126 (line bars) and POD1 (black bars) in the six forest types: B, Boreal; C, Continental; T, (sub)tropical; D, deciduous; E, evergreen.
Figure 5. Non-attainment area (in %) for Asian forests exposed to ozone levels exceeding the critical levels for each metric in 2015. Forest types: B, Boreal; C, Continental; T, (sub)tropical; D, deciduous; E, evergreen.
most POD1-affected forest types were the decidu-ous species, in particular BD and TD, with a respect-ive biomass loss of 16% and 17%. The CD showed a biomass reduction of 7%, while evergreen species showed lower biomass reductions, even if the accu-mulation period was longer. Indeed, a biomass loss of 1.5%, 1.6% and 4.4% was estimated for BE, CE and TE species, respectively. When all forests were aver-aged, the POD1-estimated biomass loss was 7%.
The spatial distribution of the limiting functions
f, i.e. the functions regulating the stomatal opening
and consequently the O3 uptake by leaves, is shown in figure7.
Considering the temperature, we found a relev-ant limitation to stomatal opening only in the moun-tainous region around the Tibetan plateau, while in the remaining area of the domain the air temperature is not significantly limiting O3 uptake. In contrast, the maximum flight limitation was observed in the south-eastern area of the domain, and this function was relatively low (i.e. high limitation) over the whole
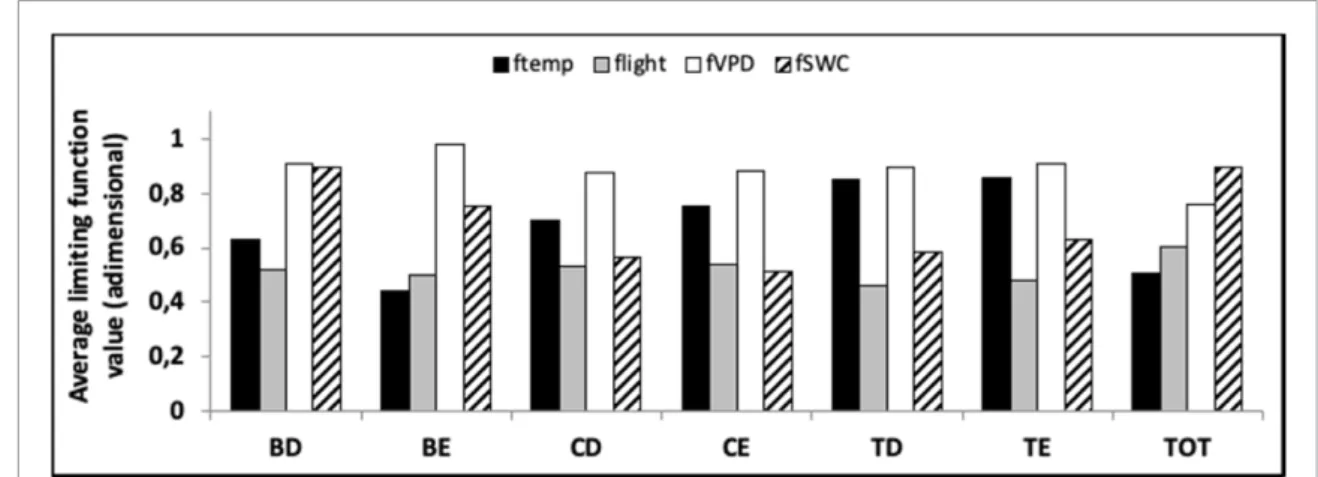
domain. fVPDwas generally not limiting for stomatal conductance in Asia, except in the central-western part of the domain, while fSWC was strongly limit-ing for stomatal conductance over almost all India and the central part of the domain. The average val-ues of the 4 limitation functions in the six forest types is shown in figure8. As expected ftempis mostly limiting for stomatal conductance in boreal forests (0.62 and 0.44 for BD and BE, respectively), and flight is mostly limiting stomatal conductance in tropical forests (0.46 and 0.48 for TD and TE, respectively), while intermediate values were found in the contin-ental forests for both CD and CE, where fSWC limita-tion seems to be more relevant (0.56 and 0.51 for CD and CE, respectively)
By selecting the most limiting function in each cell grid, we observed that the most distributed limiting function over Asia was flight(over 65% of the domain), followed by fSWC(29%) and ftemp(6%) (figure9). Just in few grid points (<1%) the most limiting function was fVPD.
Figure 6. Average biomass loss due to cumulative stomatal ozone uptake (POD1) for the six forest types over the Asian domain, expressed as an average on all forests (Tot) or per forest type. Forest types: B, Boreal; C, Continental; T, (sub)tropical; D, deciduous; E, evergreen.
Figure 7. Average limitation of stomatal conductance due to temperature (ftemp), solar radiation (flight), vapor pressure deficit
(fVPD) and soil water content (fSWC) over Asian forests in the year 2015. The values are dimensionless, ranging from 0 (maximum
limitation) to 1 (no limitation). Withe color represents grid points without forest cover, and grey color is used outside the domain.
4. Discussion
East and South Asia has recently experienced rapid economic growth, during which anthropogenic emis-sions have increased and deteriorated air quality (Kurokawa and Ohara 2019). Air pollution, espe-cially surface O3in East and Southeast Asia, is more
serious than in Europe and North America (Koike
et al2013, Mills et al 2018) and is still expected to increase by 2100 (Sicard et al2017). Thus, the use of
air quality models has also increased in this region to better understand the spatial and temporal distribu-tions of air pollutants and to examine the impact of the increased anthropogenic emissions on air quality degradation for Asian countries (Park and Kim2014) and consequently the impacts on forests (Feng et al
2019).
In this study, we used WRF-Chem with a high horizontal resolution (8 km) over a domain cov-ering all India, China, part of southern Asia, and
Figure 8. Average limitation function values for the six forest types over the Asian domain, expressed as an average on all forests (TOT) or per forest type. Forest types: B, Boreal; C, Continental; T, (sub)tropical; D, deciduous; E, evergreen. Black bars indicated ftemp, grey bars flight, white bars fVPDand striped bars indicated fSWC.
Figure 9. Distribution of the most limiting function per each grid cell (temperature in red, light in green, vapor pressure deficit (VPD) in yellow and soil water content (SWC) in blue) over the Asian forests in 2015. White color represents grid points without forest cover, and grey color is used outside the domain.
reaching southern Siberia. The same model was pre-viously used to simulate ground-level O3 over a
smaller domain in East Asia (Park et al 2014), and emphasized the importance of the resolution in the performance of the model. For this reason, we selec-ted a fine spatial resolution to have more realistic results. Our simulation was validated against
in-situ measurements from monitoring stations across
China and satellite data (Sicard et al2020); the com-parison with measurements suggests that the model well reproduces the spatial pattern of meteorological
variables and surface O3 concentration. Indeed, the
WRF-Chem model simulated well the spatial dis-tribution and seasonal variation of O3. Compared
to IASI-GOME2 satellite retrievals, a good tial agreement is noticed in summer, with a spa-tial correlation of 0.99, and a lower correlation is observed during spring and winter (0.61 and 0.71, respectively). Compared to ground observations data (from 1500 air quality monitoring network across China), a mean annual bias of 5 ppb is observed in 2015. This bias is in line with the ones showed by
the European regional models described in Colette
et al (2011). Looking at the surface air temperature, one of the most important parameter affecting POD1 entity, WRF captures well the spatial pattern with a decreasing south-north gradient and a cold area over the Tibetan plateau (Sicard et al2020).
Interestingly, the POD1 values were consistent with the results shown for Europe (Anav et al2016), while AOT40 values were around 100%–200% higher in Asia than in Europe. The latter result is consistent with Lu et al (2018), that found significantly higher AOT40 and W126 levels in China, i.e. 35%–100% and 50%–170% higher than in Europe and United States, respectively.
Asian studies implementing PODY are fewer for trees than for crop species (Agathokleous et al2018), and have normally provided experimental observa-tions in very local plots and for a few species. POD1 is the index recommended by CLRTAP (2017) for pro-tecting trees against O3-induced biomass loss. In an
experiment with poplars in China, AOT40 and POD1 dose-response relationships indicated a 5% biomass loss at 12.0 ppm h and 6.1 mmol m−2, respectively (Hu et al2015). To calculate the exceedance, we used the thresholds, dose-responses and CLs set in Europe (CLRTAP2017) because the only PODY-based dose-response relationships for Asia are for hybrid pop-lar and thus insufficient to represent the variety of forest types in Asia. Our results showed different sens-itivity of forest types to O3concentrations potential
exposure (AOT40 and W126) or O3fluxes (POD1),
in particular with respect to the non-attainment area for forest protection. Most of evergreen forests (86%– 97%) were potentially exposed to O3concentrations
exceeding the limits for forest protection while the percentage of evergreen forests exposed to POD1 above the CLs was lower (12%–46%). Asian studies should focus on flux-based O3metrics to provide
rel-evant bases for developing proper standards. How-ever, given the technical requirements in calculat-ing flux-based O3metrics, which can be an
import-ant limitation in developing countries, cumulative exposure indices like AOT40 should always accom-pany flux-based indices (Agathokleous et al2018).
A different spatial distribution of AOT40 and POD1 in East Asia was previously described by Hoshika et al (2011) and by De Marco et al (2015) and Anav et al (2016) in Europe. In particular in Asia POD0 values ranging from 10 to 48 mmol m−2were reported (Hoshika et al 2011), while in our results we obtained values of similar magnitude, but with an hourly threshold Y of 1 nmol m−2s−1. Our spa-tial variability was in line with the spaspa-tial distribu-tion obtained by Hoshika et al (2011). We obtained similar results with no limitation due to VPD on the major part of the domain, excluding the cent-ral north-western part of India. One possible explan-ation is that the Tibetan Plateau (mean elevexplan-ation over 4000 m a.s.l.) acting as a strong heat source
in summer, generates upward airflow motions over its eastern flank that, combined with large amounts of moisture from the tropics, result in strong mon-soons and wet climate in East Asia (Ding and Chan
2005).
The limiting functions are important to determ-ine the role of climatic conditions on stomatal conductance (Emberson et al 2007). Physiological responses to changes in climate are highly depend-ent on the limiting factors of a particular site to forest growth. The eastern part of the domain did not show SWC as most limiting factor, while the west-ern part of the domain, including India, with either limited rainfall or high temperature showed some areas characterized by limiting soil moisture, a very important function in many dry area of the globe (De Marco et al2016). We showed that the most limit-ing function to O3 uptake in eastern Asia was flight, in agreement with Nemani et al (2003) that invest-igated geographic distribution of potential climatic constraints to plant growth derived from long-term climate statistics. As the exchange of gases between atmosphere and terrestrial vegetation is regulated by stomata opening, air pollutants may take advantage of the stomatal aperture to enter leaves, suggesting that the temporal evolution of O3 and CO2 uptake
are consistent. Indeed Melillo et al (1993) found that the predicted NPP decreases for tropical evergreen forest, may be related to increased temperature and cloudiness. It is important to note that flight estima-tion included nighttime hours, and thus is affected by the duration of daylight hours. Similar analysis was done in Europe (Emberson et al2007, Anav et al 2019) to identify the key drivers determining O3flux
by tree species and region. In Europe a key driver for PODY variation was the length of the growing season (fphen), which increased and counteracted the negative trend in O3concentrations leading to a limited PODY
increase during the time period 2000–2014 (Anav
et al2019). Epidemiological studies where PODY is compared with observed impact on vegetation would help in selecting the best metric to estimate the O3risk
for forests in Asia (Sicard et al2016, Braun et al2017). Some evidences showed the higher performance of O3
flux instead of exposure to estimate the impacts of O3
on forest trees in Europe (De Marco et al2015, Sicard
et al2016, Paoletti et al2019).
5. Conclusions
The lack of information still presents in Asia in terms of stomatal O3uptake by the forests, both for
modelling and in-situ measurements, warrant more intense studies in this region of the globe. To bridge this gap of knowledge we performed, for the first time, a risk assessment on Asian forests using a high spa-tial resolution model in order to estimate the phyto-toxic O3 uptake (POD1) into the tree leaves for six
forest types, highlighting its spatial distribution com-pare to concentration-based metrics. We found very high potential of O3 impacts on deciduous forest
growth in Asia, while potential O3impacts on
ever-green forest types were lower. In particular, the limit-ing conditions of light, soil water content and temper-ature in a context of climate change, make this region of the globe at high O3risk for deciduous species and
medium O3risk for evergreen species.
Acknowledgments
This work was carried out with the contribution of: LIFE financial instrument of the European Union (LIFE15 ENV/IT/000183) in the framework of the MOTTLES project ‘Monitoring ozone injury for setting
new critical levels’; National Key Research and
Devel-opment Program of China, Grant/Award Number: 2017YFC0210106; National Natural Science Found-ation of China (No. 41771034); Chinese Academy of Sciences President’s International Fellowship Ini-tiative (PIFI) for Senior Scientists (2016VBA057); and CNR-CAS bilateral agreement 2017–2019 ‘Ozone
impacts on plant ecosystems in China and Italy’.
Data availability statement
The data that support the findings of this study are available upon reasonable request from the authors.
ORCID iD
Alessandro Anav https://orcid.org/0000-0002-4217-7563
References
Agathokleous E, Kitao M and Kinose Y 2018 A review study on O3
phytotoxicity metrics for setting critical levels in Asia Asian J. Atmos. Environ.12 1–16
Anav A et al 2019 Growing season extension affects ozone uptake by European forests Sci. Total Environ.669 1043–52 Anav A et al 2016 Comparing concentration-based (AOT40) and
stomatal uptake (PODY) metrics for ozone risk assessment to European forests Glob. Change Biol.22 1608–27 Anav A, Liu Q, De Marco A, Proietti C, Savi F, Paoletti E and Piao
S 2018 The role of plant phenology in stomatal ozone flux modelling Glob. Change Biol.24 235–48
Braun S, Achermann B, De Marco A, Pleijel H, Karlsson P E, Rihm B, Schindler C and Paoletti E 2017 Epidemiological analysis of ozone and nitrogen impacts on
vegetation–critical evaluation and recommendations Sci. Total Environ.603 785–92
Büker P et al 2015 New flux based dose–response relationships for ozone for European forest tree species Environ. Pollut.206
163–74
C3S-ERA5 2017 Fifth generation of ECMWF atmospheric reanalyses of the global climate Copernicus Climate Change Service Climate Data Store (CDS) (available at:
https://cds.climate.copernicus.eu/cdsapp#!/home) Calori G, Clemente M, De Maria R, Finardi S, Lollobrigida F and
Tinarelli G 2006 Air quality integrated modeling in Turin urban area Environ. Model. Softw.21 468–76
Chatani S et al 2014 Photochemical roles of rapid economic growth and potential abatement strategies on tropospheric ozone over south and east Asia in 2030 Atmos. Chem. Phys. 14 9259–77
CLRTAP 2017 Mapping critical levels for vegetation, chapter III of manual on methodologies and criteria for modelling and mapping critical loads and levels and air pollution effects, risks and trends UNECE Convention on Long-range Transboundary Air Pollution (available at:
http://icpvegetation.ceh.ac.uk/)
Cohen A J et al 2017 Estimates and 25–year trends of the global burden of disease attributable to ambient air pollution: an analysis of data from the global burden of diseases study 2015 Lancet389 1907–18
Colette A et al 2011 Air quality trends in Europe over the past decade: a first multi-model assessment Atmos. Chem. Phys. 11 11657–78
Cooper O R, Gao R S, Tarasick D, Leblanc T and Sweeney C 2012 Long-term ozone trends at rural ozone monitoring sites across the United States, 1990–2010 J. Geophys. Res.: Atmos. 117 D22307
De Marco A, Sicard P, Fares S, Tuovinen J P, Anav A and Paoletti E 2016 Assessing the role of soil water limitation in
determining the phytotoxic ozone dose (PODY) thresholds Atmos. Environ.147 88–97
De Marco A, Sicard P, Vitale M, Carriero G, Renou C and Paoletti E 2015 Metrics of ozone risk assessment for Southern European forests: canopy moisture content as a potential plant response indicator Atmos. Environ.120
182–90
Ding Y and Chan J 2005 The East Asian summer monsoon: an overview Meteorol. Atmos. Phys.89 117–42
Duncan B N, Lamsal L N, Thompson A M, Yoshida Y, Lu Z, Streets D G and Pickering K E 2016 A space-based, high-resolution view of notable changes in urban NOx pollution around the world (2005–2014) J. Geophys. Res.: Atmos. 121 976–96 Emberson L D, Buker P and Ashmore M R 2007 Assessing the risk
caused by ground level ozone to European forest trees: a case study in pine, beech and oak across different climate regions Environ. Pollut.147 454–66
Emmons L K et al 2010 Description and evaluation of the model for ozone and related chemical tracers, version 4 (MOZART-4) Geosci. Model Dev.3 43–67
Engardt M 2008 Modelling of near-surface ozone over South Asia J. Atmos. Chem.59 61–80
EPA 2007 Review of the national ambient air quality standards for ozone: policy assessment of scientific and technical information OAQPS Staff Paper U.S. Environmental Protection Agency, Office of Air Quality Planning and Standards, Research Triangle Park, North Carolina Publication No. EPA-452/R-07-003 p 603
Fang J Y, Chen A P, Peng C H, Zhao S Q and Ci L J 2001 Changes in forest biomass carbon storage in China between 1949 and 1998Science292 2320–2
Feng Z, De Marco A, Anav A, Gualtieri M, Sicard P, Tian H, Fornasier F, Tao F, Guo A and Paoletti E 2019 Economic losses due to ozone impacts on human health, forest productivity and crop yield across China Environ. Int. 131 9
Feng Z, Paoletti E, Bytnerowicz A and Harmens H 2015 Editorial Ozone and plants Environ. Pollut.202 215–6
Fu Y and Tai A P K 2015 Impact of climate and land cover changes on tropospheric ozone air quality and public health in East Asia between 1980 and 2010 Atmos. Chem. Phys.15
10093–106
Gaudel A et al 2018 Tropospheric ozone assessment report: present-day distribution and trends of tropospheric ozone relevant to climate and global atmospheric chemistry model evaluation Elementa 6 59
Grell G A, Peckham S E, Schmitz R, Mckeen S A, Frost G, Skamarock W C and Eder B 2005 Fully coupled ‘online’ chemistry within the WRF model Atmos. Environ.39
Guenther A B, Jiang X, Heald C L, Sakulyanontvittaya T, Duhl T, Emmons L K and Wang X 2012 The model of emissions of gases and aerosols from nature version 2.1 (MEGAN2.1): an extended and updated framework for modeling biogenic emissions Geosci. Model Dev.5 1471–92
Haase D et al 2014 A quantitative review of urban ecosystem service assessments: concepts, models, and implementation Ambio43 413–33
Han Z 2007 A regional air quality model: evaluation and simulation of O3 and relevant gaseous species in East Asia during spring 2001 Environ. Model. Softw.22
1328–36
Hoesly R M et al 2018 Historical (1750–2014) anthropogenic emissions of reactive gases and aerosols from the community emissions data system (CEDS) Geosci. Model Dev.11 369–408
Hoshika Y, Fares S, Savi F, Gruening C, Goded I, De Marco A, Sicard P and Paoletti E 2017 Stomatal conductance models for ozone risk assessment at canopy level in two
Mediterranean evergreen forests Agric. For. Meteorol.234–5
212–21
Hoshika Y, Shimizu Y and Omasa K 2011 A comparison between stomatal ozone uptake and AOT40 of deciduous trees in Japan iForest—Biogeosci. For.4 128–35
Hu E Z, Gao F, Xin Y, Jia H X, Li K H, Hu J J and Feng Z 2015 Concentration- and flux-based ozone dose-response relationships for five poplar clones grown in North China Environ. Pollut.207 21–30
Hu J, Chen J, Ying Q and Zhang H 2016 One-year simulation of ozone and particulate matter in China using WRF/CMAQ modeling system Atmos. Chem. Phys.16 10333–50 Janssens-Maenhout G et al 2015 HTAP_v2.2: a mosaic of regional
and global emission grid maps for 2008 and 2010 to study hemispheric transport of air pollution Atmos. Chem. Phys. 15 11411–32
Kier G, Kreft H, Lee T M, Jetz W, Ibisch P L, Nowicki C, Mutke J and Barthlott W 2009 A global assessment of endemism and species richness across island and mainland regions Proc. Natl Acad. Sci. USA106 9322–7
Koike T, Watanabe M, Hoshika Y, Kitao M, Matsumura H, Funada R and Izuta T 2013 Chapter 17—effects of ozone on forest ecosystems in East and Southeast Asia Dev. Environ. Sci. 13 371–90
Kottek M J, Grieser C, Beck R B and Rubel F 2006 World map of the Köppen-Geiger climate classification updated Meteorol. Z.15 259–63
Krotkov N A et al 2016 Aura OMI observations of regional SO2 and NO2 pollution changes from 2005 to 2015 Atmos. Chem. Phys. 16 4605–29
Kumar R, Naja M, Pfister G G, Barth M C, Wiedinmyer C and Brasseur G P 2012 Simulations over south Asia using the weather research and forecasting model with chemistry (WRF-Chem): chemistry evaluation and initial results Geosci. Model Dev.5 619–48
Kunhikrishnan T, Lawrence M G, von Kuhlmann R, Wenig M O, Asman W A H, Richter A and Burrows J P 2006 Regional NOx emission strength for the Indian subcontinent and the impact of emissions from India and neighboring countries on regional O3 chemistry J. Geophys. Res.: Atmos.111
D15301
Kurokawa J and Ohara T 2019 Long-term historical trends in air pollutant emissions in Asia: regional emission inventory in Asia (REAS) version 3.1 (available at:
www.atmos-chem-phys-discuss.net›acp–2019–1122) Lamarque J F et al 2013 The atmospheric chemistry and climate
model intercomparison project (ACCMIP): overview and description of models, simulations and climate diagnostics Geosci. Model Dev.6 179–206
Lefohn A S et al 2018 Tropospheric ozone assessment report: global ozone metrics for climate change, human health, and crop/ecosystem research Elementa 6 28
Lefohn A S, Shadwick D and Oltmans S J 2010 Characterizing changes in surface ozone levels in metropolitan and rural
areas in the United States for 1980–2008 and 1994–2008 Atmos. Environ.44 5199–210
Li J, Wang Z, Akimoto H, Gao C, Pochanart P and Wang X 2007 Modeling study of ozone seasonal cycle in lower troposphere over east Asia J. Geophys. Res.112 D22S25
Li K, Liao H, Mao Y H and Ridley D A 2016 Sectoral and regional contributions to black carbon and its direct radiative forcing in China Atmos. Environ.124 351–66
Li P, Feng Z, Catalayud V, Yuan X, Xu Y and Paoletti E 2017 A meta-analysis on growth, physiological, and biochemical responses of woody species to ground-level ozone highlights the role of plant functional types Plant Cell Environ.40
2369–80
Liao H and Shang J 2015 Regional warming by black carbon and tropospheric ozone: a review of progresses and research challenges in China J. Meteorol. Res.29 525–45
Lin M, Horowitz L, Payton R, Fiore A and Tonnesen G 2017 US surface ozone trends and extremes from 1980 to 2014: quantifying the roles of rising Asian emissions, domestic controls, wildfires, and climate Atmos. Chem. Phys. 17 2943–70
Liu Y and Wang T 2020 Worsening urban ozone pollution in China from 2013 to 2017—part 2: the effects of emission changes and implications for multi-pollutant control Atmos. Chem. Phys.20 6323–37
Lu X, Hong J, Zhang L, Cooper O R, Schultz M G, Xu X, Wang T, Gao M, Zhao Y and Zhang Y 2018 Severe surface ozone pollution in China: a global perspective Environ. Sci. Technol. Lett.5 487–94
Melillo J, Mcguire A, Kicklighter D, Moore B, Vorosmarty C J and Schloss A L 1993 Global climate change and terrestrial net primary production Nature363 234–40
Mills G et al 2018 Tropospheric ozone assessment report: present-day tropospheric ozone distribution and trends relevant to vegetation Elementa 6 47
Miranda A, Silveira C, Ferreira J, Monteiro A, Lopes D, Relvas H, Borrego C and Roebeling P 2015 Current air quality plans in Europe designed to support air quality management policies Atmos. Pollut. Res.6 434–43
Myers N, Mittermeier R A, Mittermeier C G, da Fonseca G A B and Kent J 2000 Biodiversity hotspots for conservation priorities Nature403 853–8
Nemani R R, Keeling C D, Hashimoto H, Jolly W M, Piper S C, Tucker C J and Myneni R B 2003 Running climate-driven increases in global terrestrial net primary production from 1982 to 1999 Science300 1560–3
Oksanen E, Pandey V, Pandey A K, Keski-Saari S, Kontunen-Soppel S and Sharma C 2013 Impacts of increasing ozone on Indian plants Environ. Pollut.177
189–200
Paoletti E et al 2019 Toward stomatal–flux based forest protection against ozone: the MOTTLES approach Sci. Total Environ. 691 516–27
Paoletti E, De Marco A, Beddows D C S, Harrison R M and Manning W J 2014 Ozone levels in European and USA cities are increasing more than at rural sites, while peak values are decreasing Environ. Pollut.192 295–9
Paoletti E and Manning W J 2007 Toward a biologically significant and usable standard for ozone that will also protect plants Environ. Pollut.150 85–95
Park R J, Hong S K, Kwon H A, Kim S, Guenther A, Woo J H and Loughner C P 2014 An evaluation of ozone dry deposition simulations in East Asia Atmos. Chem. Phys.14 7929–40 Park R J and Kim S-W 2014 Air quality modeling in East Asia: present issues and future directions Asia-Pac. J. Atmos. Sci. 50 105–20
Qiao X, Guo H, Wang P, Tang Y, Ying Q, Zhao X, Deng W and Zhang H 2019 Fine particulate matter and ozone pollution in the 18 cities of the Sichuan Basin in Southwestern China: model performance and characteristics Aerosol Air Qual. Res.19 2308–19
Reis S, Nitter S and Friedrich R 2005 Innovative approaches in integrated assessment modelling of European air pollution
control strategies—implications of dealing with multi-pollutant multi-effect problems Environ. Model. Softw.20 1524–31
Screpanti A and De Marco A 2009 Corrosion on cultural heritage buildings in Italy: a role for ozone? Environ. Pollut.157
1513–20
Shang B, Feng Z, Li P, Yuan X, Xu Y and Calatayud V 2017 Ozone exposure- and flux-based response relationships with photosynthesis, leaf morphology and biomass in two poplar clones Sci. Total Environ.603–4 185–95
Sharma S, Chatani S, Mahtta R, Goel A and Kumar A 2016 Sensitivity analysis of ground level ozone in India using WRF-CMAQ models Atmos. Environ.131 29–40 Sheel V, Lal S, Richter A and Burrows J P 2010 Comparison of
satellite observed tropospheric NO2 over India with model simulations Atmos. Environ.44 3314–21
Sicard P, Anav A, De Marco A and Paoletti E 2017 Projected global tropospheric ozone impacts on vegetation under different emission and climate scenarios Atmos. Chem. Phys.17
12177–96
Sicard P, Crippa P, De Marco A, Castruccio S, Giani P, Cuesta J, Paoletti E, Feng Z and Anav A 2020 High spatial resolution WRF-Chem model over Asia: physics and chemistry evaluation Atmos. Environ. accepted
Sicard P, De Marco A, Dalstein-Richier L, Tagliaferro F, Renou C and Paoletti E 2016 An epidemiological assessment of stomatal ozone flux-based critical levels for visible ozone injury in Southern European forests Sci. Total Environ.541
729–41
Sicard P, De Marco A, Troussier F, Renou C, Vas N and Paoletti E 2013 Decrease in surface ozone concentrations at
Mediterranean remote sites and increase in the cities Atmos. Environ.79 705–15
Simpson D, Ashmore M R, Emberson L and Tuovinen J P 2007 A comparison of two different approaches for mapping potential ozone damage to vegetation. A model study Environ. Pollut.146 715–25
Skamarock W C and Klemp J B 2008 A time-split nonhydrostatic atmospheric model for weather research and forecasting applications J. Comput. Phys.227 3465–85
Surendran D E, Ghude S D, Beig G, Emmons L K, Jena C, Kumar R, Pfister G G and Chate D M 2015 Air quality simulation over South Asia using hemispheric transport of air pollution version-2 (HTAP-v2) emission inventory and model for ozone and related chemical tracers (MOZART-4) Atmos. Environ.122 357–72
Tang H, Takigawa M, Liu G, Zhu J and Kobayashi K 2013 A projection of ozone-induced wheat production loss in China
and India for the years 2000 and 2020 with exposure-based and flux-based approaches Glob. Change Biol.19 2739–52 Tai A P K, Val Martin M and Heald C L 2014 Threat to future
global food security from climate change and ozone air pollution Nat. Clim. Change4 817–21
Tuovinen J-P, Simpson D, Emberson L, Ashmore M and Gerosa G 2007 Robustness of modelled ozone exposures and doses Environ. Pollut.146 578–86
US Federal Register 2015 National ambient air quality standards for ozone, 40 CFR part 50, 51, 52, 53, and 58 pp 65292–468 Wang Y, Konopka P, Liu Y, Chen H, Müller R, Plöger F, Riese M,
Cai Z and Lü D 2012 Tropospheric ozone trend over Beijing from 2002–2010: ozonesonde measurements and modeling analysis Atmos. Chem. Phys.12 8389–99
Wiedinmyer C, Akagi S K, Yokelson R J, Emmons L K, Al-Saadi J A, Orlando J J and Soja A J 2011 The fire inventory from NCAR (FINN): a high resolution global model to estimate the emissions from open burning Geosci. Model Dev. 4 625–41
World Health Organisation 2013 Review of evidence on health aspects of air pollution—REVIHAAP project Technical Report (Copenhagen, Denmark: World Health Organization, Regional Office for Europe)
Xu B, Guo Z, Piao S and Fang J 2010 Biomass carbon stocks in China’s forests between 2000 and 2050: a prediction based on forest biomass–age relationships Sci. China Life Sci.53
776–83
Yan Y, Pozzer A, Ojha N, Lin J and Lelieveld J 2019 Trend reversal from high-to-low and from rural-to-urban ozone concentrations over Europe Atmos. Environ.213 25–36 Yu G, Chen Z, Piao S, Peng C, Ciais P, Wang Q, Li X and Zhu X
2014 High carbon dioxide uptake by subtropical forest ecosystems in the East Asian monsoon region Proc. Natl Acad. Sci.111 4910–5
Zeng Y, Cao Y, Qiao X, Seyler B C and Tang Y 2019 Air pollution reduction in China: recent success but great challenge for the future Sci. Total Environ.663 329–37
Zhang K, Song C, Zhang Y and Zhang Q 2017 Natural disasters and economic development drive forest dynamics and transition in China For. Policy Econ.76 56–64
Zhu Z, Bi J, Pan Y, Ganguly S, Anav A, Xu L, Samanta A, Piao S, Nemani R R and Myneni R B 2013 Global data sets of vegetation leaf area index (LAI)3g and fraction of photosynthetically active radiation (FPAR)3g derived from global inventory modeling and mapping studies (GIMMS) normalized difference vegetation index (NDVI3g) for the period 1981 to 2011 Remote Sens. 5 927–48