AUTHOR
PROOF
COPY
Not f
or
publica
tion
Neuropsychiatric Disease and Treatment
Dove
press
S h o rT r e p o rT open access to scientific and medical research open Access Full Text Article
Year: 2014 Volume: 10
Running head verso: Balsamo and Saggino
Running head recto: Teate Depression Inventory diagnostics DOI: 55706
Michela Balsamo Aristide Saggino
Department of psychological Sciences, humanities and Territory, G. d’Annunzio University of Chieti-pescara, Chieti, Italy
Correspondence: Michela Balsamo Department of psychological Sciences, humanities, and Territory, G. d’Annunzio University of Chieti-pescara, Via dei Vestini 30, 66100, Chieti, Italy Tel/fax +39 0871 355 5309 email [email protected]
Determining a diagnostic cut-off
on the Teate Depression Inventory
Abstract: A small but growing body of literature suggests that the Teate Depression Inventory
(TDI) may be an “objective” measure of depression compared with other commonly used scales. Furthermore, the TDI has strong psychometric properties in both clinical and non-clinical samples. The present study aimed to extend the use of TDI by identifying cut-off scores that could differentiate varying levels of depression severity in a group of clinically diagnosed depression disorder patients (N=125). Three receiver operating characteristic curve analyses indicated cut-off scores of 21 (sensitivity =0.86, specificity =0.94, and classification accuracy =0.90); 36 (sensitivity =0.84, specificity =0.96, and classification accuracy =0.92); and 50 (sensitivity =0.81, specificity =0.93, and classification accuracy =0.90), for minimal, mild, moderate, and severe depression, respectively. Resultssuggest that the TDI measures depres-sion severity across a broad range with high test accuracy and may be appropriately used to screen for depression.
Keywords: major depression, ROC curve, self-report scales, Rasch analysis, depression
screening
Introduction
Depression is a prevalent mental health issue around the world and it is responsible for a wide range of problems in many aspects of a person’s functioning. Therefore, it is critical to screen depressive symptoms in both clinical and nonclinical populations. While depression is commonly measured on a dimensional basis, many research and
clinical decisions are based on categorical classifications1 (eg, whom to include in which
group; and whom to treat and with what intervention). Widiger and Samuel state that “clinical decisions are categorical”.2 Because of the general necessity of categorical
deci-sions, the identification of cut-off scores differentiating probable cases from probable non-cases is often advantageous. However, different opinions about dimensional and categorical assessments have kindled a long-lasting scientific debate, with some authors arguing that dimensional assessment more precisely reflects the nature of
mental disorders.2,3 Other authors suggest that it is not so much a matter of an “either-
or” approach, but more a question of when it is appropriate to rely on categorical
versus (vs) dimensional assessments.4,5 While there is no single test that can define
mental disorders (a situation also known as the “cut-off point dilemma”),6 there is no
doubt about the pragmatic clinical utility of cut-off scores on scales that measure mental
disorders.5–8 Researchers are frequently required to decide who to include in patient and
control samples in empirical studies, similar to clinicians who must formulate decisions
about whom to treat and which treatment to provide.6 The either-or debate precludes
the consideration of utilizing both categorical and dimensional assessments, resulting
in the primary decision being which type of assessment to use first.5,6,8,9 Furthermore,
Number of times this article has been viewed
This article was published in the following Dove Press journal: Neuropsychiatric Disease and Treatment
cut-off scores are not optimal for instrumentsconstructed
applying Rasch measurement models,10 because they were
developed using traditional scoring methods. In both clini-cal and research settings, cut-off scores that identify cases of clinical depression and depression severity levels can be of great utility in the quick identification of patients with a high likelihood of a Diagnostic and Statistical Manual
of Mental Disorders 4th Edition Text Revision
(DSM-IV-TR)11condition. However, it would be difficult to convince
users to switch to an assessment scalethat does not appear
to be as clinically informative. Still, clinicians who attempt to identify syndromal depression in primary care continue to have considerable difficulty, with only one in three people correctly diagnosed,12 and clinicians’ ability to recognize
mild depression is significantly lower than their ability to
recognize moderate–severe depression.13
Although understanding of depression has increased dramatically in recent years with the development of cognitive
theories of emotional disorders,14–16 the most commonly used
assessment scales are approximately 25 years old. Developed according to the classical test theory, several established measures have shown some psychometric limitations, many
of which are due to theoretical assumptions.17,18 To address
most of their flaws, a new Rasch-based self-report
instru-ment for depression, the Teate Depression Inventory (TDI),19
was recently developed. Its development process has been
illustrated previously.18 Emerging evidence suggests that the
TDI is a more accurate measure of depression than other com-monly used tools. Recently, the TDI was administered to large clinical and nonclinical samples in three studies (Balsamo et al, unpublished data, 2014).20,21 In the first study, internal
consis-tency was found to be high (Cronbach’s alpha =0.92) in a
sam-ple of 857 young adults. In addition, significant correlations
with the subfactor of high standards/self-criticism (r =0.26,
P0.01) in the Attitudes toward Self-Revised, and only
moder-ate correlation with the Beck Depression Inventory II (BDI-II)
(r =0.65, P0.01), probably due to the lack of
unidimen-sionality for the latter,22–27 were found.20 In the second
study, Cronbach’s alphas were 0.94 and 0.92 (P0.01) for the clinical (1,124 psychiatric outpatients) and nonclinical (877 healthy subjects) samples, respectively.21 Correlation
with the BDI-II was 0.73 (P0.01) in both samples.
Correla-tion with the Beck Anxiety Inventory28 was 0.46 (P0.01) in
a clinical subsample of 102 outpatients, and 0.54 (P0.01) in
a nonclinical subsample composed of 151 subjects.21
In the third study, the TDI was administered to a sample of 396 middle-aged (50–64 years of age) and older (65 years of age) adults, recruited from the general
population (Balsamo et al, unpublished data, 2014). Cronbach’s alpha was found to be 0.88. Significant
correla-tion (r =0.56, P0.01) with the Geriatric Depression Scale
(GDS),29 a questionnaire designed to measure depression in
a geriatric population, was found (Balsamo et al, unpublished
data, 2014).Correlations between the TDI and the anxiety
trait, as measured by the Trait Scale of the State–Trait
Inven-tory for Cognitive and Somatic Anxiety (STICSA),30 and
between the TDI and the anxiety state, as measured by the State Scale of the STICSA, were 0.51 and 0.49, respectively (probability [ps]0.01). These correlations were weaker than those between the GDS and the STICSA
scales (r =0.63 and r =0.57, respectively; ps0.01), showing
the better discriminant validity of the TDI over the GDS. Negative and significant correlations were found with both
the scales of the Short-Form-12 Health Survey (SF-12),31 the
Physical Composite Score (r =−0.39; P0.01) and the Mental
Composite Score (r =−0.54; P0.01), which assesses
health-related quality of life for both physical and mental health dimensions (Balsamo et al, unpublished data, 2014).
purpose of the study
The current study aimed to determine a cut-off score for the TDI that could differentiate between varying levels of depression in a group of clinically diagnosed individuals with depression disorders. The identification of a cut-off score that is indicative of a probable case of clinical depression can be used as a guide in the making of important decisions with regards to the treatment and study of depression. We expected that this self-report measure would provide sensitive and specific cut-off scores, reliably distinguishing between varying severities of depression.
Methods
participants
Participants were 125 psychiatric outpatients with a current DSM-IV-TR diagnosis, of whom 89 were females (71.2%) and 71 were males (28.8%). The average age was 42.71 years
(standard deviation [SD] =15.26; age range 18–79).
The mean for years of education was 11.43 (SD =4.12;
range 1–22 years). Sociodemographic characteristics of the participants are listed in Table 1.
Inclusion criteria were 1) a current principal Axis I diagnosis
according to the DSM-IV-TR diagnostic criteria;11 and
2) a minimum age of 18 years, or older. Exclusion criteria included the presence of any condition affecting the ability to take the self-report assessment, such as 1) severe medi-cal diagnoses; 2) any major disorder of the central nervous
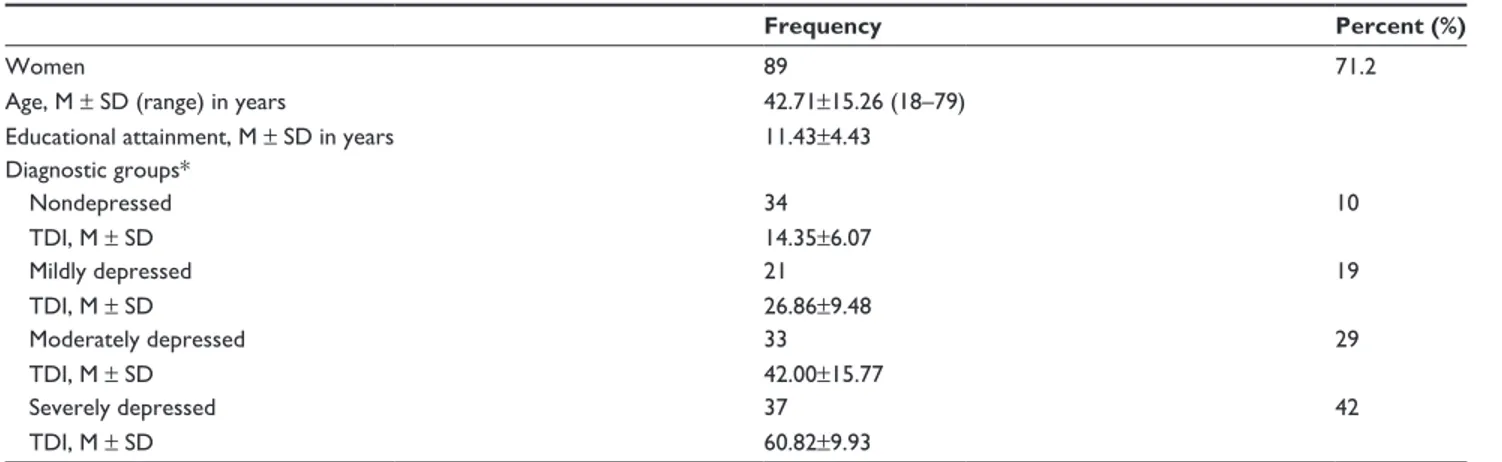
Table 1 Descriptive statistics of the participant sample (N=125)
Frequency Percent (%)
Women 89 71.2
Age, M ± SD (range) in years 42.71±15.26 (18–79)
educational attainment, M ± SD in years 11.43±4.43
Diagnostic groups* Nondepressed 34 10 TDI, M ± SD 14.35±6.07 Mildly depressed 21 19 TDI, M ± SD 26.86±9.48 Moderately depressed 33 29 TDI, M ± SD 42.00±15.77 Severely depressed 37 42 TDI, M ± SD 60.82±9.93
Note: *Diagnoses were conducted according to the patient version of the Structured Clinical Interview for the DSM-IV-Tr Clinical Version (SCID-I; First et al).36
Abbreviations: M, mean; SD, standard deviation; TDI, Teate Depression Inventory; DSM-IV-Tr, Diagnostic and Statistical Manual of Mental Disorders Version IV,
Text Revision.
system; 3) current florid psychotic symptoms; and 4) refusal to give informed consent.
Of the 125 patients, 91 were diagnosed with single episode or recurrent major depression, including DSM-IV-TR specifiers (mild, moderate, or severe depres-sion). Specifically, 21 patients were classified as mildly depressed, 33 as moderately depressed, and 37 as severely depressed (Table 1). The remaining 34 patients were classified as nondepressed based on the absence of diagnostic criteria, such as 1) any major affective disorder; 2) depressive disorder, not otherwise specified; 3) dysthymic disorder; and 4) adjustment disorder with depressed mood or mixed emotional features. These patients fulfilled the DSM-IV-TR diagnoses of anxiety disorders
(N=11); dissociative disorders (N=10); eating disorders (N=6);
somatoform disorders (N=3); impulse control disorder (N=2);
conversion disorder (N=1); and algicdisorder (N=1).
Of the 125 patients, 7.2% (N=9) were free from
pharma-cological and/or psychotherapeutic treatment, 29.6% (N=37)
received psychotherapeutic treatment, 41.6% (N=52) received
pharmacological treatment, and 21.6% (N=27) received both
pharmacological and psychotherapeutic treatment. Patients were recruited through private psychotherapeutic
institu-tions (N=53; 42.4%) and public psychiatric departments
(N=72; 57.6%). They were outpatients (N=117; 93.6%), and
hospitalized patients (N=8; 6.4%). Their occupations included
housewives (N=32; 25.6%), pensioners (N=4; 3.2%),
work-ers (N=39; 31.2%), self-employees (N=9; 7.2%), managers
(N=14; 11.2%), unemployed (N=15; 12%), and students
(N=12; 9.6%). Study participants were recruited between
November 2007 and May 2008. They completed the TDI and a diagnostic structured clinical interview for DSM-IV-TR Axis
I disorders (SCID-1),32 conducted by psychiatrists, as a part of
the standard intake assessment in the psychiatric institutions.
Each test session began with the SCID-I.32 Thereafter, the
administrator presented and explained the TDI and a demo-graphic data sheet. All participants contributed voluntarily and anonymously. No honorarium was given for completing the assessments, which the participants provided written and informed con sent for. The study was approved by the local Institutional Review Board.
Measures
The TDI
The TDI is a new 21-item self-report instrument designed to assess major depression as specified by the latest
edi-tions of the DSM, ediedi-tions IV-TR and V.11,33 The TDI was
developed using Rasch analysis, in order to overcome psychometric weaknesses of existing depression measures. Each item of the TDI is rated on a 5-point Likert-type scale ranging from 0 (always) to 4 (never). The total score ranges from 0–84, with higher scores indicating more severe
depressive symptoms. In a study of test development,34 the
fit between raw data and the Rasch model was satisfactory; therefore, the TDI represents an “objective” measure of depression. Other psychometric properties, found in the clinical and nonclinical samples, included 1) excellent
Person Separation Index (=0.95), which is the proportion of
observed variance that is considered true; 2) no evidence of sex bias due to item–trait interaction (even when items are administered to respondents belonging to different sexes, they will continue to measure the same ability, or, in this case, severity of depression [invariance]); and 3) control of major response sets, such as acquiescence and social desirability.
A recently developed, small but growing body of literature shows that TDI demonstrates greater discriminant validity than the BDI-II34 as well as having an excellent internal
consistency and convergent validity (Balsamo et al, unpub-lished data, 2014).20,21 In the present sample, Cronbach’s
alpha was 0.97.
The SCID-I
The SCID-I is a semi-structured diagnostic interview designed to assess the DSM-IV-TR diagnostic criteria for Axis I disorders.11,32,36 Several studies have shown its
superior validity over standard clinical interviews at intake episodes.37–39 The SCID-I begins with an overview of the
patient’s presenting complaints and history. Then, the inter-viewer proceeds through several required diagnostic modules until the interview is complete. The SCID-I incorporates a categorical system for the rating of symptomatology and diagnostic criteria, and algorithms that guide the interviewer through the diagnostic process. When the interview is com-pleted, lifetime and current Axis I diagnoses are recorded on a summary score sheet.
Statistical analysis
The following procedures were employed for the purpose of developing a set of cut-off scores for the assessment of depression severity among patients with a major depressive disorder. First, according to clinical diagnoses based on the administration of the outpatient version of the SCID-I, sample patients were classified into four groups: 1) mildly depressed, 2) moderately depressed, 3) severely depressed, and 4) nondepressed. Next, optimal cut-off scores for the TDI were developed through the use of receiver operating
char-acteristic (ROC) curves.40 Hence, the following three ROC
curves were constructed: 1) the nondepressed group vs the mildly depressed group; 2) the nondepressed and mildly depressed groups vs the moderately depressed group; and 3) the nondepressed, mildly depressed, and moderately depressed groups vs the severely depressed group.
ROC curve analysis displays the relation between the sensitivity (true positives) and the inverse of the specific-ity (true negatives) at each value along a dimensional screening scale as it pertains to differentiating two groups of interest (eg, nondepressed groups vs mildly depressed groups).
A ROC curve is a two-dimensional depiction of test performance. The curve results from matching each point along the total scale score in terms of that score’s sensi-tivity and the inverse of its specificity with regards to the
two groups being examined. For each ROC curve generated in this study, the percentage of true positives (or “hits”) was plotted against the percentage of false positives (or “false alarms”), according to successive TDI cut-off scores.
The main outcome variable is the area under the ROC
curve, abbreviated AUC.41,42 The AUC is interpreted as
the probability that a randomly sampled respondent will
be correctly assigned to the appropriate group.42 Thus, the
AUC directly represents the overall accuracy of the instru-ment in screening for depression. Since the AUC is a por-tion of the area of the unit square, its value will always be between zero and one. An AUC of 0.5 indicates random performance; one denotes perfect performance. Specifi-cally, values of 0.9–1 indicate excellent predictive accuracy, values 0.8–0.9 good accuracy, values 0.7–0.8 fair accuracy, values 0.6–0.7 poor accuracy, and 0.5–0.6 unacceptably poor accuracy.43,44
For this study in which maximizing sensitivity (the prob-ability of correctly classifying an individual as depressed, or more severely depressed, according to the TDI score) and maximizing specificity (the probability of correctly classify-ing a respondent as not depressed, or less severely depressed)
is considered equally important,7 the optimal cut-off score
occurs at the point of furthest displacement of the ROC curve. It reflects the maximum vertical distance between the ROC
curve and the chance line.45
All statistical analyses were conducted using SPSS soft-ware version 18.0 (IBM Corporation, Armonk, NY, USA)
according to the non-parametric method.42
Results
Mean TDI scores ± standard deviation (SD) obtained by the
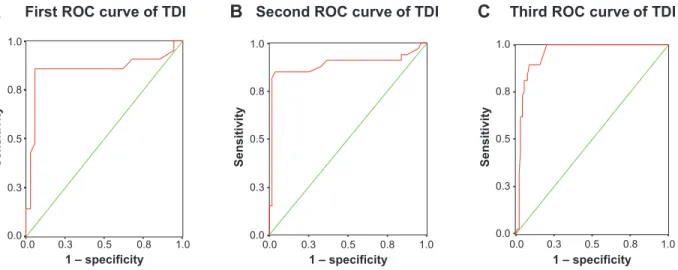
four groups from the sample described in the “Participants” section are listed in Table 1. The three ROC curves are shown in Figure 1. The diagonal green line is the “chance line” and the red line is the ROC curve of the TDI. Informally, one point (test) in ROC space is better than another if it is to the northwest (true positives rate higher, false positives are lower, or both) of the first point. The point (delineated as 0, 1 in Figure 1) represents perfect discrimination.
Visual inspection of the ROC curves, as well as their AUCs with 95% confidence intervals (CIs), suggests that the TDI is a good scale for discriminating
nonde-pressed from mildly denonde-pressed patients (AUC =0.85;
error standard [ES] =0.07; 95% CI =0.72–0.98); and
non-depressed and mildly non-depressed from moderately non-depressed
patients (AUC =0.87; ES =0.05; 95% CI =0.79–0.98),
1 – specificity
Sensitivit
y
First ROC curve of TDI
A
1 – specificity0.5 0.8 1.0 0.3 0.0 1.0 0.8 0.5 0.3 0.0 Sensitivit y 1.0 0.8 0.5 0.3 0.0 1.0 0.8 0.5 0.3 0.0Second ROC curve of TDI
B
1 – specificity0.5 0.8 1.0 0.3 0.0 Sensitivit y 1.0 0.8 0.5 0.3 0.0Third ROC curve of TDI
C
Figure 1 receiver operating characteristic (roC) curves for the Teate Depression Inventory (TDI) (red curve).
Notes: The chance line is the green line. The closer the curve is to the upper left hand corner of the graph, the better the diagnostic performance of the TDI. roC curves
were constructed by comparing the nondepressed group versus the mildly depressed group (A); the nondepressed and mildly depressed groups versus the moderately
depressed group (B); and the nondepressed, mildly depressed, and moderately depressed groups versus the severely depressed group (C).
predictive accuracy for discriminating the nondepressed, mildly depressed, and moderately depressed group from the
severely depressed group (AUC =0.95; ES =0.02; 95% CI
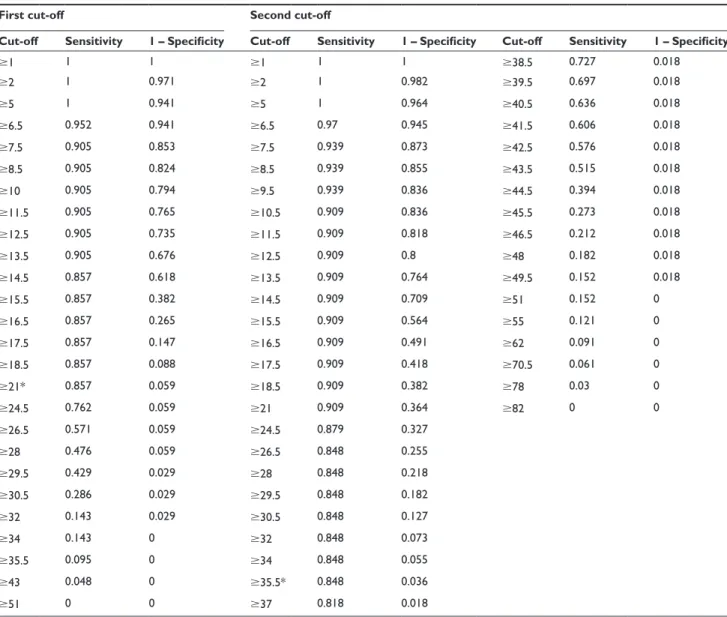
=0.91–0.98). In order to choose optimal cut-off values by simultaneously maximizing sensitivity and specificity, we analyzed the coordinates of each ROC curve (Table 2).
The optimal cut-off point was a TDI total score of 21 for the first ROC curve. At this point, sensitivity was 0.86, specificity was 0.94, and classification accuracy was 0.90 (Tables 2 and 3). This cut-off score yielded 85.7% true-positives, 5.8% positives, and 14.2% false-negatives. The optimal cut-off value was a TDI total score of 35.5 for the second ROC curve. At this point, sensitivity was 0.82, specificity was 0.98, and classification accuracy was 0.90 (Tables 2 and 3). The cut-off score yielded 81.8% true-positives, 1.8% positives, and 18.2% negatives. The optimal cut-off point to equalize false- positives and false-negatives was a TDI total score of 49.5 for the third ROC curve. At this point, sensitivity was 0.81, specificity was 0.94, and classification accuracy was 0.88 (Table 2). The cut-off score yielded 81.1% true-positives, 5.7% false-positives, and 18.9% false-negatives. Additional details for performance of the cut-off scores are presented in Table 2. Based on our findings, the following cut-off score guidelines are suggested for total TDI scores of patients diagnosed with major depression: 1) for total scores ranging from 0–21, depression should be classified as “minimal”; 2) for total scores ranging from 22–36, classification should be “mild”; 3) for total scores ranging from 37–50, depression should be labelled “moderate”; and 4) for total scores ranging from 51–84, depression should be classified as “severe”.
Discussion
The present study aimed to identify cut-off scores for the TDI that could differentiate levels of depression severity in a sample of patients with a clinician-diagnosed Axis I depres-sion disorders. Important observations can be made when a specific method is used to determine the optimal cut-off scores for a depression rating instrument.5 Sensitivity or true
positives (in this case, correct identification as a depression patient) and specificity or true negatives (correct identifica-tion as a control) are the most evident markers. Nevertheless, false positives (ie, incorrect identification as a depression patient) and false negatives (ie, incorrect identification as a control) should also be considered. In mental health, while false positives can be associated with the potential for stigmatization of psychiatric illness, false negatives can result in a failure to provide appropriate therapeutic treatments. Determining cut-off scores is challenging and depends mainly on the advantages of true positives and true negatives as well as their relative costs.5 In classical
medical settings, missing a diagnosis (a false negative) of an important pathology may have a significantly higher cost than arriving at a false diagnosis (a false positive). In such conditions, the emphasis would be on sensitivity rather than specificity. Nevertheless, the nature of mental health issues is that false positives and false negatives are often
consid-ered equally problematic.7 One strategy to reduce both false
positives and false negatives is to give them equal weight
in identifying a cut-off score.5,7 Accordingly, in the present
study three separate ROC curves were generated for psychi-atric patients. The rates of sensitivity and specificity of the three cut-off scores (Table 3) support their usefulness in
Table 2 Coordinates of the three roC curves
First cut-off Second cut-off Third cut-off
Cut-off Sensitivity 1 – Specificity Cut-off Sensitivity 1 – Specificity Cut-off Sensitivity 1 – Specificity Cut-off Sensitivity 1 – Specificity Cut-off Sensitivity 1 – Specificity Cut-off Sensitivity 1 – Specificity
1 1 1 1 1 1 38.5 0.727 0.018 1 1 1 38.5 1 0.284 71.5 0.108 0.023 2 1 0.971 2 1 0.982 39.5 0.697 0.018 2 1 0.989 39.5 1 0.273 73.5 0.054 0.023 5 1 0.941 5 1 0.964 40.5 0.636 0.018 5 1 0.977 40.5 1 0.25 74.5 0.027 0.023 6.5 0.952 0.941 6.5 0.97 0.945 41.5 0.606 0.018 6.5 1 0.955 41.5 1 0.239 78 0.027 0.011 7.5 0.905 0.853 7.5 0.939 0.873 42.5 0.576 0.018 7.5 1 0.898 42.5 1 0.227 82 0 0 8.5 0.905 0.824 8.5 0.939 0.855 43.5 0.515 0.018 8.5 1 0.886 43.5 1 0.205 10 0.905 0.794 9.5 0.939 0.836 44.5 0.394 0.018 9.5 1 0.875 44.5 0.892 0.159 11.5 0.905 0.765 10.5 0.909 0.836 45.5 0.273 0.018 10.5 1 0.864 45.5 0.892 0.114 12.5 0.905 0.735 11.5 0.909 0.818 46.5 0.212 0.018 11.5 1 0.852 46.5 0.892 0.091 13.5 0.905 0.676 12.5 0.909 0.8 48 0.182 0.018 12.5 1 0.841 47.5 0.838 0.08 14.5 0.857 0.618 13.5 0.909 0.764 49.5 0.152 0.018 13.5 1 0.818 48.5 0.811 0.08 15.5 0.857 0.382 14.5 0.909 0.709 51 0.152 0 14.5 1 0.784 49.5 0.811 0.068 16.5 0.857 0.265 15.5 0.909 0.564 55 0.121 0 15.5 1 0.693 50.5* 0.811 0.057 17.5 0.857 0.147 16.5 0.909 0.491 62 0.091 0 16.5 1 0.648 51.5 0.757 0.057 18.5 0.857 0.088 17.5 0.909 0.418 70.5 0.061 0 17.5 1 0.602 53.5 0.73 0.045 21* 0.857 0.059 18.5 0.909 0.382 78 0.03 0 18.5 1 0.58 55.5 0.703 0.045 24.5 0.762 0.059 21 0.909 0.364 82 0 0 21 1 0.568 56.5 0.649 0.045 26.5 0.571 0.059 24.5 0.879 0.327 24.5 1 0.534 57.5 0.622 0.045 28 0.476 0.059 26.5 0.848 0.255 26.5 1 0.477 59.5 0.622 0.034 29.5 0.429 0.029 28 0.848 0.218 28 1 0.455 61.5 0.595 0.034 30.5 0.286 0.029 29.5 0.848 0.182 29.5 1 0.432 63.5 0.541 0.034 32 0.143 0.029 30.5 0.848 0.127 30.5 1 0.398 65.5 0.432 0.034 34 0.143 0 32 0.848 0.073 32 1 0.364 66.5 0.324 0.023 35.5 0.095 0 34 0.848 0.055 34 1 0.352 67.5 0.243 0.023 43 0.048 0 35.5* 0.848 0.036 35.5 1 0.341 68.5 0.216 0.023 51 0 0 37 0.818 0.018 37 1 0.318 69.5 0.135 0.023
Note: *Cut-off value maximizes both sensitivity and specificity. Abbreviation: roC, receiver operating characteristic.
Table 3 prediction parameters for total Teate Depression Inventory (TDI) score (N=125)
Cut-off score Sensitivity Specificity Positive predictive power Negative predictive power Classification accuracy 21 0.86 0.94 0.94 0.87 0.90 36 0.82 0.98 0.98 0.84 0.90 50 0.81 0.94 0.93 0.83 0.88
Notes: Sensitivity = true positives/(true positives + false negatives); specificity = true negatives/(true negatives + false positives); positive predictive power = true positives/
(true positives + false positives); negative predictive power = true negatives/(true negatives + false negatives); classification accuracy = (true positives + true negatives)/(true positives + true negatives + false positives + false negatives).
different circumstances. However, as Kraemer et al point out, it is not really a question of which cut-off score to use, but
rather a question of when to use which cut-off score.5 Thus,
the decision to use different cut-off scores for the TDI must be based both on the unique characteristics of the sample and the envisaged purpose for using the TDI.
For example, if the TDI is deployed as a screening instrument, it should be ensured that it misses as few depres-sive patients as possible. If the main purpose is to detect the maximum number of persons with depression, then the cut-off score should be lowered to minimize false nega-tives. Thus, a high sensitivity appears to be indispensable,
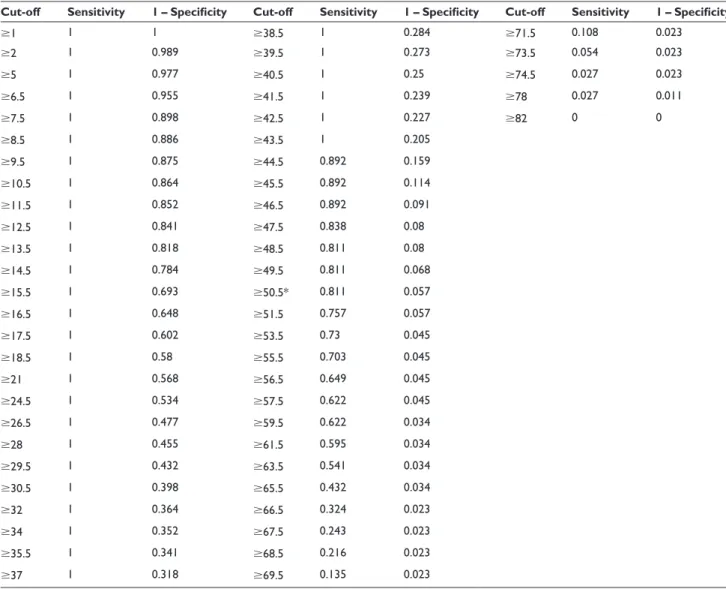
Table 2 Coordinates of the three roC curves
First cut-off Second cut-off Third cut-off
Cut-off Sensitivity 1 – Specificity Cut-off Sensitivity 1 – Specificity Cut-off Sensitivity 1 – Specificity Cut-off Sensitivity 1 – Specificity Cut-off Sensitivity 1 – Specificity Cut-off Sensitivity 1 – Specificity
1 1 1 1 1 1 38.5 0.727 0.018 1 1 1 38.5 1 0.284 71.5 0.108 0.023 2 1 0.971 2 1 0.982 39.5 0.697 0.018 2 1 0.989 39.5 1 0.273 73.5 0.054 0.023 5 1 0.941 5 1 0.964 40.5 0.636 0.018 5 1 0.977 40.5 1 0.25 74.5 0.027 0.023 6.5 0.952 0.941 6.5 0.97 0.945 41.5 0.606 0.018 6.5 1 0.955 41.5 1 0.239 78 0.027 0.011 7.5 0.905 0.853 7.5 0.939 0.873 42.5 0.576 0.018 7.5 1 0.898 42.5 1 0.227 82 0 0 8.5 0.905 0.824 8.5 0.939 0.855 43.5 0.515 0.018 8.5 1 0.886 43.5 1 0.205 10 0.905 0.794 9.5 0.939 0.836 44.5 0.394 0.018 9.5 1 0.875 44.5 0.892 0.159 11.5 0.905 0.765 10.5 0.909 0.836 45.5 0.273 0.018 10.5 1 0.864 45.5 0.892 0.114 12.5 0.905 0.735 11.5 0.909 0.818 46.5 0.212 0.018 11.5 1 0.852 46.5 0.892 0.091 13.5 0.905 0.676 12.5 0.909 0.8 48 0.182 0.018 12.5 1 0.841 47.5 0.838 0.08 14.5 0.857 0.618 13.5 0.909 0.764 49.5 0.152 0.018 13.5 1 0.818 48.5 0.811 0.08 15.5 0.857 0.382 14.5 0.909 0.709 51 0.152 0 14.5 1 0.784 49.5 0.811 0.068 16.5 0.857 0.265 15.5 0.909 0.564 55 0.121 0 15.5 1 0.693 50.5* 0.811 0.057 17.5 0.857 0.147 16.5 0.909 0.491 62 0.091 0 16.5 1 0.648 51.5 0.757 0.057 18.5 0.857 0.088 17.5 0.909 0.418 70.5 0.061 0 17.5 1 0.602 53.5 0.73 0.045 21* 0.857 0.059 18.5 0.909 0.382 78 0.03 0 18.5 1 0.58 55.5 0.703 0.045 24.5 0.762 0.059 21 0.909 0.364 82 0 0 21 1 0.568 56.5 0.649 0.045 26.5 0.571 0.059 24.5 0.879 0.327 24.5 1 0.534 57.5 0.622 0.045 28 0.476 0.059 26.5 0.848 0.255 26.5 1 0.477 59.5 0.622 0.034 29.5 0.429 0.029 28 0.848 0.218 28 1 0.455 61.5 0.595 0.034 30.5 0.286 0.029 29.5 0.848 0.182 29.5 1 0.432 63.5 0.541 0.034 32 0.143 0.029 30.5 0.848 0.127 30.5 1 0.398 65.5 0.432 0.034 34 0.143 0 32 0.848 0.073 32 1 0.364 66.5 0.324 0.023 35.5 0.095 0 34 0.848 0.055 34 1 0.352 67.5 0.243 0.023 43 0.048 0 35.5* 0.848 0.036 35.5 1 0.341 68.5 0.216 0.023 51 0 0 37 0.818 0.018 37 1 0.318 69.5 0.135 0.023
Note: *Cut-off value maximizes both sensitivity and specificity. Abbreviation: roC, receiver operating characteristic.
although gains in sensitivity are generally at the expense of specificity, and vice versa.46,47 Therefore, alternative TDI
cut-off scores could be considered (Table 2), which, however, would coincide with significantly decreased specificity. Low specificity would force an investment in multiple resources to diagnose patients who are not depressed, since a positive depression screening should entail an additional diagnostic session that usually includes a structured diagnostic inter-view. Although the number of false positives would increase, this method may be useful when screening for possible cases of depression.
For research studies in which it is important to obtain a group of persons with depression as pure as possible with regard to symptomatology, the cut-off score should be raised to reduce the number of false positives. Researchers may use
the data in Table 2 for their particular samples and purposes, in light of the relative importance of sensitivity vs specificity to their research design.
In any case, a single score on one self-report measure cannot replace clinicians’ judgments in terms of providing a diagnosis. In clinical settings, the use of an assessment instru-ment, which has a higher sensitivity than 80% in identifying probable cases of clinical depression, is likely to be of great advantage in detecting patients who need follow-up assess-ments. In research settings, where clinician assessment is less often available (but not less important), a cut-off score which estimates the prevalence and likelihood of clinical depression more carefully is almost guaranteed.
The present study adds to the utility of an already prom-ising measure, the TDI, by providing both researchers and
clinicians with cut-off scores to identify different levels of severity of depression. However, further studies on the TDI’s psychometric properties, using larger and more diverse samples including a greater number of males, patients in dif-ferent age groups, and patients with comorbid disorders, are needed to cross-validate the newly established cut-off scores. Future studies using larger, more diverse samples could provide additional diagnostic information that may serve as an additional, externally validated criterion for determining the TDI’s screening performance.
Author contributions
MB was both principal investigator and project director of the study. AS made substantial contribution to conception and design of the study. All authors have contributed to and have approved the final manuscript.
Disclosure
The authors report no conflicts of interest in this work.
References
1. Widiger TA, Coker LA. Mental disorders as discrete clinical conditions: Dimensional versus categorical classification. In Hersen M, Turner SM, editors. Adult psychopathology and diagnosis. 4th ed. New York: John Wiley and Sons; 2003:3–35.
2. Widiger TA, Samuel DB. Diagnostic categories or dimensions? A question for the Diagnostic and Statistical Manual of Mental Disorders – fifth edition. J Abnorm Psychol. 2005;114(4):494–504.
3. Frances A, Mack AH, First MB, et al. DSM-IV meets philosophy.
J Med Philos. 1994;19(3):207–218.
4. Flett G, Vredenburg K, Krames L. The continuity of depression in clini-cal and noncliniclini-cal samples. Psychol Bull. 1997;121(3):395–416. 5. Kraemer HC, Noda A, O’Hara R. Categorical versus dimensional
approaches to diagnosis: methodological challenges. J Psychiatr Res. 2004;38(1):17–25.
6. Kessler RC. Epidemiological perspectives for the development of future diagnostic systems. Psychopathology. 2002;35(2–3):158–161. 7. Kessler RC, Barker PR, Colpe LJ, et al. Screening for serious
men-tal illness in the general population. Arch Gen Psychiatry. 2003; 60(2):184–189.
8. Van Dam NT, Gros DF, Earleywine M, Antony MM. Establishing a trait anxiety threshold that signals likelihood of anxiety disorders. Anxiety
Stress Coping. 2013;26(1):70–86.
9. Akiskal HS. Validating affective personality types. In: Robins L, Barrett J, editors. The Validity of Psychiatric Diagnosis. New York: Raven Press; 1989:217–227.
10. Rasch G. Probabilistic Models for Some Intelligence and
Attain-ment Tests. Copenhagen, Denmark: Danish Institute for Educational
Research; 1960.
11. American Psychiatric Association, editor. Diagnostic and Statistical
Manual of Mental Disorders. 4th ed., Text Revision. Washington, DC:
American Psychiatric Association; 2000.
12. Mitchell AJ, Vaze A, Rao S. Clinical diagnosis of depression in primary care: a meta-analysis. Lancet. 2009;374(9690):609–619.
13. Mitchell AJ, Rao S, Vaze A. Can general practitioners identify people with distress and mild depression? A meta-analysis of clinical accuracy.
J Affect Disord. 2011;130(1–2):26–36.
14. Beck A. Depression: Causes and Treatment. Philadelphia: University of Pennsylvania Press; 1972.
15. Beck AT, Rush AJ, Shaw BF, Emery G. Cognitive Therapy of
Depres-sion. New York: Guilford Press; 1979.
16. Clak DA, Beck AT. Scientific Foundations of Cognitive Theory
and Therapy of Depression. New York: John Wiley and Sons;
1999.
17. Balsamo M, Saggino A. Test per l’assessment della depressione nel contesto italiano: un’analisi critica [Depression assessment question-naires in the Italian context: A critical analysis]. Psicoterapia Cognitiva
e Comportamentale. 2007;13(2):167–199. Italian.
18. Balsamo M, Giampaglia G, Saggino A. Building a new Rasch-based self-report inventory of depression. Neuropsychiatr Dis
Treat. 2014;10:153–165.
19. Balsamo M, Saggino A. TDI - Teate Depression Inventory- Manual. Firenze: Hogrefe Editore; 2013. Italian.
20. Balsamo M, Imperatori C, Sergi MR, et al. Cognitive vulnerabilities and depression in young adults: an ROC curves analysis. Depress Res
Treat. 2013;2013:407602.
21. Balsamo M, Romanelli R, Innamorati M, Ciccarese G, Carlucci L, Saggino A. The State-Trait Anxiety Inventory: shadows and lights on its construct validity. J Psychopathol Behav Assess. 2013;35: 475–486.
22. Whisman MA, Perez JE, Ramel W. Factor structure of the Beck Depres-sion Inventory-Second Edition (BDI-II) in a student sample. J Clin
Psychol. 2000;56(4):545–551.
23. Wu PC, Chang L. Psychometric properties of the Chinese version of the Beck Depression Inventory-II using the Rasch Model. Meas Eval
Couns Dev. 2008;41(1):13.
24. Storch EA, Roberti JW, Roth DA. Factor structure, concurrent validity, and internal consistency of the Beck Depression Inventory-second edition in a sample of college students. Depress Anxiety. 2004;19(3):187–189.
25. Osman A, Kopper BA, Barrios F, Gutierrez PM, Bagge CL. Reliabil-ity and validReliabil-ity of the Beck Depression Inventory-II with adolescent psychiatric inpatients. Psychol Assess. 2004;16(2):120–132. 26. Gibbons RD, Clark DC, VonAmmon Cavanaugh S, Davis JM.
Applica-tion of modern psychometric theory in psychiatric research. J Psychiatr
Res. 1985;19(1):43–55.
27. da Rocha NS, Chachamovich E, de Almeida Fleck MP, Tennant A. An introduction to Rasch analysis for psychiatric practice and research.
J Psychiatr Res. 2013;47(2):141–148.
28. Beck A, Steer R. Beck Anxiety Inventory Manual. San Antonio: The Psychological Corporation; 1993.
29. Yesavage JA, Brink TL, Rose TL, et al. Development and validation of a geriatric depression screening scale: a preliminary report. J Psychiatr
Res. 1982–1983;17(1):37–49.
30. Ree MJ, French D, MacLeod C, Locke V. Distinguishing cognitive and somatic dimensions of state and trait anxiety: Development and validation of the State-Trait Inventory for Cognitive and Somatic Anxiety (STICSA). Behav Cogn Psychother. 2008;36(3): 313–332.
31. Ware J Jr, Kosinski M, Keller SD. A 12-Item Short-Form Health Survey: construction of scales and preliminary tests of reliability and validity.
Med Care. 1996;34(3):220–233.
32. Mazzi F, Morosini P, de Girolamo G, Lussetti M, Guaraldi G. SCID-I
CV: Intervista Clinica Strutturata per i Disturbi Dell’asse I del DSM-IV, Versione Clinica [SCID–I CV: Structured Clinical Interview for DSM–IV Axis I Disorders, Clinical Version]. Firenze: Organizzazioni
Speciali; 2000. Italian.
33. American Psychiatric Association, editor. Diagnostic and
Statisti-cal Manual of Mental Disorders: DSM-V. 5th ed. Arlington County:
American Psychiatric Publishing; 2013.
34. Balsamo M, Giampaglia G, Saggino A. Building a new Rasch-based self-report inventory of depression. Neuropsychiatr Dis Treat (in
press). 2014;10:153–165.
35. Beck A, Steer R, Brown G. Beck Depression Inventory-II, Manual. San Antonio: The Psychological Corporation; 1996.
Neuropsychiatric Disease and Treatment
Publish your work in this journal
Submit your manuscript here: http://www.dovepress.com/neuropsychiatric-disease-and-treatment-journal
Neuropsychiatric Disease and Treatment is an international, peer-reviewed journal of clinical therapeutics and pharmacology focusing on concise rapid reporting of clinical or pre-clinical studies on a range of neuropsychiatric and neurological disorders. This journal is indexed on PubMed Central, the ‘PsycINFO’ database and CAS,
and is the official journal of The International Neuropsychiatric Association (INA). The manuscript management system is completely online and includes a very quick and fair peer-review system, which is all easy to use. Visit http://www.dovepress.com/testimonials.php to read real quotes from published authors.
Dove
press
36. First MB, Spitzer RL, Gibbon M, Williams JB. Structured Clinical
Interview for DSM-IV Axis I Disorders, (SCID-I), Clinical Version.
Washington, DC: American Psychiatric Association; 1997.
37. Fennig S, Naisberg-Fennig S, Craig TJ, Tanenberg-Karant M, Bromet EJ. Comparison of clinical and research diagnoses of substance use disorders in a first-admission psychotic sample. Am J Addiction. 1996;5(1):40–48.
38. Ramirez Basco M, Bostic JQ, Davies D, et al. Methods to improve diagnostic accuracy in a community mental health setting. Am J
Psy-chiatry. 2000;157(10):1599–1605.
39. Zanarini MC, Frankenburg FR. Attainment and maintenance of reli-ability of axis I and II disorders over the course of a longitudinal study.
Compr Psychiatry. 2001;42(5):369–374.
40. Gleitman H. Psychology. New York: Norton & Co; 1986.
41. Bradley AP. The use of the area under the ROC curve in the evaluation of machine learning algorithms. Pattern Recogn. 1997; 30(7):1145–1159.
42. Hanley JA, McNeil BJ. The meaning and use of the area under a receiver operating characteristic (ROC) curve. Radiology. 1982;143(1):29–36.
43. Metz CE. Basic principles of ROC analysis. Semin Nucl Med. 1978;8(4):283–298.
44. Somoza E, Soutullo-Esperon L, Mossman D. Evaluation and optimiza-tion of diagnostic tests using receiver operating characteristic analysis and information theory. Int J Biomed Comput. 1989;24(3):153–189. 45. Schisterman EF, Perkins NJ, Liu A, Bondell H. Optimal cut-point and
its corresponding Youden Index to discriminate individuals using pooled blood samples. Epidemiology. 2005;16(1):73–81.
46. Mulrow CD, Williams JW Jr, Gerety MB, Ramirez G, Montiel OM, Kerber C. Case-finding instruments for depression in primary care settings. Ann Intern Med. 1995;122(12):913–921.
47. Whooley MA, Avins AL, Miranda J, Browner WS. Case-finding instru-ments for depression. J Gen Intern Med. 1997;12(7):439–445.