www.nature.com/scientificreports
Complete mitochondrial sequences
from Mesolithic Sardinia
Alessandra Modi
1,*, Francesca Tassi
2,*, Roberta Rosa Susca
2, Stefania Vai
1, Ermanno Rizzi
3,4,
Gianluca De Bellis
4, Carlo Lugliè
5, Gloria Gonzalez Fortes
2, Martina Lari
1, Guido Barbujani
2,
David Caramelli
1,*& Silvia Ghirotto
2,*Little is known about the genetic prehistory of Sardinia because of the scarcity of pre-Neolithic human remains. From a genetic perspective, modern Sardinians are known as genetic outliers in Europe, showing unusually high levels of internal diversity and a close relationship to early European Neolithic farmers. However, how far this peculiar genetic structure extends and how it originated was to date impossible to test. Here we present the first and oldest complete mitochondrial sequences from Sardinia, dated back to 10,000 yBP. These two individuals, while confirming a Mesolithic occupation of the island, belong to rare mtDNA lineages, which have never been found before in Mesolithic samples and that are currently present at low frequencies not only in Sardinia, but in the whole Europe. Preliminary Approximate Bayesian Computations, restricted by biased reference samples for Mesolithic Sardinia (the two typed samples) and Neolithic Europe (limited to central and north European
sequences), suggest that the first inhabitants of the island have had a small or negligible contribution to the present-day Sardinian population, which mainly derives its genetic diversity from continental migration into the island by Neolithic times.
Due to its geographic isolation in the Mediterranean sea, the biological history of Sardinia has been the subject of extensive anthropological and population-genetics investigation. Several studies based on autosomal markers1–4, mitochondrial DNA (mtDNA)5–9 and Y-chromosome polymorphisms10–13 showed that the Sardinian population is one of the main European genetic outliers14–17 and reported unusually high levels of internal diversity18,19. Most of these studies compared variation in Sardinia and in other European populations, but there is still uncertainty about past population dynamics and demographic processes within the island, as well as about the exact nature and the extent of the genetic exchanges that occurred over millennia, actually determining the existing Sardinian genetic structure.
Controversy has also surrounded the origins and the antiquity of the colonization of Sardinia. The earliest presence of humans is still under debate. Some authors likely date it back to the end of the Middle Pleistocene, on the base of lithic artifacts typology, attributed to the Lower Paleolithic20–22. Nonetheless, neither human remains nor absolute-dated contextual evidence support this hypothesis. However, clues of human settlements arose only from the end of the Upper Pleistocene23,24, with single human remains discovered out of context and dated back to 20,000 years ago just on the base of stratigraphic correlations25. The first evidence of Holocene frequentation of the island are scattered in a few rock-shelters and caves, exclusively on the inside of a 20 km coast belt26. After this poorly-documented phase, with around 500 years hiatus of archaeological evidence, with the advent of the agriculture, the population of the island increased in size, as demonstrated by the density of Early Neolithic (EN) sites (VI millennium BCE), and at the beginning of the IV millennium BCE, starting from the Final Neolithic culture of Ozieri, there has been a rapid growth of archaeological documentation and skeletal remains27–30. The fragmented anthropological and archaeological evidence of the Pre-Neolithic phase make it difficult to properly describe a continuity towards the process of Neolithization in Sardinia; however, the gap in the archaeological findings of the two periods suggests a lack of interaction between Mesolithic and EN groups.
From a genetic perspective, a recent genomic study of both ancient and modern Europeans, including data from more than 400 modern-day Sardinians, revealed the existence of genetic affinities between Neolithic Europeans samples and modern Sardinians. According to the authors, these results not only indicate a Neolithic 1Dipartimento di Biologia, Università di Firenze, 50122 Florence, Italy. 2Dipartimento di Scienze della Vita e
Biotecnologie, Università di Ferrara, 44121 Ferrara, Italy. 3Fondazione Telethon, 20121 Milano, Italy. 4Istituto di
Tecnologie Biomediche, CNR, 20090 Segrate, Milano, Italy. 5LASP, Dipartimento di Storia, Beni Culturali e Territorio,
Università di Cagliari, 09124 Cagliari, Italy. *These authors contributed equally to this work. Correspondence and
requests for materials should be addressed to S.G. (email: [email protected]) Received: 29 June 2016
accepted: 17 January 2017 Published: 03 March 2017
origin of modern Sardinians, but also suggest that Sardinians are a “modern-day ‘snapshot’ of the genetic struc-ture of the first farmers associated with the spread of agriculstruc-ture in Europe”31. Unfortunately, this hypothesis has not been supported so far by evidence coming from ancient Sardinian genetic data, due to the paucity of Pre-Neolithic and actual absence of EN human remains. The only ancient data ever published were sequences of the mtDNA control region from Bronze-Age sample8 and revealed a directed genealogical continuity between Nuragic individuals and the current people of Ogliastra, but not of Gallura9. Past dispersal dynamics, genetic exchanges and replacements during the Neolithic in continental Europe have been extensively studied by means of ancient genetic data32–42; although the general European picture is getting clearer, many aspects of the Neolithic transition in Sardinia are still poorly understood, starting from whether, and to what extent, gene flow from mainland Europe during the time of the spread of agriculture actually contributed in shaping the genetic makeup of the island.
With this study, we present the first two complete mitochondrial genome sequences of Mesolithic human remains from Sardinia, dated back to around 10,000 yBP and associated with the earliest direct evidence of human presence in the island43. We analyzed these sequences along with modern and ancient genetic data in order to contextualize the Mesolithic Sardinian haplotypes into the European genetic variation, as well as to investigate the Paleolithic contribution to the current Sardinian gene pool. Preliminary model testing under an Approximate Bayesian Computation (ABC) framework is so far, given the extremely limited reference samples for Mesolithic Sardinia and Neolithic Europe supporting the hypothesis that modern-day Sardinian genetic variation is mostly derived from a massive migration from continental Europe during Neolithic times.
Results
Samples and sequencing.
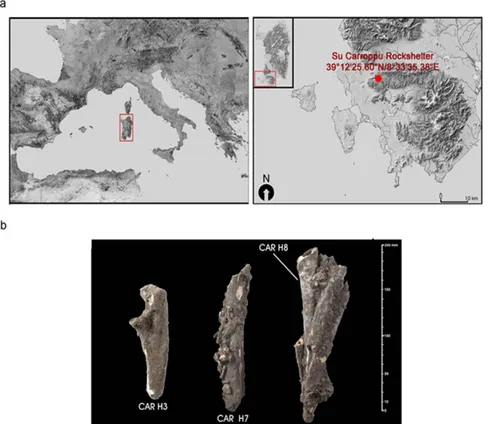
We analyzed the remains of three individuals excavated from the Su Carroppu rockshelter of the Sulcis region (Fig. 1, Supplementary Fig. S1a and b). The Su Carroppu site plays a relevant role in Sardinia, with a remarkably rich archaeological record and a series of occupational phases spanning from the Mesolithic to the historical period. The 1978 archaeological excavations in the lowermost layer (level-4) (Supplementary Fig. S1c), yielded a large quantities of remains, including fragments of human bones intermin-gled with bones of Prolagus sardus. Three direct radiocarbon dates performed on the human bones placed the remains in the mid-9th millennium cal. BCE (Table 1; Supplementary Table S1) thus showing an unexpected Early Mesolithic settlement predating EN occupation43,44.Figure 1. Su Carroppu site and samples. (a) the location of Su Carroppu rockshelter, Sardiania (Italy) and
(b) pictures of the 3 samples used in this study. The map is plotted using data available on http://webgis.regione. sardegna.it/Download/raccolteCartografiche/modelliDigitaliTerreno/DTM10m/.The material is licensed under the Creative Commons attribution 4.0 International license (https://creativecommons.org/licenses/ by/4.0/legalcode). The map was processed with Corel Photo-Paint 9 v9.439 (http://www.coreldraw.com/en/ product/graphic-design-software/? topNav= en, version 9.439 licensed to CL) and modified with Photoshop CC (2015.5).
www.nature.com/scientificreports/
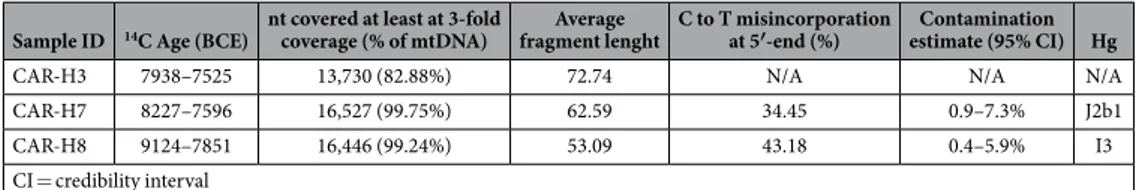
Here we reconstructed nearly complete mitochondrial genomes for two individuals from Su Carroppu (CAR-H7 and CAR-H8, Table 1), using hybridization capture in solution45 coupled with high-throughput sequencing. A third individual from the same site (CAR-H3) was also captured and sequenced, but the resulted sequences did not reached the standard quality requested to guaranty the reliability of the NGS data and the sample was excluded for further analysis. The samples displayed typical features of aDNA46: short fragments, with average length < 65 base pairs (bp), and high rate of cytosine deamination at the 5′ end of the molecules (Table 1; Supplementary Fig. S2; Supplementary Table S2). To further assess authenticity in our ancient mitochondrial genomes we evaluated the percentage of possible contaminant reads by estimating the amount of secondary bases at each haplogroup-defining positions: excluding the putative damaged bases, CAR-H7 reached the 4.04% and CAR-H8 reached the 3.38% (details in Supplementary Table S3), values that are within the range of expected con-taminants considering the observed figures for published aDNA mitogenomes33,40. We also computed Bayesian contamination estimate47: the contamination ranging between 0.9–7.3% for CAR-H7 and 0.4–5.9% for CAR-H8 and the probability of authenticity was high in all the two samples, i.e. 0.95 for CAR-H7 and 0.98 for CAR-H8 (Table 1; Supplementary Fig. S3; Supplementary Table S2). The mitochondrial haplogroups were called using HaploGrep48,49 (Table 1, Supplementary Table S4); the diagnostic variants showed a coverage ranging from 5 to 28 and were further verified by visual inspection. The CAR-H8 sample belongs to haplogroup I3, hence representing, to the best of our knowledge, the first pre-Neolithic sample carrying the haplogroup I. Studies based on complete mitogenomes have previously reported haplogroup I in ancient samples from Iran (individual I674, haplogroup I1c) and Levant (individual I1679, haplogroup I), dated to 5,105 ± 35 yBP and 8,850–8,750 yBP, respectively39. It was also found in two late Neolithic individuals from Germany, both belonging to haplogroup I3a and dated to around 4,000 yBP50 but not in previous periods in Europe. Nowadays, this haplogroup is uncommon; its fre-quency is about 2% in modern Sardinians, 3% across Europe, and raises at maximum 6% in Northern European countries51. This is the first time that haplogroup I is found in a Mesolithic individual in Europe and the fact that we recovered this haplogroup in a sample of only two sequences may mean that it was present at higher frequen-cies in pre-Neolithic Sardinians or, in general, in the population that first settled in the island. The other sample (CAR-H7) belongs to the haplogroup J2b1. The haplogroup J has already been found in late hunter-gatherer European populations, with a frequency of about 4%32. The current frequency of the haplogroup J is higher than that of the haplogroup I, variable in Europe from 1.7% (Caucasus) to 15% (Wales), and representing the 13% of the total modern Sardinians mitochondrial sequences.
Network analyses.
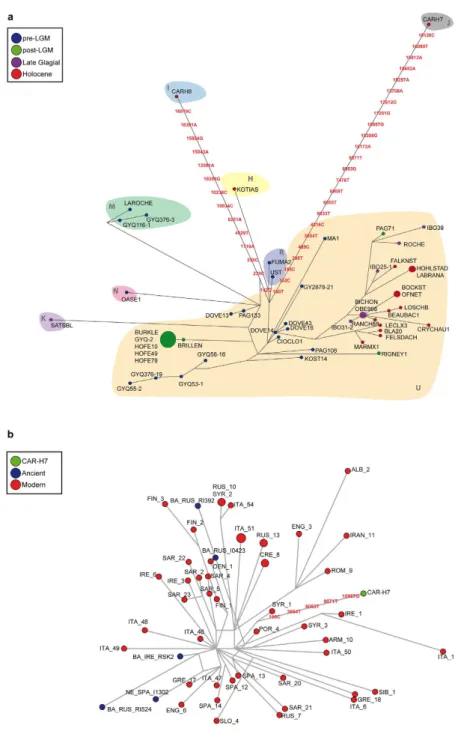
We performed a median-joining network analysis52 to determine the phylogenetic position of the two newly-discovered sequences within the context of the genetic diversity among Pre-Neolithic complete sequences (Supplementary Table S5). Despite the network (Fig. 2a) shows a temporal pattern from left (pre-LGM) to right (Holocene), the Sardinian sequences occupy a peculiar position, not together with coeval sequences (red circles). The background shading indicates the affiliation of the lineages to the major haplogroup definition (that were determined with HaploGrep48 based on PhyloTree Build 16). Among the non-Sardinian Pre-Neolithic samples, the most frequent major haplogroup is U, represented by 41 sequences. Just a few more haplogroups are present, namely H, K, M (three sequences each), N, R (two sequences each). The two Sardinian haplogroups (I3 and J2b1) appear well differentiated from each other and from all the other haplogroups consid-ered in the analysis.The Mesolithic CAR-H7 sample represents so far the oldest sequence belonging to haplogroup J2b. To better investigate the phylogeographic variation of this sequence respect to other European and Sardinian sequences belonging to the same haplogroup, we collected a dataset with 48 modern and 5 ancient J2b sequences (Supplementary Table S6) and we performed a median-joining network analysis52. The network confirmed that the sample CAR-H7 (green dot) falls within the variation expected for the haplogroup J2b, although carrying 5 private polymorphisms (195C, 3654T, 6053T, 9071T, 10957G) (Fig. 2b). The modern Sardinian J2b haplotypes seem to be well differentiated from the Mesolithic sequence. (Fig. 2b).
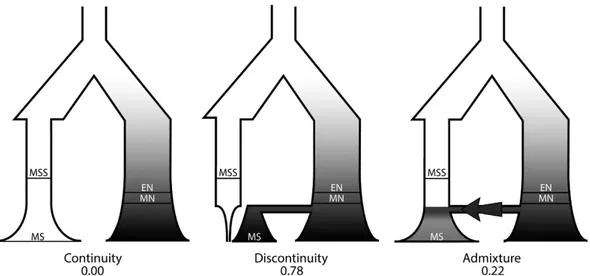
Sardinian past demographic history.
We then investigated the past demographic history and the genea-logical relationships through 10,000 years in Sardinia by Approximate Bayesian Computation53,54. We first defined three alternative models of evolution, shown in Fig. 3. The first, which we called “continuity”, assumed mod-ern inhabitants of Sardinia to be direct descendants of a Mesolithic Sardinian population, without any genetic exchange with continental Europe. The second, which we called “discontinuity”, assumed a complete replacement of ancient Mesolithic Sardinia by Neolithic people from Continental Europe. Under the third model the current inhabitants of Sardinia are a genetic mixture of local Mesolithic individuals and Neolithic individuals from theSample ID 14C Age (BCE) nt covered at least at 3-fold coverage (% of mtDNA) fragment lenghtAverage C to T misincorporation at 5′-end (%) estimate (95% CI) HgContamination
CAR-H3 7938–7525 13,730 (82.88%) 72.74 N/A N/A N/A
CAR-H7 8227–7596 16,527 (99.75%) 62.59 34.45 0.9–7.3% J2b1
CAR-H8 9124–7851 16,446 (99.24%) 53.09 43.18 0.4–5.9% I3
CI = credibility interval
Table 1. Samples analyzed. For each sample, radiocarbon date, the percentage of mtDNA covered at least at
3-fold coverage, average fragment length, deamination at 5′ -end, contamination estimate and mitochondrial haplogroup are reported.
continent. We called this model “admixture”. We performed 500,000 coalescent simulations under each model, with parameter values randomly chosen from prior distributions (see Supplementary Materials for details). We calculated the models’ posterior probabilities by weighted multinomial logistic regression53, evaluating differ-ent thresholds to check the stability of the results. As it is shown in Fig. 3 and in Supplemdiffer-entary Table S7 the continuity model received essentially no support, with the discontinuity model having the highest probability (78%). The admixture model received poor support (22%), with the best fit obtained when 75% of current inhab-itant of Sardinia come from a continental Neolithic population (modal value, see Supplementary Fig. S4 and Supplementary Table S8), that is on the upper bound of its prior distribution.
We determined the accuracy of our model choice inference by calculating the true and the false positive rates using 1,000 random simulations from each model as pseudo-observed datasets; the results are shown in Supplementary Table S9. The true positives rate was high for all the models, ranging from 0.64 to 0.89. The false positive rate was below 0.05 for the discontinuity model, and relatively low, but higher, for the continuity and the admixture model (0.084 and 0.157 respectively). In general, these results mean that the model we tested can be well recognized by the model selection procedure we adopted. We also evaluated the fit of the discontinuity model calculating a p-value for the observed dataset under an estimated general linear model (as in Wegmann et al.55),
Figure 2. Median-joining network based on nucleotide variation in the whole mtDNA within (a) Pre-Neolithic
www.nature.com/scientificreports/
which can also be used to judge if the observed data are in agreement with the data simulated. The so calculated p-value was not significant (0.57), meaning that the observed data are plausible under the model we selected as the best one. The Principal Component Analyses of the best 5,000 simulations coming from each model actually confirmed that the discontinuity model is able to generate the observed variation, and that only a poorer fit is given by the admixture and the continuity model (Supplementary Fig. S5).
To better understand the role of the Neolithic migration in shaping the current Sardinians mitogenome var-iation we then simulated an admixture model (that we called “admixture_tot”) in which the proportion of line-ages of current Sardinians coming from the Neolithic Europe was free to vary from 0 (complete continuity with Mesolithic in Sardinia) to 1 (complete replacement of Sardinian Mesolithics). We estimated the demographic parameters of this model (Table 2 and Supplementary Fig. S6), using summary statistic transformed via Partial Least Square56 (see Supplementary Materials for details). All the parameters resulted to be well estimated, as it is shown by their R squared values, in some cases higher than 0.6. The median and the mode values of the pro-portion of Neolithic mitochondrial lineages that gave rise to current Sardinians were 0.87, and 0.96 respectively, implying that a large proportion of the current mtDNA variation in Sardinia does not come from the first inhab-itants of the island. We estimated these first incomers having an effective population size of about 790 individuals, with a 95% HPD ranging between 100 and 2,700 individuals. Current Sardinian effective population size was estimated to be predictably higher, with a median value of about 21,000 individuals and a wider 95% HPD. The median value of the mutation rate was estimated to be 2.1*10–8 mutations per nucleotide per year, considering a generation time of 30 years57, that is almost identical to the value estimated by Fu et al.47
Discussion
Archaeological evidence suggests the first human presence in Sardinia around 20,000 years ago25, with sporadic and discontinuous occupations during Paleolithic and Mesolithic ages. Nowadays, Sardinians form a distinct outlier within the genetic variation of modern Europeans14, often interpreted as a consequence of thousands years of genetic isolation and drift, but little is known about the demographic changes that could have shaped the observed pattern of genetic variation. The, so far limited, ancient Sardinia genetic data allowed us to highlight
Figure 3. Alternative models of the genealogical relationships among past and present populations, and their posterior probabilities based on 50,000 best fitting simulations. MSS: Mesolithics from Sardinia; MS:
Moderns from Sardinia; EN: Early Neolithics; MN: Middle Neolithics.
Median Mode 95% HPD-LowB 95% HPD-UppB R Squared
P 0.872 0.966 0.518 1 0.400 rs 1.647 1 1 4.050 0.088 Nan 2,649 1,517 107 7,626 0.500 Nas 793 461 100 2,785 0.503 Ncn 38,574 14,871 1673 94,089 0.060 Ncs 21,371 9,801 1,000 84,554 0.312
mut 2.1E-08 2E-08 1.3E-08 3.1E-08 0.523
Table 2. Parameters estimation of the admixture tot model. P is the proportion of Sardinian lineages coming
from Neolithic Europe, rs is the extent of population reduction due to the bottleneck of the first colonization of Sardinia, Nan is the ancient effective population size of Neolithic Europe, Nas is the ancient Sardinian effective population size, Ncn is the current European effective population size, Ncs is the current Sardinian effective population size and mut is the mutation rate per nucleotide per year.
a complete genetic continuity within a specific region of the island, Ogliastra, since the Bronze-Age9; however, cranial morphological evidence suggests that this continuity may have been established since Neolithic times, and possibly earlier58.
The two Mesolithic sequences retrieved in the Su Carroppu archaeological site represent the oldest sample of DNA in Sardinia, thus providing a direct genetic evidence about the first colonizers of the island. The samples were treated following all the golden criteria before DNA extraction and sequencing to avoid any contamination. To determine the mitochondrial haplogroups, trimmed reads were mapped against the reference sequence and only high quality calls, with a quality score of 30 or more were kept (detailed in Supplementary Materials). The comparable mitochondrial DNA data from European late hunter-gatherers have shown a remarkable genetic uni-formity among pre-Neolithic populations, with most of the sequences (∼83%) belonging to the haplogroup U, of which a majority carry U5 haplotypes (> 65%)32. Neither Sardinian sequence belongs to any of the U haplotypes, documenting the presence of substantial genetic differences over the Mediterranean area. In addition, neither sequence has been observed in later, ancient or contemporary, individuals, and both belong to haplogroups and subhaplogroups now present in Europe at low (J,< 16%) or very low (I,< 7%) frequencies, and that are rare in modern Sardinia. Based on complete mitochondrial genomes, Posth et al.41 described a higher genetic diversity in pre-LGM than in post-LGM European populations and identified a major turnover around 14,000 yBP, with the subsequent expansion of haplogroup U that became widespread all around Europe until the Neolithic transition. We do not find haplogroup U in Sardinia by 11,000 yBP, which means a different impact of the LGM in the island, and probably a high isolation of the Sardinian population, not only from Neolithic times onwards (as genomes data seems to have probed), but also from former times considering the dates of our samples.
The phylogenetic network analysis of all the Pre-Neolithic complete mitochondrial sequences so far gener-ated, actually confirmed this view (Fig. 2a). The majority of the Late Pleistocene and Early Holocene sequences belongs to the U lineage, and form a quite homogeneous cluster at the bottom of the network. The two Mesolithic samples from Sardinia are highly differentiated, departing from the network through long branches, so as to indicate mutations possibly arising along thousand years of geographic (and genetic) isolation. The genome-wide data of Ice Age hunter-gatherers have shown that prehistoric Europe was characterized by recurrent populations turnover and migrations42, which resulted in a genetic homogeneity across pre-Neolithic populations. So far, our two ancient Sardinian sequences seem to support the view that these ancient populations movements did not involve genetic exchanges with Sardinians: isolation and drift may have resulted in a substantial mitochondrial differentiation between them and other Europeans. A larger characterisation of ancient sequences across the Mediterranean will help to clarify this suggestion.
The role and the genetic impact of migrations in Sardinia from continental Europe has been under debate for years9,10,31, with particular interest on whether, and to what extent, the gene flow from the mainland during the time of the spread of agriculture in Europe contributed to shaping the present Sardinian gene pool31. We then explicitly compared demographic models through Approximate Bayesian Computation53,59. The question thus addressed was not whether the two Su Carroppu Mesolithic individuals are ancestral to current Sardinians along the maternal line (of course, they are not), but rather what was the posterior probability that a population of size 100–10,000 individuals (the broad interval of priors considered), and comprising the Su Carroppu individuals, may have contributed to the current gene pool. Because the alternative to genealogical continuity since Mesolithic times is immigration from the mainland, Middle and Early Neolithic sequences from Central Europe50 were included as a source of Neolithic migrants into the island. This is not the best reference panel but we were limited to use it given the lack of Neolithic sequences from South Europe. Results must be interpreted with caution. A model of genealogical continuity in Sardinia since Mesolithic times appeared very unlikely. We could not dis-criminate between a model assuming a certain degree of admixture and one of complete replacement by Neolithic immigrants, but if admixture occurred the contribution of Mesolithic people was apparently very limited (Fig. 3).
We assessed the quality of these results by a number of tests. First, we evaluated exactly the probability to obtain false positives in the estimation of models’ posterior probabilities, with the discontinuity model having the lowest type one error. Then, we showed in various ways (posterior predictive p-value and PCA analysis) that the discontinuity model can in fact reasonably reproduce the observed variation. Clearly, a certain degree of uncer-tainty necessarily affects any analysis, particularly when it is based on a single DNA region and on the necessarily small samples in which ancient DNA is usually typed.
When explicitly estimating the Neolithic admixture proportion, i.e. the amount of Neolithic genes from con-tinental Europe that gave rise to the current Sardinian genetic pool (admixture_tot model), we obtained values of 0.8–0.9%, depending on the point estimates considered (Table 2). This means that a significant proportion of modern Sardinian mitochondrial variation would came not from its first settlers, but from a subsequent migration wave from the continent. These results need to be tested in the future when reference ancient data-sets are extended for both Mesolithic Sardinia and Neolithic Mediterranean. It is well accepted in the literature that the Neolithization of Europe proceeded in two waves, one for Central and North Europe, and the other for South Europe/Mediterranean33,35,60,61. But currently, there is no good proxy available for the ancient Neolithic Mediterranean pool. In our model comparison, we fixed the time of this second migration to 6,000 years ago, thus compatible with the archaeological evidence of Neolithic expansion in Sardinia. The spread of agriculture in Sardinia would hence been associated with demic diffusion from the continent, resulting in a large-scale popu-lation replacement. These results, for the first time supported by ancient genetic data, are also in good agreement with archaeological evidence and with what emerged from the comparison of modern Sardinian genomic data and Neolithic and Paleolithic sequences31, interpreted by the authors as evidence of gene flow from mainland Europe during the time of the spread of agriculture in Europe. Sikora et al.31 also envisaged a genetic conti-nuity until present times, but did not provide quantitative measures of it. Another possibility, compatible with our results, would be that Sardinian Paleo-Mesolithic males, but not females, admixed with immigrants from Neolithic Europe. This, however, would mean that in Sardinia the spread of the Neolithic culture was mainly
www.nature.com/scientificreports/
carried out by women, in contrast with the available evidence62. Moreover, this view is also in contrast with stud-ies of sex-biased admixture in modern communitstud-ies, suggesting that the invading population tends to incorpo-rate female residents more than males63–67.
In conclusion, this study, albeit limited to DNA transmitted along the female lines of descent, provides the first genetic evidence on the earliest inhabitants of Sardinia, who bear maternal lineages distinct from current ones. Based on these two sequences, it seems that the Neolithization of the island was not a local development, but was associated with the arrival of a genetically-distinct group of immigrants from continental Europe.
Methods
DNA extraction and Sequencing.
All extraction and library preparation steps before amplification were performed in the clean-room facilities of the Laboratory of Molecular Anthropology and Paleogenetics, University of Florence. Preventive measures were taken to avoid contamination during all experiments.Sample surface was mechanically removed using a dental micro-drill with disposable tools, then the samples were UV-irradiated (254 nm) for 1 hour. Samples were ground to fine powder using the same dental micro-drill at very slow rotation (1000 rpm) and stored at − 20 °C until further use. For each sample, DNA was extracted from 100 mg of bone powder following a silica-based protocol68. A 25 μ l aliquot of each extract was used to produce double-stranded and double-indexed libraries according to a modified Illumina multiplex protocol69. All libraries were amplified to reach plateau and enriched for human mtDNA in a bead-capture method using long-range PCR products as bait for hybridization45. Negative controls were processed during each experimental step (see Supplementary Materials and Supplementary Table S10 for details).
Enriched libraries were pooled in equimolar amount with libraries from other samples and sequenced in paired-end (2 × 75 + 8 + 8 cycles) on the Illumina MiSeq platform at the Institute of Biomedical Technologies, National Research Council, in Segrate (Milano).
NGS Data Processing and Authentication.
Paired-end reads were merged into single reads and the adapters were trimmed using SeqPrep70. Filtered reads were mapped against the revised Cambridge Reference Sequence (rCRS) using BWA71, setting “-l 1000 -n 0.01 -o 2” optimized for increased sensitivity for aDNA; reads with mapping quality below 30 were discarded and PCR duplicates were collapsed into consensus sequences. To estimate the misincorporation pattern at the end of the reads, BAM files were run on mapDamage2.072. Then, to test for the authenticity of the consensus sequences, we used a Bayesian contamination estimate to calculate the probability that the recovered mtDNA fragments come from a single biological source47. A detailed description can be found in Supplementary Materials, and in Supplementary Table S11.Haplogroup identification.
Consensus sequences were called using samtools packages73: only high quality calls with a quality score of 30 or more were kept. The two sequences were uploaded on HaploGrep48,49 to assign the mitochondrial genome to known haplogroups and call mtDNA SNPs, followed by manual verification of each diagnostic variant.In order to reduce the loss of the information, the assemblies were subsequently visually inspected.
Network analysis.
The phylogenetic networks based on nucleotide variation in the whole mtDNA, were constructed using the Median Joining algorithm52 implemented in Network 5.0 program (http://www. fluxus-technology.com). The ε value was set to 0 and the transversions were weighted 3x the weight of transitions. Networks were subjected to maximum parsimony post-analysis.Approximate Bayesian Computation.
We implemented the ABC framework using the ABCsampler tool in the ABCToolbox package55. We simulated genetic data under three demographic models(conti-nuity, discontinuity and admixture, see Fig. 3, detailed in Supplementary Materials) with fastsimcoal2 (ver 2.5.2.21)74 and running 500,000 simulations per model. The prior distributions we considered are detailed in Supplementary Table S12. The modern Sardinian sample includes 63 sequences from Ogliastra75, the unique unbi-ased sample of Sardinian complete mitochondrial genomes available. As source of Neolithic variation we used 18 Middle Neolithic (6,500–5,000 BCE) and 28 Early Neolithic (7,300–6,200 BCE) sequences from Haak et al.50, that are the Early and Middle Neolithic samples with the highest quality (see Supplementary Materials and Supplementary Table S13). We placed ancient samples in the corresponding branch of the demographic model, at an average sampling time. To compare models we applied the Logistic Regression procedure59, considering different thresholds (i.e. number of retained simulations) to check the consistence oh the results. Model param-eters were estimated by a locally weighted multivariate regression53 after a logtan transformation76 of the 5,000 best-fitting simulations from a specific model. To calculate the posterior probabilities for models and parameters we used R77 scripts from http://code.google.com/p/popabc/source/browse/#svn%2Ftrunk%2Fscripts, modified by SG. We also estimated the power of our ABC procedure to correctly recognize the true model calculating for each model the proportion of true positives and false positives. We evaluated 1,000 random pseudo-observed data sets generated under each model, counting the number of times a specific model is correctly identified by the ABC procedure (true positives), and the number of times the same model is incorrectly selected as the true model (false positives). The PCA was made with the PCA function of the FactoMineR package77,78.
References
1. Grimaldi, M. C. et al. West Mediterranean islands (Corsica, Balearic islands, Sardinia) and the Basque population: contribution of HLA class I molecular markers to their evolutionary history. Tissue Antigens 58, 281–292 (2001).
2. Battaggia, C., Ruscitto, D., Destro-Bisol, G., Vacca, L., Calo, C. & Vona, G. Frequencies at CD4, FES, and F13A1 microsatellite loci in central-southern Sardinia (Italy). J Forensic Sci 48, 442 (2003).
3. Falchi, M. et al. A genomewide search using an original pairwise sampling approach for large genealogies identifies a new locus for total and low-density lipoprotein cholesterol in two genetically differentiated isolates of Sardinia. Am J Hum Genet 75, 1015–1031 (2004).
4. Di Gaetano, C. et al. Sardinians genetic background explained by runs of homozygosity and genomic regions under positive selection. PLoS One 9, e91237 (2014).
5. Barbujani, G., Bertorelle, G., Capitani, G. & Scozzari, R. Geographical structuring in the mtDNA of Italians. Proc Natl Acad Sci USA
92, 9171–9175 (1995).
6. Richards, M. et al. Tracing European founder lineages in the Near Eastern mtDNA pool. Am J Hum Genet 67, 1251–1276 (2000). 7. Falchi, A. et al. Genetic history of some western Mediterranean human isolates through mtDNA HVR1 polymorphisms. J Hum
Genet 51, 9–14 (2006).
8. Caramelli, D. et al. Genetic variation in prehistoric Sardinia. Hum Genet 122, 327–336 (2007).
9. Ghirotto, S., Mona, S., Benazzo, A., Paparazzo, F., Caramelli, D. & Barbujani, G. Inferring genealogical processes from patterns of Bronze-Age and modern DNA variation in Sardinia. Mol Biol Evol 27, 875–886 (2010).
10. Francalacci, P. et al. Peopling of three Mediterranean islands (Corsica, Sardinia, and Sicily) inferred by Y-chromosome biallelic variability. Am J Phys Anthropol 121, 270–279 (2003).
11. Capelli, C. et al. A 9-loci Y chromosome haplotype in three Italian populations. Forensic Sci Int 159, 64–70 (2006).
12. Contu, D., Morelli, L., Santoni, F., Foster, J. W., Francalacci, P. & Cucca F. Y-chromosome based evidence for pre-neolithic origin of the genetically homogeneous but diverse Sardinian population: inference for association scans. PLoS One 3, e1430 (2008). 13. Francalacci, P. et al. Low-pass DNA sequencing of 1200 Sardinians reconstructs European Y-chromosome phylogeny. Science 341,
565–569 (2013).
14. Cavalli-Sforza, L. L. & Piazza, A. Human genomic diversity in Europe: a summary of recent research and prospects for the future.
Eur J Hum Genet 1, 3–18 (1993).
15. Quintana-Murci, L., Veitia, R., Fellous, M., Semino, O. & Poloni, E. S. Genetic structure of Mediterranean populations revealed by Y-chromosome haplotype analysis. Am J Phys Anthropol 121, 157–171 (2003).
16. Pugliatti, M. et al. Evidence of early childhood as the susceptibility period in multiple sclerosis: space-time cluster analysis in a Sardinian population. Am J Epidemiol 164, 326–333 (2006).
17. Sidore, C. et al. Genome sequencing elucidates Sardinian genetic architecture and augments association analyses for lipid and blood inflammatory markers. Nat Genet 47, 1272–1281 (2015).
18. Barbujani, G. & Sokal, R. R. Genetic population structure of Italy. II. Physical and cultural barriers to gene flow. Am J Hum Genet 48, 398–411 (1991).
19. Zei, G. et al. From surnames to the history of Y chromosomes: the Sardinian population as a paradigm. Eur J Hum Genet 11, 802–807 (2003).
20. Fenu, P., Martini, F. & Pitzalis G. I siti paleolitici: i complessi industriali. Sa Pedrosa-Pantallinu. In: Sardegna paleolitica. Studi sul più
antico popolamento dell’isola. Museo Fiorentino di Preistoria “Paolo Graziosi” (eds Martini, F. E.). Centro Stampa 2P (1999).
21. Martini, F. Le facies clactoniane sarde nel quadro del Paleolitico inferiore peninsulare. In: Sardegna paleolitica. Studi sul più antico
popolamento dell’isola. Museo Fiorentino di Preistoria “Paolo Grazio (eds Martini, F. E.). Centro Stampa 2P (1999).
22. Martini, F. & Ulzega, A. L’insularità e i suoi effetti sul popolamento umano delle isole del Mediterraneo nel Pleistocene e nel primo Olocene. Riv Sci Preist 42, 271–288 (1989–1990).
23. Sondaar, P. Y. et al. Il popolamento della Sardegna nel tardo Pleistocene: nuova acquisizione di un resto fossile umano dalla grotta Corbeddu. Riv Sci Preist 45, (1993).
24. Sondaar, P. Y. et al. The human colonization of Sardinia: a Late-Pleistocene human fossil from Corbeddu Cave. C R Acad Sci Paris (Série IIa) 320, 145–150 (1995).
25. Spoor, F. The human fossils from Corbeddu Cave, Sardinia: a reappraisal. in: Elephants have a snorkel! (eds Reumer JWFDVs J., St. John). Deinsea (1999).
26. Lugliè, C. Il Mesolitico In: Atti della XLIV Riunione Scientifica dell’IIPP La preistoria e la protostoria della Sardegna, (Cagliari-Barumini-Sassari, 23-28 novembre 2009) (eds IIPP) (2009).
27. Floris, G. Sulla variabilità dell’indice nasale dei protosardi. Bollettino della Società Sarda di Scienze Naturali 21, 129–135 (1981). 28. Floris, G. La stautura nella protostoria sarda. Arch Antrop Etnol 113, 263–267 (1983).
29. Germanà, F. L’uomo in Sardegna dal Paleolitico all’Età nuragica. C. Delfino (1995).
30. Sanna, E., Liguori, A., Fagioli, M. B. & Floris, G. Verso una revisione dell’inquadramento cronologico e morfometrico delle serie scheletriche paleo-protosarde. II: Craniometria, ulteriori aggiornamenti. Arch Antrop Etnol 129, 239–250 (1999).
31. Sikora, M. et al. Population genomic analysis of ancient and modern genomes yields new insights into the genetic ancestry of the Tyrolean Iceman and the genetic structure of Europe. PLoS Genet 10, e1004353 (2014).
32. Fu, Q., Rudan, P., Paabo, S. & Krause, J. Complete mitochondrial genomes reveal neolithic expansion into Europe. PLoS One 7, e32473 (2012).
33. Skoglund, P. et al. Genomic diversity and admixture differs for Stone-Age Scandinavian foragers and farmers. Science 344, 747–750 (2014).
34. Gamba, C. et al. Genome flux and stasis in a five millennium transect of European prehistory. Nat Commun 5, 5257 (2014). 35. Lazaridis, I. et al. Ancient human genomes suggest three ancestral populations for present-day Europeans. Nature 513, 409–413
(2014).
36. Gunther, T. et al. Ancient genomes link early farmers from Atapuerca in Spain to modern-day Basques. Proc Natl Acad Sci USA 112, 11917–11922 (2015).
37. Bramanti, B. et al. Genetic discontinuity between local hunter-gatherers and central Europe’s first farmers. Science 326, 137–140 (2009).
38. Malmstrom, H. et al. Ancient DNA reveals lack of continuity between neolithic hunter-gatherers and contemporary Scandinavians.
Curr Biol 19, 1758–1762 (2009).
39. Lazaridis, I. et al. Genomic insights into the origin of farming in the ancient Near East. Nature 536, 419–424 (2016). 40. Sanchez-Quinto, F. et al. Genomic affinities of two 7,000-year-old Iberian hunter-gatherers. Curr Biol 22, 1494–1499 (2012). 41. Posth, C. et al. Pleistocene Mitochondrial Genomes Suggest a Single Major Dispersal of Non-Africans and a Late Glacial Population
Turnover in Europe. Curr Biol 26, 827–833 (2016).
42. Fu, Q. et al. The genetic history of Ice Age Europe. Nature (2016).
43. Lugliè, C. The Su Carroppu rock shelter within the process of Neolithization of Sardinia. In: Transitions en Méditerranée, ou comment
des chasseurs devinrent agriculteurs (ed^(eds) (2014).
44. Gassin, B. & Lugliè, C. Delle frecce per far cosa? In Atti della XLIV R.S. IIPP La preistoria e la protostoria della Sardegna. II, 485–493 (2012).
45. Maricic, T., Whitten, M. & Paabo S. Multiplexed DNA sequence capture of mitochondrial genomes using PCR products. PLoS One
5, e14004 (2010).
46. Sawyer, S., Krause, J., Guschanski, K., Savolainen, V. & Paabo S. Temporal patterns of nucleotide misincorporations and DNA fragmentation in ancient DNA. PLoS One 7, e34131 (2012).
www.nature.com/scientificreports/
48. van Oven, M. & Kayser, M. Updated Comprehensive Phylogenetic Tree of Global Human Mitochondrial DNA Variation. Hum
Mutat 30, 386–394 (2009).
49. Kloss-Brandstatter, A. et al. HaploGrep: a fast and reliable algorithm for automatic classification of mitochondrial DNA haplogroups.
Hum Mutat 32, 25–32 (2011).
50. Haak, W. et al. Massive migration from the steppe was a source for Indo-European languages in Europe. Nature 522, 207–211 (2015).
51. Olivieri, A. et al. Mitogenomes from two uncommon haplogroups mark late glacial/postglacial expansions from the near east and neolithic dispersals within Europe. PLoS One 8, e70492 (2013).
52. Bandelt, H. J., Forster, P., Sykes, B. C. & Richards, M. B. Mitochondrial portraits of human populations using median networks.
Genetics 141, 743–753 (1995).
53. Beaumont, M. A., Zhang, W. & Balding, D. J. Approximate Bayesian computation in population genetics. Genetics 162, 2025–2035 (2002).
54. Bertorelle, G., Benazzo, A. & Mona, S. ABC as a flexible framework to estimate demography over space and time: some cons, many pros. Mol Ecol 19, 2609–2625 (2010).
55. Wegmann, D., Leuenberger, C. & Excoffier, L. Efficient approximate Bayesian computation coupled with Markov chain Monte Carlo without likelihood. Genetics 182, 1207–1218 (2009).
56. Wegmann, D., Leuenberger, C., Neuenschwander, S. & Excoffier, L. ABCtoolbox: a versatile toolkit for approximate Bayesian computations. BMC Bioinformatics 11, 116 (2010).
57. Batini, C. et al. Large-scale recent expansion of European patrilineages shown by population resequencing. Nat Commun 6, 7152 (2015).
58. D’Amore, G., Di Marco, S., Floris, G., Pacciani, E. & Sanna, E. Craniofacial morphometric variation and the biological history of the peopling of Sardinia. Homo 61, 385–412 (2010).
59. Beaumont, M. Joint determination of topology, divergence time and immigration in population trees. McDonald Institute for Archaeological Research, 135–154 (2008).
60. Skoglund, P. et al. Origins and genetic legacy of Neolithic farmers and hunter-gatherers in Europe. Science 336, 466–469 (2012). 61. Pinhasi, R. et al. The genetic history of Europeans. Trends Genet 28, 496–505 (2012).
62. Rasteiro, R. & Chikhi, L. Female and male perspectives on the neolithic transition in Europe: clues from ancient and modern genetic data. PLoS One 8, e60944 (2013).
63. Abe-Sandes, K., Silva, W. A. Jr. & Zago, M. A. Heterogeneity of the Y chromosome in Afro-Brazilian populations. Hum Biol 76, 77–86 (2004).
64. Gonzalez-Andrade, F., Sanchez, D., Gonzalez-Solorzano, J., Gascon, S. & Martinez-Jarreta, B. Sex-specific genetic admixture of Mestizos, Amerindian Kichwas, and Afro-Ecuadorans from Ecuador. Hum Biol 79, 51–77 (2007).
65. Goncalves, V. F., Carvalho, C. M., Bortolini, M. C., Bydlowski, S. P. & Pena, S. D. The phylogeography of African Brazilians. Human
heredity 65, 23–32 (2008).
66. Stefflova, K. et al. Evaluation of group genetic ancestry of populations from Philadelphia and Dakar in the context of sex-biased admixture in the Americas. PLoS One 4, e7842 (2009).
67. Quintana-Murci, L. et al. Strong maternal Khoisan contribution to the South African coloured population: a case of gender-biased admixture. Am J Hum Genet 86, 611–620 (2010).
68. Dabney, J. et al. Complete mitochondrial genome sequence of a Middle Pleistocene cave bear reconstructed from ultra-short DNA fragments. Proc Natl Acad Sci USA 110, 15758–63 (2013).
69. Meyer, M. & Kircher, M. Illumina sequencing library preparation for highly multiplexed target capture and sequencing. Cold Spring
Harb Protoc 2010, pdb prot5448 (2010).
70. John, J. St. SeqPrep.(2011).
71. Li, H. & Durbin, R. Fast and accurate short read alignment with Burrows-Wheeler transform. Bioinformatics 25, 1754–1760 (2009). 72. Jonsson, H., Ginolhac, A., Schubert, M., Johnson, P. L. & Orlando, L. mapDamage2.0: fast approximate Bayesian estimates of ancient
DNA damage parameters. Bioinformatics 29, 1682–1684 (2013).
73. Li, H. et al. The Sequence Alignment/Map format and SAMtools. Bioinformatics 25, 2078–2079 (2009).
74. Excoffier, L., Dupanloup, I., Huerta-Sanchez, E., Sousa, V. C. & Foll, M. Robust demographic inference from genomic and SNP data.
PLoS Genet 9, e1003905 (2013).
75. Fraumene, C., Petretto, E., Angius, A. & Pirastu, M. Striking differentiation of sub-populations within a genetically homogeneous isolate (Ogliastra) in Sardinia as revealed by mtDNA analysis. Hum Genet 114, 1–10 (2003).
76. Hamilton, G., Stoneking, M. & Excoffier, L. Molecular analysis reveals tighter social regulation of immigration in patrilocal populations than in matrilocal populations. Proc Natl Acad Sci USA 102, 7476–7480 (2005).
77. R Core Team. R: A language and environment for statistical computing. R Foundation for Statistical Computing, Vienna, Austria. URL http://www.R-project.org/ (2013).
78. Lê, S., Josse, J. & Husson, F. FactoMineR: An R Package for Multivariate Analysis. Journal of Statistical Software 25, 1–18 (2008).
Acknowledgements
We thank Giuseppe Marasco for the help with the processing pipeline and the assembling of the datasets, Alessandro Achilli and Anna Olivieri for useful suggestions. G.B., S.G., F.T. and R.R.S. were supported by the ERC Advanced Grant Agreement No 295733, ‘LanGeLin’ project. C.L., A.M. and D.C. were supported by the L7/2007 CUP F71J09000060002 grant of the Regione Autonoma della Sardegna, ‘Storia del primo popolamento neolitico della Sardegna (VI-V millennio a.C.): origine e processi evolutivi alla luce dei dati archeologici, linguistici ed archeogenetici’ project. Research was also supported in part by PRIN 2010–2011 grant 2010EL8TXP_003 from the Italian Ministry of Education, University and Research (MIUR) assigned to D.C.
Author Contributions
D.C., S.G., A.M. and C.L. conceived the project. C.L. provided the samples. A.M., S.V., E.R. and M.L. designed the sequencing experiments. G.D.B. contributed reagents/materials for sequencing. G.G.F. provided the bioinformatic pipeline to process the data. A.M., F.T., R.R.S. and S.G. carried out data analysis. S.G., A.M., F.T. and G.B. wrote the manuscript. All authors read the manuscript and provided critical input.
Additional Information
Accession Codes: The accession numbers for the two mtDNA genome sequences reported in this paper are
Supplementary information accompanies this paper at http://www.nature.com/srep Competing financial interests: The authors declare no competing financial interests.
How to cite this article: Modi, A. et al. Complete mitochondrial sequences from Mesolithic Sardinia. Sci. Rep. 7, 42869; doi: 10.1038/srep42869 (2017).
Publisher's note: Springer Nature remains neutral with regard to jurisdictional claims in published maps and
institutional affiliations.
This work is licensed under a Creative Commons Attribution 4.0 International License. The images or other third party material in this article are included in the article’s Creative Commons license, unless indicated otherwise in the credit line; if the material is not included under the Creative Commons license, users will need to obtain permission from the license holder to reproduce the material. To view a copy of this license, visit http://creativecommons.org/licenses/by/4.0/