1 2 3 4 5 6 7 8 9 10 11 12 13 14 15 16 17 18 19 20 21 22 23 24 25 26 27 28 29 30 31 32 33 34 35 36 37 38 39 40 41 42 43 44 45 46 47 48 49 50 51 52 53 54 55 56 57
Non-Porous versus Mesoporous Siliceous Materials for CO
2
Capture
Chiara Vittoni,
[a]Giorgio Gatti,
[a]Geo Paul,
[a]Enzo Mangano,
[b]Stefano Brandani,
[b]Chiara Bisio,*
[a, c]and Leonardo Marchese
[a]In this study, the adsorption properties of a Stöber silica-based material towards CO2were evaluated for the first time. The use of Stöber silica as support is interesting for real technological applications mainly due to economic factors. Furthermore, a direct comparison between the non porous Stöber sample with an ordered porous material (based on MCM-41 silica) allowed to evaluate the effect of the porosity on the CO2 adsorption properties. In order to make silica materials reactive towards CO2, they were functionalized by introducing amino groups via grafting of
3-[2-(2-aminoethyl)aminoethyl]aminopropyltrime-thoxysilane. After a qualitative study of the CO2adsorption, the quantitative determination of CO2 adsorption capacity at 35°C revealed that the mesoporous material is more efficient compared to the Stöber-based one (adsorption capacity values of 0.49 and 0.58 mol/kg for Stöber-based and mesoporous samples). However, since the difference in the adsorption capacity is only about 15 % and the Stöber-based sample is considerably cheaper, the non-porous sample should be considered as a favourable adsorbent material for CO2capture applications.
1. Introduction
The carbon dioxide concentration in atmosphere is rapidly growing, reaching today the alarming value of about 410 ppm.[1]
This phenomenon, mainly due to anthropogenic causes, contributes to the increase of the Earth’s average temperature (Greenhouse Effect). In order to prevent a further increase of CO2 concentration in atmosphere, carbon capture and storage (CCS) technologies have attracted great attention in the past few years.[2]
Among the various CCS technologies, gas phase adsorption on solid adsorbents have been widely studied since it requires less energy compared to liquid absorption methods (i. e. the only commercially available methods), it is not associated with the production of any liquid waste and it is applicable to a wide range of temperatures.[3] Different types of ordered mesoporous siliceous materials have been investigated in literature as solid sorbents for CCS due to their structural and textural properties, such as large pore size,
high surface area, and large number of active sites on the surface.[4]
However, most of these ordered porous solids, such as MCM-41 and SBA-15 silicas, are quite expensive.[5]
For example, it was estimated that in amino-based MCM-41 or SBA-15 materials the cost of the mesoporous support accounts for more than 90 % over the total expense of the adsorbent (> $700/kg).[6]
The high cost is mainly due to the use of very expensive templates (i. e. Hexadecyltrimethylammonium chloride and Hexadecyltrimethylammonium bromide), neces-sary for the formation of the ordered structure of pores typical of these solids. Hence, using a less expensive support, the preparation cost of the adsorbent can be considerably reduced. To overcome these problems, in literature other types of silica have been studied as supports for carbon dioxide application. For example silica gel, a porous material produced on a large scale with a price less than $40/kg, has been investigated.[7]
In this context, Zhang et al. studied a sorbent consisting of polyethylenimine-impregnated silica gel. In their work, they found that the silica-gel-based material is a promising adsorb-ent for carbon dioxide capture due to its high adsorption capacity (CO2 adsorption capacity (q) at 75°C and 1 bar: 3.13 mmol/g), low-preparation cost and easy commercial avail-ability of the silica gel.[5]
So far, however, among the various low cost siliceous materials, monodisperse silica particles have not yet been considered in literature as solid supports for CO2 adsorption. The preparation of monodisperse silica spheres, for example using Stöber method, does not involve the use of any templates, and it is thus less expensive than that of ordered mesoporous solids.
Finally, a comparison of the carbon dioxide adsorption properties of Stöber silica particles (which are not characterized by a structural porosity, but present only inter-particle pores) with those of mesoporous ordered silica allows to investigate the effect of the porosity on the CO2capture performances. This aspect, fundamental for the comprehension of the carbon [a] Dr. C. Vittoni, Dr. G. Gatti, Dr. G. Paul, Prof. C. Bisio, Prof. L. Marchese
Dipartimento di Scienze e Innovazione Tecnologica and “Centro interdisci-plinare Nano-SiSTeMI”
Università del Piemonte Orientale via T. Michel 11, 15121 Alessandria, Italy. E-mail: [email protected]
[b] Dr. E. Mangano, Prof. S. Brandani
Scottish Carbon Capture and Storage, School of Engineering University of Edinburgh
Mayfield Road, Edinburgh, EH9 3JL, U.K. [c] Prof. C. Bisio
ISTM-CRN Istituto di Scienze e Tecnologie Molecolari via G. Venezian 21, 20133 Milano, Italy
Supporting information for this article is available on the WWW under https://doi.org/10.1002/open.201900084
©2019 The Authors. Published by Wiley-VCH Verlag GmbH & Co. KGaA. This is an open access article under the terms of the Creative Commons Attribution Non-Commercial NoDerivs License, which permits use and dis-tribution in any medium, provided the original work is properly cited, the use is non-commercial and no modifications or adaptations are made.
13 14 15 16 17 18 19 20 21 22 23 24 25 26 27 28 29 30 31 32 33 34 35 36 37 38 39 40 41 42 43 44 45 46 47 48 49 50 51 52 53 54 55 56 57
based materials. A sample with micrometric particle size comparable to those of the Stöber silica particles was chosen among others MCM-41. Unlike the Stöber silica, as it is well known, MCM-41 sample presents an ordered array of pores. The carbon dioxide adsorption properties of the organo-modified silica samples were analyzed by the use of different techniques. First of all, FT-IR and ss-NMR spectroscopies were used to study both physisorption and chemisorption processes occurring by contacting CO2 and the functionalized samples. Furthermore, quantitative TGA and Zero Length Column techniques were used to quantify the CO2adsorption capacity of the materials.
2. Results and Discussion
2.1. Physico-Chemical Characterization of the Sorbents
The morphology of silica samples was studied by using scanning electron microscopy (SEM) and transmission electron microscopy (TEM). The obtained micrographs are reported in Figure 1.
Stöber silica (Figure 1A) is made of spherical particles with micrometric size with a mean diameter of ca. 800 nm. The histogram reported in the insert (Figure 1A’), obtained by analyzing around 250 particles, shows that the particle diameter is in the range between 650 and 900 nm. The polydispersity index (P.I.), expressed by the relative standard deviation of the diameter, is 0.22 (for particles perfectly monodisperse P.I. = 0, while polydispersity yields higher P.I. values).[10,11]On the other hand, the MCM-41 silica sample (Figure 1B) is composed by micrometric particles with a mean diameter of about 200– 300 nm and presents the typical ordered arrangement of pores.[12]
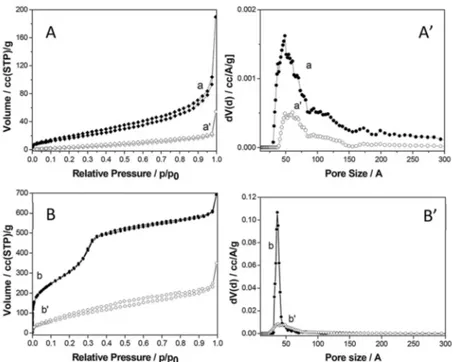
The textural properties of Stöber and MCM-41 silica samples and the relative functionalized materials were determined by using a N2 physisorption analysis at 196°C. N2 adsorption-desorption isotherms and pore size distribution are reported in Figure 2.
The adsorption isotherms of the Stöber silica sample (Fig-ure 2A, curve a) is of type II (IUPAC classification), typical of non-porous solids, and presents a thin hysteresis loop of H1 type in a wide range between 0.2 and 0.9 p/p0. This type of hysteresis loop, due to aggregation porosity, is often obtained with materials consisting of approximately uniform spheres agglomerates.[13] MCM-41 sample instead (Figure 2B, curve b)
show type IV adsorption isotherm, indicating the presence of structural ordered mesoporosity in the sample.[14]
After the functionalization procedure both samples show a different isotherm (Figure 2A, 2B curves a’, b’) and, in particular, the volume of adsorbed N2in the grafted materials is decreased, due to the introduction of aminosilane species on the silica surface.
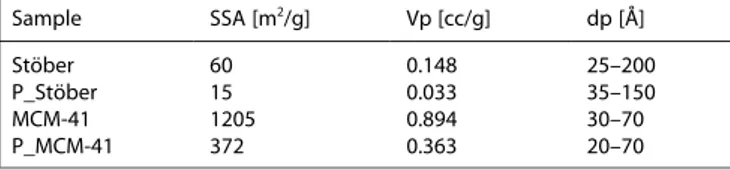
The Brunauer Emmett Teller (BET) model was used to estimate the specific surface area of the materials (Table 1) that
was determined to be 60 and 15 m2/g, respectively for Stöber and P_Stöber samples. The reduction of specific surface area of P_Stöber sample compared to the bare one (about 75 %) is due to the presence of the organic chains on the surface that reduce the aggregation porosity, as clearly seen in the pore size distribution determined by using the NLDFT method and the desorption branch of the isotherm. This graph (Figure 2A’, a) shows that inter-particle pores with size between 25 and 200 Å
Figure 1. SEM micrograph (Frame A) and particle size distribution (Frame A’)
of Stöber silica sample. TEM micrograph of MCM-41 silica sample (Frame B).
Table 1. Specific Surface Area, pores volume and particle diameter of the
considered samples obtained from N2Physisorption analysis.
Sample SSA [m2/g] Vp [cc/g] dp [Å]
Stöber 60 0.148 25–200
P_Stöber 15 0.033 35–150
MCM-41 1205 0.894 30–70
1 2 3 4 5 6 7 8 9 10 11 12 13 14 15 16 17 18 19 20 21 22 23 24 25 26 27 28 29 30 31 32 33 34 35 36 37 38 39 40 41 42 43 44 45 46 47 48 49 50 51 52 53 54 55 56 57
(maximum at around 50 Å) characterizes the Stöber silica sample. After the grafting (Figure 2A’, a’), the porous volume decreases due to the presence of PAPTS chains: the smaller pores, between 25 and 40 Å, are especially affected by the grafting procedure. The specific surface area values for MCM-41 and P_MCM-41 are 1205 and 372 m2
/g, respectively. The decreasing of the specific surface area of the grafted sample (ca. 69 %) can be attributed to the presence of the organic chains that limit the access to the structural pores. This is also confirmed by the pore size distribution, centred at 37 Å (Figure 2B’): after the grafting procedure, the pore volume strongly decreased, suggesting that the access of the into the pores is limited by the presence of the organosilane.
The presence of the PAPTS on the surface of both Stöber and MCM-41 samples was monitored by infrared spectroscopy. Spectra of the samples before and after the grafting are reported in Figure 3. The FT-IR spectrum of the Stöber silica sample (Figure 3A, curve a) shows a broad band with maxima at 3690 and 3525 cm 1, due to the stretching modes of different family of H-bonded OH groups.[15]
Moreover, bands in the 3000– 2800 cm 1 range are due to the stretching modes of CH
2 species deriving from incompletely reacted TEOS.[16]In the low frequency region, the spectrum shows bands at 1980 and 1865 cm 1, due to the overtones and combination modes of the silica framework.[17]After the functionalization (Figure 3A, curve a’), new bands of surface silanols are found at lower wave-numbers, thus indicating an interaction between OH and amino groups of the PAPTS chains.
Moreover, the infrared spectrum of the grafted sample is characterized by the presence of components at 3370 and 3303 cm 1 due to the asymmetric and symmetric stretching modes of amino groups, respectively; the associated bending
mode falls at 1602 cm 1.[12] The band at 1648 cm 1 instead is due to the stretching mode of the NH groups of PAPTS
Figure 2. Nitrogen adsorption-desorption isotherms at – 196°C and relative pressures (p/p0) from 1*10 7to 1 (Frames A, B) and pore size distribution
determined by NLDFT methods (Sections A’, B’) of Stöber (a), P_Stöber (a’), MCM-41 (b) and P_MCM-41 (b’) samples.
Figure 3. FT-IR spectrum of A) Stöber (curve a) and P_ Stöber (curve a’)
silicas and B) MCM-41 (curve a) and P_MCM-41 samples (curve a’). Spectra were recorded after outgassing of the samples for 1 h.
13 14 15 16 17 18 19 20 21 22 23 24 25 26 27 28 29 30 31 32 33 34 35 36 37 38 39 40 41 42 43 44 45 46 47 48 49 50 51 52 53 54 55 56 57 molecule.[17] In addition, in the 3000–2800 cm 1
range are also present bands due to stretching modes of CH2 groups of the silane grafted onto the silica surface; one of the associated bending modes is found at 1467 cm 1
.[18]
The FT-IR spectrum of the bare MCM-41 silica sample (Figure 3B, curve a) shows in the high frequency range a sharp band at 3745 cm 1due to isolated SiOH groups and a broad absorption in the 3700–3000 cm 1 region (bands at ca. 3650 and 3500 cm 1) due hydrogen-bonded OH groups weakly interacting with each other.[18]After the grafting procedure (Figure 3B, curve a’) the bands due to surface silanols, both isolated and hydrogen-bonded, are strongly decreased in intensity. This effect is due to the fact that these species react with the grafted organic chain and are hydrogen bonded with the PAPTS amino groups. This inter-action is visible also by observing the broad adsorption between 3500 and 2000 cm 1, due to the occurrence of strong H-bonds between the silanols and the PAPTS amino groups.[12] This effect is not visible for P_Stöber sample, probably because PAPTS groups grafted only on the external surface and they are less prone to interact with the silanols. Moreover, the stretching and bending vibrations related to PAPTS chains (vide supra) are also visible.
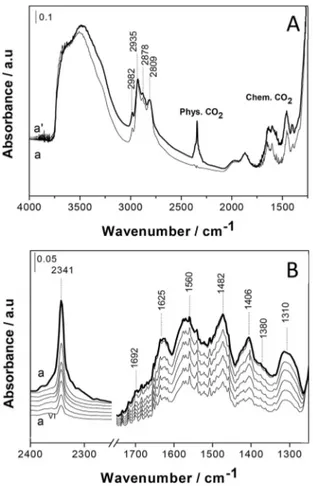
The interactions between CO2and the organo-modified Stöber silica sample have been evaluated by using infrared spectro-scopy of adsorbed carbon dioxide. FT-IR spectra after the admission of 60 mbar of CO2at 35°C on the organo-modified Stöber silica samples are reported in Figure 4.
After the admission of carbon dioxide the infrared spectrum of P_ Stöber sample (Figure 4 A, curve a’) the large band between 3500 and 3000 cm 1
and between 3000 and 2500 cm 1
are shifted at lower frequencies, owing to the interaction of the silica surface (silanol groups and organic chain grafted on the surface) with carbon dioxide. Moreover, bands due to both physical and chemical adsorption of CO2are visible. In particular, at 2341 cm 1
a band due to the asymmetric stretching mode of physisorbed CO2 is observed, whereas bands due to products of the chemical reaction between NH2 and carbon dioxide are located in the region between 1750 and 1250 cm 1
.[19,20,21]
In order to better appreciate these bands, spectra obtained after the subtraction of the spectrum recorded before the CO2admission are reported in Figure 4B. In the low frequency region (in which absorptions of chemisorbed species fall), bands due to the formation of both carbamate and carbamic acid are observable. In particular, bands due to ammonium carbamate species are visible at 1560, 1482 and 1406 cm 1
, while bands due to carbamic acid are located at 1692 and 1380 cm 1
(a detailed description of the assignation of these bands is reported in a previous publication).[8] Furthermore, the band at 1625 cm 1
is ascribed to the bending of NH3
+
species deriving from the interaction of amino groups with carbamic acid,[19]while the band at 1310 cm 1is attribute to skeletal vibrations of NCOO species.[22]
By decreasing progressively the CO2 pressure (Figure 4B, curves aI–aVI) bands related to both physisorbed and chemisorbed CO2decrease in intensity. In particular, bands due to physically adsorbed CO2 decrease faster, as the involved bonds are weaker. In order to evaluate the differences in terms of CO2adsorption on the two hybrid samples, a comparison between P_ Stöber and P-MCM-41 spectra after the admission of carbon dioxide is reported in Figure 5. Physisorbed CO2(Figure 5, band at 2341 cm 1) is much more abundant in P_Stöber sample compared to P_MCM-41. This result was unexpected, because the Stöber silica sample does not exhibit structural porosity. Such large adsorption, however, can occur in the porosity formed by the aggregation of the monodisperse silica particles. Moreover, regarding the chemisorption region, the bands related to the formation of carbamates and carbamic acid (Figure 5, curves a and b) are
Figure 4. Frame A: FTIR spectra in the 4000–1250 cm-1 region of P_Stöber
before (curve a) and after (curve a’) the admission of 60 mbar of CO2at 35°C.
Spectra are reported after subtraction of the spectrum of gaseous CO2.
Frame B: FTIR spectra, in the 2400–1250 cm 1region, of CO
2adsorbed
(Pmax=60 mbar) at 35°C on P_Stöber (a–aVI). Spectra are reported after
subtraction of the spectrum recorded before CO2interaction and after the
1 2 3 4 5 6 7 8 9 10 11 12 13 14 15 16 17 18 19 20 21 22 23 24 25 26 27 28 29 30 31 32 33 34 35 36 37 38 39 40 41 42 43 44 45 46 47 48 49 50 51 52 53 54 55 56 57
more intense for P_MCM-41 with respect to P_Stöber sample, thus indicating that a greater amount of ammonium carba-mates and carbamate acids species are present in the mesoporous ordered sample. This effect is probably due to the highest amount of PAPTS groups present in the mesoporous sample. At the end of the desorption process (Figure 5, curves a’, b’), the bands due to chemisorbed species are still observable in in P_MCM-41 sample, whereas in P_Stöber are not visible. This result suggests a difference on the stability of ammonium carbamate and carbamic acid species due to the location of NH2 groups in the solid sorbents. In P_MCM-41 sample, the amino groups are indeed located into the pores, while in Stöber sample, since is non porous, NH2 groups are mainly present on the external surface. For this reason, the carbamate species formed on this sample are non confined in restricted space and less protected in comparison to the P_ MCM-41 sample.
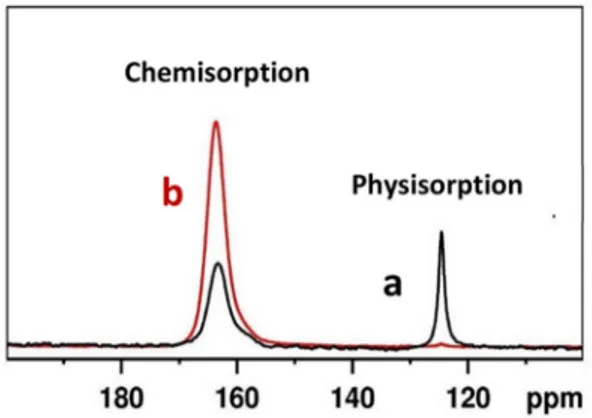
The comparison of 13
CO2 adsorption process on the two hybrid materials was further studied by using 13
C MAS NMR spectroscopy (Figure 6).
13
C MAS NMR spectrum of P_Stöber sample (Figure 6, curve a) shows a peak due to chemisorbed carbamate species centered at 164 ppm and a peak related to the physisorbed 13
CO2 located at around 125 ppm. Quantitative data derived from the13
C MAS NMR spectra of P_Stöber sample show that the amount of13
CO2physically adsorbed represent about 30 wt %, while the remaining part is due to the contribution from chemisorbed species. These quantitative data confirm that the physisorption in P_Stöber sample contribute higher compared to that in P_MCM-41 (less than 1 % of total adsorption) as shown in Figure 6, curve b. This effect is probably due to the higher pore accessibility and the presence of mesoporosity in P_Stöber sample. In order to determine the influence of amino groups on the physisorption in P_Stöber sample, we have followed the CO2 adsorption on bare Stöber sample (without amino groups) by employing FT-IR spectroscopy (Figure 7).
As expected, for bare Stöber sample (Figure 7, curve b) no bands attribute to chemisorbed CO2 are observable. Only a small band at 2341 cm 1
, due to the physisorbed carbon dioxide, is visible. This band is much less intense compared to P_Stöber sample (curve a), suggesting that PAPTS chains grafted on the surface can aggregate forming pores in which the physisorption occurs. We may suggest that this porosity presents a small volume, that is hardly detectable by N2 physisorption technique. As for chemisorption, as expected, no bands are formed; this is due to the absence of amino groups in this sample.
To confirm these observations,13C MAS NMR spectroscopy of adsorbed carbon dioxide on bare Stöber sample has been performed. Results are reported in Figure 8.
In13C MAS NMR spectrum of bare Stöber sample (Figure 8, curve b), the signal of physisorbed13CO
2, located at 125 ppm, is not easily distinguishable from the background noise, indicating that only an exceedingly small amount of 13CO
2 is physically adsorbed on the bare sample. Therefore, we can confirm that the PAPTS chains grafted on the Stöber silica surface are
Figure 5. FTIR spectra of 60 mbar of carbon dioxide adsorbed at 35°C on P_ Stöber (curve a) and P_MCM-41 (curve b) and FT-IR spectra recorded after degassing CO2until vacuum (curve a’ and b’, respectively for P_Stöber and
P_MCM-41). Spectra are reported after subtraction of the spectrum recorded before CO2interaction, used as a background.
Figure 6.13C MAS NMR spectra of13CO
2adsorbed on P_Stöber (a) and P_
MCM-41 (b), recoded using a MAS rate of 10 kHz.
Figure 7. FTIR spectra of 60 mbar of CO2adsorbed at 35°C on P_Stöber
(curve a) and Stöber sample (curve b) and FT-IR spectra recorded after the degassing (curve a’ and b’, respectively for P_Stöber and Stöber sample). Spectra are reported after subtraction of the spectrum recorded before CO2
13 14 15 16 17 18 19 20 21 22 23 24 25 26 27 28 29 30 31 32 33 34 35 36 37 38 39 40 41 42 43 44 45 46 47 48 49 50 51 52 53 54 55 56 57
responsible for the gated porosity, where the physisorption occurs.
2.3. Evaluation of CO2Capture Capacity of Hybrid Stöber
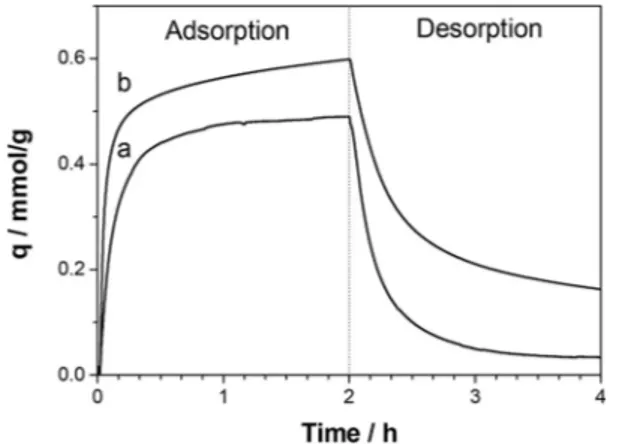
The carbon dioxide adsorption capacity was evaluated by gravimetric analysis. CO2 uptake curve at 35°C of P_Stöber sample, compared with that of MCM-41, is reported in Figure 9. The CO2adsorption capacity (q) of P_Stöber sample derived from gravimetric adsorption curve (Figure 9, curve b) is 0.49 mmol/g. This value is slightly lower compared to the CO2 adsorption capacity of P_MCM-41 (0.58 mmol/g). Moreover, the shape of the adsorption curves of the two samples is different. In detail, the diverse adsorption/desorption rate of P_Stöber compared to P_MCM-41 sample suggest that a different predominant adsorption process occurs. In P_MCM-41 sample, in fact, there is a faster initial uptake compared to P_Stöber sample, followed by a slower approach to the final equilibrium. This effect is probably due to the more heat released, thus indicating that a higher contribution of chemisorption is present. Furthermore, at the end of the desorption curve, different amount of CO2 (representing the irreversible fraction
the DSC. Details on calculations are given in earlier publications.[12]
The~HAdsvalues obtained for P_Stöber and P_
MCM-41 samples are 33.2 and 52.9 kJ/mol, respectively (Heat Flow graph from DSC-TGA is reported in Supporting Informa-tion, Figure S.I.1), thus confirming that the predominant mech-anism occurring in the non porous material is physisorption.
The gravimetric method was also used to study the temper-ature dependence (20-90°C) of the CO2 adsorption process (Figure S.I.2 and S.I.3 in Supporting Informations). For both samples the gas uptake after 2 h of adsorption decreases with the increase of the temperature. The behavior of these samples with the temperature however is complex, and therefore deserves to be explored in a future dedicated study.
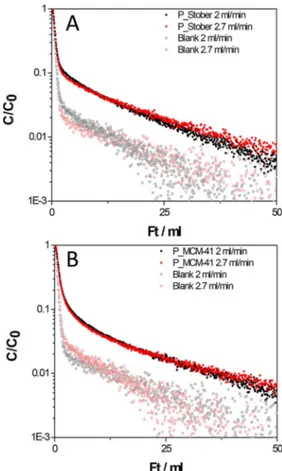
The quantitative determination of adsorbed carbon dioxide was also performed by using the ZLC analysis. Desorption curves as C/C0(dimensionless concentration) versus the volume of gas eluted (flow rate × time) obtained for P_Stöber and P_ MCM-41 at 35°C are reported in Figure 10.
The difference between the area under the desorption curve of the sample and the blank (Figure 10) is proportional to the amount of adsorbed CO2. Consequently, applying a mass balance on the column, the uptake can be calculated by integration of the obtained signals. The carbon dioxide adsorption capacity values calculated from ZLC desorption curves are 0.40 and 0.51 mmol/g for P_Stöber and P_MCM-41, respectively. These data reflect the behaviour observed by TGA analysis. These adsorption capacity values are only slightly lower than those obtained by gravimetric analysis (0.49 and 0.58 mmol/g for P_Stöber and P_MCM-41, respectively) prob-ably due to a degradation occurred in the samples (ZLC analysis in fact was the last experiment conducted). Even if the ordered mesoporous-based material has a higher adsorption capacity compared to the non-porous one, it must be considered that that difference is not very large (about 15 %), and can be more quickly and easily synthesized compared to the mesoporous sample. In addition, the adsorption mechanism in the P_Stöber sample is essentially dominated by physisorption. For that reason, the sample is characterised by a lower heat of adsorption and a faster uptake than the P_MCM-41 sample. These are both desirable features to have faster adsorption cycles. For these reasons, we think that the Stöber-based sample deserve interest for potential applications in the carbon capture field.
Figure 8. C MAS NMR spectra of CO2adsorbed on P_Stöber (a) and Stöber
sample (b). The spectrum of Stöber sample (curve b) has been amplified (x5) for a better observation of the signals.
Figure 9. CO2uptake curves obtained from TGA of P_Stöber (curve a) and P_
MCM-41 (curve b) silica samples. Measurements were recorded at 35°C and 1 bar with 0.1 bar of CO2in He.
1 2 3 4 5 6 7 8 9 10 11 12 13 14 15 16 17 18 19 20 21 22 23 24 25 26 27 28 29 30 31 32 33 34 35 36 37 38 39 40 41 42 43 44 45 46 47 48 49 50 51 52 53 54 55 56 57
3. Conclusions
In this work, the CO2adsorption properties of amino-functional-ized Stöber silica sample have been evaluated for the first time by using a combined experimental techniques. In particular, FT-IR and ss-NMR spectroscopies were used to provide information on the physical and chemical adsorption processes occurring by contacting CO2with the non-porous Stöber silica-based hybrid material. These analyses showed that a higher amount of physisorbed CO2as present in the Stöber-amino-functionalized sample, whereas almost negligible carbon dioxide (either physisorbed or chemisorbed) was observed in bare Stöber sample. From these studies it has emerged that the generation of gated microporosity upon PAPTS grafting on Stöber silica surface is responsible for the larger amount of CO2physisorbed. Moreover, the effect of the gated porosity on the carbon dioxide adsorption has been evaluated by comparing the organo-modified Stöber with a MCM-41-based material. The comparison of FT-IR and ss-NMR results show that higher amount of physisorbed CO2 is present in the Stöber-based sample compared to the MCM-41- based one, probably because of the higher pore accessibility and because of the presence of mesoporosity created by PAPTS aggregation (absent in P_MCM-41 sample). With regard to chemisorption, conversely, the higher amount of CO2 chemisorbed was observed in the
ordered mesoporous sample. This effect is probably due to the presence of greater amount of PAPTS groups in this material (the nitrogen adsorption on the samples is 2.25 and 3.67 mmol/ g for P_Stöber and P_MCM-41 samples, respectively).
The absolute carbon dioxide capture capacity has been determined by TGA and ZLC analyses. The values of CO2 adsorption capacity obtained are 0.49 and 0.58 mol/kg (TGA) and 0.40 and 0.51 mol/kg (ZLC), respectively for P_Stöber and P_MCM-41 samples. Therefore, taking into account of the adsorption process as a whole (i. e. with respect to both physisorption and chemisorption), the ordered mesoporous-based material is slightly more efficient. However, the non-porous material is much cheaper, easy to synthesize, and an adsorption capacity not very different to that of MCM-41-based material. For this reason, non-porous materials such as P_ Stöber, not explored until now for CO2capture, deserves special attention and should be considered among the various other solid adsorbents for the carbon dioxide capture.
Experimental Section
Materials Preparation
Stöber silica was synthesized by hydrolysis and condensation of tetraethylorthosilicate (TEOS) catalyzed by ammonia. In a typical synthesis, a solution of 3.0 mL of aqueous ammonia, 7.28 mL of water and 50 mL of ethanol have been prepared. Subsequently, 5.6 mL of TEOS were added, and the solution was stirred for 2 hours at room temperature. The ethanol solution was then evaporated at 60°C for 5 hours and finally the precipitate was dried at 80°C for 2 hours.[23]The sample was named Stöber.
MCM-41 silica was synthesized by dissolving cetyl trimethylammo-nium bromide CTAB, 15.12 g, Sigma Aldrich, � 98 %) in 38 mL of deionized water and then heating the solution at 50°C. Tetrame-thylammonium hydroxide (TMAOH, 8.94 mL, Sigma-Aldrich) was then added, and after 30 minutes silica fumed (5.0 g, Aldrich, 99.8 %) was introduced. After 1 h the gel was transferred in a Teflon cup (125 mL capacity) of an autoclave (Anton PAAR 4748) and heated in an oven at 120°C for 72 h. After the hydrothermal treatment, the sample was filtered, washed with deionized water and dried overnight at 120°C. The material was calcined under air flow at 600°C for 5 h (1°C/min heating ramp) in order to remove completely the CTAB surfactant.[24]The sample was named MCM-41.
Post Synthesis Functionalization.
Before the grafting procedure, 1.0 g of silica (Stöber or MCM-41) was treated in vacuum at 200°C for 2 h in order to remove physisorbed water. After this treatment, the sample was kept under N2 flow and then dispersed in 100 mL of anhydrous toluene containing 0.48 mL of N-[3-(trimethoxysilyl)propyl]-diethylenetri-amine (PAPTS, (H2N(CH2)2NH(CH2)2NH(CH2)3Si(OCH3)3, Sigma-Aldrich, M.W. = 265.43 g/mol) added drop-by-drop. Then the suspension was left for 20 h at 50°C under magnetic stirring. After this time, the sample was filtered, washed with toluene and ethyl ether in order to remove the unreacted silane, and finally dried overnight at 80°C.[25]The functionalized samples are hereafter named P_Stöber and P_MCM-41.
Figure 10. ZLC desorption curves for P_Stöber (section A) and P_MCM-41
sample (section B) and blank curves at 2 and 2.7 ml/min flow rates. CO2
13 14 15 16 17 18 19 20 21 22 23 24 25 26 27 28 29 30 31 32 33 34 35 36 37 38 39 40 41 42 43 44 45 46 47 48 49 50 51 52 53 54 55 56 57
using a JEOL 2010 High Resolution Transmission Electron Micro-scope operating at 300 kV. Specimens were prepared by sonicating the sample in isopropanol and by depositing a drop of the suspension on carbon-coated grids.
N2Physisorption Analyses
N2 physisorption analyses were carried out at low temperature ( 196°C) by using a Quantachrome Autosorb iQ2 instrument. Before the analysis, the samples were outgassed at 135°C for 3 h (residual pressure: 10 6Torr). Specific Surface Area (S.S.A) values were calculated by using the Brunauer-Emmett-Teller equation, in the residual pressure range from 0.01 to 0.1 p/p0. Pore size distributions were determined by applying the Non Localized Density Functional Theory (NLDFT) method (N2silica kernel based on a cylindrical pore model).
Elemental Analysis
C H N elemental contents were determined by using an EA 3000 elemental analyser (EuroVector). He and O2 at 120 and 35 kPa pressures were used, respectively.
Infrared Spectra
Infrared spectra were collected on a Thermo Electron Corporation FT Nicolet 5700 Spectrometer (resolution: 4 cm 1). Self-standing pellets were placed into an IR cell with KBr windows permanently attached to a vacuum line (residual pressure: 10 4mbar), allowing all treatments and adsorption–desorption experiments to be carried out in situ. Before the gas adsorption tests, the silica samples were outgassed at 135°C (heating ramp: 5°C min 1, holding: 3 h) by using an oil-free apparatus and a grease-free vacuum line. After-wards the samples were cooled at room temperature for the collection of IR spectra upon CO2adsorption. All the spectra were normalized by dividing for the density of the self-supported pellets. Furthermore, the proper normalization of the IR spectra was verified taking as reference the intensity of the overtones and combination modes of the silica framework (bands in the 2200–1600 cm 1 range). In this way, differences in the band intensities among different samples related to intrinsic oscillators of the materials (e. g. hydroxyl groups) can be associated with actual differences in the amount of such species in the samples. As a consequence of the normalization, the absorbance values are reported as the arbitrary unit (a.u.).
Solid State NMR
Solid state NMR spectra were acquired on a Bruker Avance III 500 spectrometer and a wide bore 11.7 Tesla magnet with operational
to increase the C NMR signal intensity.
Zero Length Column
The Zero Length Column (ZLC) consists of a 1/8’’ Swagelok union in which a small amount of sample (about 10–15 mg) is housed between two sister discs.[27]This system can be modified allowing more samples to be packed in the adsorption column (about 20– 40 mg) obtaining an Extended Zero Length Column (E-ZLC). In this system, used for all the analyses reported below, a 1/8’’ Swagelok bulkhead connector is used, allowing the utilization of the same apparatus developed for the standard ZLC experiment.[28] The experiment is based on following the desorption curve of a sample previously equilibrated with a feed gas mixture (10 % CO2in He) at a constant flow rate (2 and 2.7 ml min 1). In order to determine the equilibration time of the samples, tests at increasing adsorption times were carried out. The sample was considered at equilibrium when the adsorbed amount of CO2did not change any more with the adsorption time (equilibration time 20 min for P_Stöber and 30 min for P_MCM-41 sample). Prior to each experiment the samples were regenerated overnight at 135°C under helium flow in order to ensure the removal of any pre-adsorbed water. In addition, due to the very small amount of sample used, the system is equipped with drying columns to ensure that the gases entering the system are completely dry. The effluent gas concentration is monitored using a Dycor Ametek Benchtop quadrupole mass spectrometer connected to the outlet of the column. Full details of the system used for these experiments are given in an earlier publication.[29]
Gravimetric Analysis
Gravimetric CO2adsorption measurements were carried out on a Setaram Sensys Evo TG/DSC apparatus. In these experiments, a sample mass of about 20–30 mg was packed in a platinum crucible, which was counterbalanced by an identical platinum crucible packed with an equivalent mass of lead beads. Prior the measure-ments the sample was pretreated at 135°C for 3 h (2°C min 1 heating rate) under He flow (flow rate: 50 ml min 1). The sample was then cooled to 35°C and the adsorption was performed by contacting the sample with a mixture of 10 % of CO2 in He at a constant total flow rate of 50 ml min 1 for 2 h. The CO
2 concen-tration and the adsorption time were chosen to be representative of a typical post combustion capture process from a coal-fired power plant. At the end of the adsorption step the inlet flow is then switched to pure He at the same flow rate for 2 h, in order to allow the desorption of CO2. In the case of a purely physisorption process, assuming that equilibrium has been achieved and no transport resistances are present, the change in the sample weight in the adsorption and desorption step should be the same, indicating a perfectly reversible process. From the measure of the
1 2 3 4 5 6 7 8 9 10 11 12 13 14 15 16 17 18 19 20 21 22 23 24 25 26 27 28 29 30 31 32 33 34 35 36 37 38 39 40 41 42 43 44 45 46 47 48 49 50 51 52 53 54 55 56 57
mass difference and the heat flow the CO2capture capacity and the heat of adsorption were also calculated.[30]
Acknowledgements
The authors are fully grateful to Mrs. Chiara Zaccone for her help in the physico-chemical characterization of silica samples and to Dr. Claudio Evangelisti (ISTM-CNR, Milan) for TEM measuments. Authors also acknowledge the financial support by the Italian Minister of Education, University and Scientific Research (MIUR) through the PRIN Project 2010 A2FSS9.
Conflict of Interest
The authors declare no conflict of interest.
Keywords: CO2Adsorption · hybrid materials · ss-NMR · Stöber silica · silica materials
[1] https://www.co2.earth/
[2] S. Cui, W. Cheng, X. Shen, M. Fan, A. Russell, Z. Wu X. Yi, Energy Environ. Sci. 2011, 4, 2070–2074.
[3] Wang, L. Huang, R. Yang, Z. Zhang, J. Wu, Y. Gao, Q. Wang, D. O’Hareb, Z. Zhong, Energy Environ. Sci. 2014, 7, 3478–3518.
[4] S. Choi, J. H. Drese, C. W. Jones, ChemSusChem 2009, 2, 9, 796–854. [5] Z. Zhang, X. Ma, D. Wang„ C. Song, AIChE J. 2012, 58, 8, 2495–2502. [6] M. G. Plaza, C. Pevida, A. Arenillas, F. Rubiera, J. J. Pis, Fuel 2007, 86, 14,
2204–2212.
[7] O. Leal, C. Bolìvar, Cèsar Ovalles, J. J. Garcia, Y. Espidel, lnorganica Chimica Acta 1995, 240, 1–2, 183–189.
[8] G. Gatti, D. Costenaro, C. Vittoni, G. Paul, V. Crocellà, E. Mangano, S. Brandani, S. Bordiga, M. Cossi, L. Marchese, C. Bisio , Phys. Chem. Chem. Phys. 2017, 19, 14114–14128.
[9] C. Y. Yoo, L. C. Lee, C. W. Jones, Langmuir 2015, 31, 49, 13350–13360. [10] N. Plumerè, A. Ruff, B. Speiser, V. Feldmann, H. A. Mayer , J. Colloid
Interface Sci. 2012, 368, 1, 208–219.
[11] C. Vittoni, V. Sacchetto, D. Costenaro, S. Mastroianni, A. Hinsch, L. Marchese, C. Bisio, Sol. Energy 2016, 124, 101–113.
[12] G. Gatti, C. Vittoni, D. Costenaro, G. Paul, E. Mangano, S. Brandani, L. Marchese, C. Bisio, Phys. Chem. Chem. Phys. 2017, 19, 29449–29460. [13] Z. Wu, H. Xiang, T. Kim, M.-S. Chun, K. Lee, J. Colloid Interface Sci. 2006,
304, 1, 119–124.
[14] S. Lowell, J. E. Shields, M. A. Thomas, M. Thommes, Kluwer Academic Publishers 2004.
[15] A. Beganskiene, V. Sirutkaitis, M. Kurtinaitiene, R. Juskenas, A. Kareiva, Mater. Sci. 2004, 10, 4, 287–290.
[16] M. Pàlmai, L. N. Nagy, J. Mihàly, Z. Varga, G. Tàrkànyi, R. Mizsei, I. C. Szigyàrtò, T. Kiss, T. Kremmer, J. Colloid Interf. Sci. 2013, 390, 1, 34–40. [17] C.-Y. Chen, H.-Y. Li, M. E. Davis, Microporous Mater. 1993, 2, 1, 17–26. [18] G. Socrates, John Wilway & Sons, LTD, 2001.
[19] X. Wang, W. Schwartz, J. C. Clark, X. Ma, S. H. Overbury, X. Xu, C. Song, J. Phys. Chem. C 2009, 113, 17, 7260–7268.
[20] A. Danon, P. C. Stair, E. Weitz, J. Phys. Chem. C 2011, 115, 23, 11540– 11549.
[21] S. A. Didas, M. A. Sakwa-Novak, G. S. Foo, C. Sievers, C. W. Jones, J. Phys. Chem. Lett. 2014, 5, 23, 4194–4200.
[22] C. Knofel, C. Martin, V. Hornebecq, P. L. Llewellyn, J. Phys. Chem. C 2009, 113, 52, 21726–21734.
[23] D. L. Green, J. S. Lin, Y.-H. Lam, M. Z.-C. Hu, D. W. Schaefer, M. T. Harris, J. Colloid Interface Sci. 2003, 266, 2, 346–358.
[24] J. S. Beck, J. C. Vartuli, W. J. Roth, M. E. Leonowicz, C. T. Kresge, K. D. Schmitt, C. T.-W. Chu, D. H. Olson, E. W. Sheppard, S. B. McCullen, J. B. Higgins, J. L. Schlenkert, J. Am. Chem. Soc. 1992, 114, 10834–10843. [25] L. Etgar, G. Schuchardt, D. Costenaro, F. Carniato, C. Bisio, S. M.
Zakeeruddin, M. K. Nazeeruddin, L. Marchese, M. Graetzel, J. Mater. Chem. A 2013, 1, 10142–10147.
[26] D. Massiot, F. Fayon, M. Capron, I. King, S. Le Calve, B. Alonso, J.-O. Durand, B. Bujoli, Z. Gan, G. Hoatson, Magn. Reson. Chem. 2002, 40, 1, 70–76.
[27] M. Eic, D. M. Ruthven, Zeolites 1988, 8, 1, 40–45.
[28] J. A. A. Gibson, E. Mangano, E. Shiko, A. G. Greenaway, A. V. Gromov, M. M. Lozinska, D. Friedrich, E. E. B. Campbell, P. A. Wright, S. Brandani, Ind. Eng. Chem. Res. 2016, 55, 13, 3840–3851.
[29] X. Hu, S. Brandani, A. I. Benin, R. R. Willis, Ind. Eng. Chem. Res. 2015, 54, 26, 6772–6780.
[30] J. A. A. Gibson, A. V. Gromov, S. Brandani, E. E. B. Campbell, Microporous Mesoporous Mater. 2015, 208, 129–139.
Manuscript received: March 6, 2019 Revised manuscript received: May 7, 2019