Author information
Article first published online
HOW TO CITE
October 2020UP
VA
Determinants of Self-Declared Health Status in Some
European Countries
Carmine Clemente*, Thaís García-Pereiro**
* Department of Education Science, Psychology, Communication Science, University of Bari, Italy. Email: [email protected]
** Department of Political Sciences, University of Bari, Italy. Email: [email protected]
Clemente, C., García-Pereiro, T. (2020). Health Promotion During the Life Course. Lifestyle
Deter-minants of Self-Declared Health Status in Some European Countries, Italian Journal of Sociology
of Education, 12(3), 11-39.
Lifestyle Determinants of Self-Declared
Health Status in Some European Countries
Carmine Clemente, Thaís García-Pereiro
Abstract: Health promotion and health inequalities are both part of one system. Adopting a life course perspective on interventions might help to minimise current health inequalities and boost equity by leveraging on the social determinants of health. Using retrospective data of SHARE, this study is aimed at analysing whether and how some health promotion behaviours (in terms of lifestyle) change the self-perception of health in late adulthood. Approaching health through the life course perspective can be useful to pursue innovative and more effective public health promotion policies by acting on its socioeconomic determinants during people’s lives.
Keywords: health promotion, determinants of health, lifestyle behaviours, life course, inequalities
Introduction
Health inequalities are linked to the general conditions of both popula-tion and welfare systems. Human biology is certainly important for health, but epidemiological evidences have explained how different factors influ-ence health -so-called health determinants-, concluding that also individu-al behaviours, sociindividu-al, culturindividu-al and economic conditions and environments strongly impact health.
Social justice and equity were highlighted as core foundations for health, and there was agreement that health promotion is not simply the responsi-bility of the health sector. Here the urgent need to adopt intersectoral pol-icies, for example regarding education, child and family poverty, lifestyle, employment, etc. Ideas that have found their inspiration on the Romanov program for the Promotion of Health as sustainability of the health system (2002) and the Canadian movement -started in the 70s and formally rec-ognised in 1986 with the First WHO Global Health Promotion Conference- of the Promotion of Health.
Nowadays it is better understood the relationship between socioeconom-ic inequities and social factors impacting health determinants: indeed, ad-vantages and disadad-vantages in health accumulate differently over the life course. These processes start with pregnancy and early child development to continue throughout school, transition to working life, retirement and ageing.
Emerges, thus, the life course concept and its relevance. It represents the more appropriate approach to plan action on social determinants of health across the lifespan and could help to identify “when” measures should inter-vene in individuals’ lifetime. In the Marmot Review of social determinants and the health divide of the European region (Marmot et al., 2012), the life course perspective is considered as one of the priority areas of action. The life course perspective encompasses tensions between individual and soci-ety, allowing for the reconstruction of social and temporal contexts in which individuals design their own biography. This perspective also reflects the effect of multiple adaptation strategies to spatial and temporal changes oc-curring in the spheres of public and private life (Heinz & Krüger, 2001).
Approaching health throughout a life course perspective means that risk factors are not only important in late or mid-adult life (Lynch & Smith, 2005; Braveman et al., 2011), because they might have started their negative in-fluence on health even before (i.e.: during adolescence or childhood) and accumulate over time. A healthier lifestyle results a good health predictor of ageing by delaying the development of disability and reducing mortality (Walker, 2005; Sabia et al., 2012).
This paper empirically analyses the relationship between lifestyle deter-minants and health using SHARELIFE data and applying a life course per-spective. Analyses are focused on the layer 4 -individual lifestyle factors- of the Dahlgren-Whitehead model (1993) and, more specifically, on three-key lifestyle-related behaviours: physical activity, diet and smoking (Giskes et al., 2009). These lifestyle behaviours influence population health, are socially patterned and represent risk factors relative to, for example, blood pressure and high cholesterol, some types of cancer and, more general, are impli-cated in at least a third of the total burden of disease in Europe (Marmot et al., 2012; WHO, 2014; 2018). We also examine whether and how a person’s socio-economic and marital status, ethnicity, education, income, social par-ticipation, gender are linked to people’s lifestyle and health capital (physical health, mental health, self-sufficiency, and perceived health) to get a deeper understanding of its impact on life courses.
Inequities and sustainability in the current scenario
Europe has recorded improvements of health in the countries that have made progressive upgrades in general life conditions in which people are born, grow, live, and work.
According to the WHO European Region, UE Commission and various scholars, such a scenario is related to a long and sustained period of improve-ment in the lives people can lead. Societies that are increasingly affluent, with developed welfare states and high-quality education and health services, have created conditions for people to have a good and better quality of life.
At same time, literature demonstrate that social and economic circum-stances have not improved in all countries and, since 2008, the economic cri-sis has exacerbated this trend and exposed stark social and economic inequi-ties within and between some countries. And, as a consequence, social and health inequities have increased while social cohesion is weakened. Indeed, inequities, both between and within countries, persist. Simultaneously, there are some countries with the best levels of health and lowest health inequities in the world; others in which health inequities are not diminishing and are increasing (Marmot et al., 2012).
Health inequities are produced, therefore, by social inequities and both forms of inequities are influenced by public policies that shape the quality and distribution of the social determinants of health (Raphael, 2015). Thus, action is needed - to reduce health inequities and health divide across all countries, including those with low income - on the social determinants of health and following the life course perspective (Elder, 1998) on the wider social and economic spheres to achieve greater health equity and protect future generations. Both are, in fact, interlinked: advantages and
disadvan-tages of health and its social determinants accumulate over the life course. They start with pregnancy and child’s development and continue transitions to school and work (and working conditions), retirement and the aging pro-cess. Habitus, as an expression of the own social structure, plays a decisive role in the subjective ability to orient oneself to those life chances that will allow to affirm/adopt one’s lifestyle, in a logic of continuous interpola-tion between structural elements (instituinterpola-tions), media images and hearsay (DiMaggio, 1997) and individual action (agency) that determine one’s health trajectories (Bourdieu, 1986; Missinne et al., 2014; 2015).
Other factors must also be considered to have a clearer picture of social reality of living longer (Navickas et al., 2016):
• worsening of health trajectories;
• increasing of people suffering from multiple chronic conditions (multi-morbidity) and consequently of healthcare services as well as healthcare costs;
• shrinking of the working-age population and their fiscal support to health systems.
These social features highlight the fundamental role of social determi-nants as a protective factors for health (Holt-Lunstad et al., 2010; Smith & Christakis, 2008; Thoits, 2011) as well health promotion policies that may prevent or delay the onset and increase in chronic conditions and multimor-bidity in late-life, in order to secure the sustainability of European health and financial systems.
Promotion of health: inequities and social determinants
The idea of health promotion acting on social determinants are (two movements) strongly linked together. They developed in Canada and influ-enced the direction of data gathering about population health and public policies designed to improve health. These movements (Glouberman & Mil-lar, 2003) marked two big changes about the medicine and society relation-ship, going further the social and epidemiologic medicine paradigm already established in the XIX century, as argued Chadwick (1842) in his Report about the sanitary condition of the labouring population in Great Britain.
The health outcomes can be seen, in many circumstances, as gradients when they are plotted against an array of socioeconomic determinants. This is proved by epidemiological studies and adopted research lines ongoing (Glouberman & Millar, 2003).
Marmot et al. (2012), highlighted the ever-stronger connection between inequities and social determinants of health. In their review we find analyses conducted by multiple disciplinary knowledge, multidisciplinary analysis and all the psycho-social determinants of health are explored.
B) The concept of health determinants was developed for the first time, by Thomas McKeown. Professor of social medicine at the University of Bir-mingham in England, he argued starting 1972 (McKeown, 1979) that there were a large number of influences on health apart from traditional public health and medical services and that these influences should be considered in framing health policy and in any efforts to improve population health. McKeown had argued that health gains achieved in the 19th and 20th cen-turies were largely attributable to reduced family sizes and better nutrition (McKay, 2000) extended this analysis to identify social and economic factors that had powerful effects on the health of individuals and communities or nations.
This scientific work influenced successive reviews by Laframboise (Glou-berman & Millar, 2003), who articulated the Health promotion concept in the widely circulated Lalonde report of 1974.
Life course and lifestyles
The life course perspective emphasizes the need to develop policies that can meet people’s needs over the lifespan in different life spheres. Evidence provided by life course perspective (Blane et al., 2007, 2013) allows identify-ing when measures should intervene in individuals’ life span. Also the WHO in the Report on life course perspectives (WHO & CSDH, 2008) identified lifestyle’s determinants as areas of intervention for later stages of life, such as promoting physical activities, correct nutrition (diet) and smoking cessa-tion programmes among adolescents and adults.
Some scholars argued that considering the social determinants of health in a whole-of-society and life course perspective (Burton et. al., 2015; Elder, 1998; Elder & Johnson, 2003; Marmot et al., 2012) is expected to contribute to the reduction of health inequities (Kuh et. al., 2003) and to mitigate the intergenerational transmission of risks and disadvantages.
Nowadays, the life course perspective is consolidated and there is a gen-eral consensus on a number of statements concerning the life course ap-proach (Clemente & García-Pereiro, 2020): a) the need to consider changes in human life along a wide-span of time starting from childhood to old-age; b) the study of those changes according to a wide base of cohorts to understand the links between life and historical time; c) the analysis of the development of the life course as the result of personal characteristics and individual ac-tions within cultural references and institutional contexts; the study of life courses and the analysis of cohorts are essential tools for social and health policies aiming at following a preventive and promotional logic rather than a merely curative or reparatory one.
Similarly to research on life courses, also for health trajectories (Missinne et al., 2014; 2015) seems useful to refer to the concept of cultural capital and to its development during an individual’s life in terms of health capital, that is, chances of gaining or losing health.
The theory of health-related cultural capital highlights that people’s be-havioral options and preferences are structurally constrained and unequally distributed among social groups (Abel, 2008). This implies that health-rel-evant knowledge and skills used to lead a healthy life begin to accumu-late during childhood (Abel & Frohlich, 2012) and accompany individuals throughout their lifetimes (Shim, 2010) mainly through prevention (life-styles) and the quality of one’s primary network of relationships.
In this direction we find Cockerham’s “health lifestyle theory” (2000; 2005) which underline the structural dimensions of health lifestyles. Begin-ning with Weber’s (1922) concept of lifestyle, Cockerham described health lifestyles as “collective patterns of health-related behavior based on choices between options available to people based on their life chances” (Cocker-ham, 2000, p.165). Health lifestyles are widely shared by individuals close to each other in a social space and whose similar opportunities in terms of life possibilities give rise to a shared general habitus. Bourdieu’s (1995) notion of habitus implies that “health-related behavior can be seen as a largely rou-tinized feature of everyday life that is guided by practical or implicit logic” (Williams, 1995, p. 583).
Cockerham (2005) pointed out that, despite their complexities, health practices imply a general pattern. Consequently, the regular adoption of pre-vention practices can be seen as an expression of a lifestyle beginning its development during childhood. There is also empirical evidence regarding the general behavioral orientation towards a healthy lifestyle (Donovan et al., 1993). However, they highlight the difficulty of understanding the mech-anisms underlying socio-economic inequalities in practices and in the access to prevention and healthy lifestyles.
A crucial element is the conceptualization of social status. Some schol-ars have argued that in current post-industrial societies, stratification is not driven by social class alone (Bartley et al., 2004). As a result of better working conditions, wage rises and leisure time, consumption patterns have gained in importance. Therefore, the explicit inclusion of cultural capital has been advocated in explanatory approaches to social inequality in health and health behavior, rather than inferring it from general socioeconomic-status (SES) measures, such as social class and income (Abel, 2008; Abel & Frohlich, 2012; Shim, 2010). Bourdieu (1986) described how inequality could be repro-duced by the interaction of three different forms of capital: economic, social and cultural.
When Bourdieu’s (1986) general notion of cultural capital is applied to health research, what is meant as health-related cultural capital can be de-fined (Abel, 2008) as all the culture-based resources that are available for people to take action on behalf of their health (including values related to health, behavioral norms, education and operational skills).
This form of cultural capital becomes directly relevant to health through the adoption of healthy lifestyles (Abel, 2008; Abel & Frohlich, 2012; Phelan et al., 2004; Shim, 2010). Habitus is therefore connected to economic resourc-es (i.e.: income), with symbolic-cultural rresourc-esourcresourc-es (i.e.: education) but also with relational resources and networks membership.
The relevance of the meaning that this concept of lifestyles entails is to be found in Weber’s developments: is consumption that sets differences and membership (identity status) to a group respect. This Weberian perspective clarifies how the individual - in his own life course - moves dialectically be-tween the subjective dimension of life choices and the objective dimension of life chances.
The realistic dimension of being able to concretely adopt correct life-styles, including those health-related, is linked to the actual possibilities that everyone has of being able to choose ideal behaviors. Each social position largely determines the life chances of individuals at that time and these po-sitions constitute the structuring forces of life choices (agency) on health lifestyles (Cockerham, 2005). Thus, the collective models of behavior related to health can be adopted based on one’s life chances and each group adopts those possible among several options.
Lifestyle determinants of health: physical activity, diet and
smoking as risk factors
Regarding the importance of healthy behaviours, scientific evidence ap-plying a life course approach to chronic disease prevention and control has converged in considering diet, physical activity and smoking as the most significant risk factors (Darnton-Hill et al., 2004). Most research has been focused on interpreting how these are related to health outcomes in later life (Sabia et al., 2012; Gopinath et al., 2018). Sabia et al. (2012) have found a positive relationship between healthy behaviours and successful ageing (in terms of absence of disease and good functioning), finding that health benefits increase (DiPrete & Eirich, 2006) as healthy behaviours cumulate. Gopinath et al. (2018) have reported a higher likelihood of ageing success-fully (after a 10-year follow-up) among elders having maintained high levels of total physical activity. In a longitudinal study Chakravarty et al. (2012), have demonstrated that in older adults (having completed college education) with healthy habits (normal weight, not smoking, regular physical activity)
the development of disability was delayed and mortality was reduced if com-pared to those following less healthy behaviours.
WHO Regional Office (2018) estimates that regular physical activity re-duces the risk of cardiovascular disease, some cancers and Type II (non-in-sulin-dependent) diabetes. Overweight and obesity – that is, having a body mass index (BMI) of 30 or higher – is estimated to kill about 320,000 men and women in 20 countries of western Europe every year and the rate of obesity in some areas of eastern Europe is also high and has risen more than threefold since 1980 (WHO, 2018). Rates of overweight and obesity change in the life course (Gillman, 2004; Kuh et al., 2014) and continue to grow in adults and children. Physical activity levels are also influenced by cultural values in the life course (Lynch, 2003; Darnton-Hill et. al., 2004; WHO, 2018): in most countries, girls, women, older adults, underprivileged groups, and people with disabilities and chronic diseases, all have fewer opportunities to access safe, affordable and appropriate programmes and places in which to be physically active. Given the general health impact of these risk factors and given social patterning, promoting healthier diets and more physical exercise among low-income groups is of major importance – also from an equity-in-health perspective (Kawachi, 1999; Darmon & Drewnowski, 2008; Marmot et al., 2012).
Leisure time physical activities are less common among lower socioeco-nomic groups and with lowest education (Ross & Wu, 1995; Kawachi, 1999; Kino et al., 2018; Raghupathi & Raghupathi, 2020) and is gender different (Marmot et al., 2012). Adults with higher educational attainment have better health and lifespans compared to their less educated peers. We highlight that tertiary education, particularly, is critical in influencing (Evans et al., 1994; WHO, 2013; de Breij et al., 2020) infant mortality, life expectancy and child vaccination.
Smoking increases the risk of mortality from lung cancer and many oth-er cancoth-ers, heart disease, stroke, and chronic respiratory diseases. Smoking kills over a million men and over 200,000 women in Europe and around 8 million worldwide (IHME, 2018; WHO, 2019a; 2019b). Smoking is a major determinant of social inequities in health in Europe, given that about a third of the differences in mortality rates between the rich and the poor are due to differences in smoking, its prevalence is higher in the lower socioeconomic status in high income countries and tracks strongly in adolescence and up until the late twenties (Tokgozoglu et al., 2020).
Data and methods
Data is drawn from the first and the third wave of the Survey of Health, Ageing and Retirement in Europe (DOIs: 10.6103/SHARE.w1.700 10.6103/
SHARE.w3.700), a longitudinal study covering a wide variety of aspects ranging from demographic characteristics to health variables, please refer to Börsch-Supan et al. (2013), for methodological details1.
The first wave of SHARE collected data from more than 30,000 respon-dents aged 50 or older across eleven European countries (Austria, Belgium, Denmark, France, Germany, Greece, Italy, Netherlands, Spain, Sweden, Switzerland). The main questionnaire comprises information of 20 modules on health, socioeconomics and social networks of all respondents (Börsch-Supan et al., 2005; Börsch-(Börsch-Supan & Jürges, 2005). The third wave was carried out between 2008 and 2009. SHARELIFE asked about life histories individ-uals aged 50 and over living in the countries of the baseline study plus two transition countries (Czech Republic and Poland). The questionnaire includes retrospective information on several spheres of respondents’ live courses: children history, marital history, accommodation, childhood circumstances, financial assets, working history and health and health care (Börsch-Supan et al., 2011; Börsch-Supan et al., 2013).
SHARELIFE data has been linked to information collected on Wave 1 to include on empirical analysis some variables that have been collected only once (Schröder, 2011; Börsch-Supan & Jürges, 2005; Börsch-Supan et al., 2008) (see Table 1). Sample selection includes individual who answered to the question regarding respondent’s health in general (16,597). After some data cleaning, the final sample included 16,546 individuals.
Empirical analyses presented here rely on ordered logistic regression models to analyse the role played by behavioural changes made on lifestyle patterns during the life course on subjective health status when controlling for other well-known determinants (individual characteristics, current health and habits).
The outcome variable (ordinal) deals with health at the time of the survey through the self-perceived and declared health status (scale 0 -poor- to 5 -ex-cellent-). Two SHARELIFE questions regarding lifestyle changes allow us to test the influence, if any, of health prevention during the life course. The first asks if the respondent has acted (for at least one year) a behavioural change (increased physical activity, changed diet and stopped smoking) to improve the own health. The second regards its timing, that is, in which phase of the
1 Funded by: European Commission FP5 (QLK6-CT-2001-00360), FP6 (SHARE-I3:
RII-CT-2006-062193, COMPARE: CIT5-CT-2005-028857, SHARELIFE: CIT4-CT-2006-028812), FP7 (SHARE-PREP: GA N°211909, SHARE-LEAP: GA N°227822, SHARE M4: GA N°261982) and Horizon 2020 (SHARE-DEV3: GA N°676536, SERISS: GA N°654221); DG Employment, Social Affairs & Inclusion; German Ministry of Education and Research, the Max Planck So-ciety for the Advancement of Science, U.S. National Institute on Aging (U01_AG09740-13S2, P01_AG005842, P01_AG08291, P30_AG12815, R21_AG025169, Y1-AG-4553-01, IAG_BSR06-11, OGHA_04-064, HHSN271201300071C) plus national funding (see www.share-project. org).
life course has been acted (Childhood, Youth or Adulthood, Late Adulthood, Old age). Separate estimations were built for these behavioural changes computing the ordered log-odds regression coefficients (logit function) for each independent variable, while other variables held constant. We assessed the goodness of fit of the models through pseudo R2 and Log pseudolikeli-hood and significance of covariates with Wald statistics. Brand tests were carried out to test the proportionality odds assumption of the ordinal logistic regression.
Models are presented in Tables 2-4, two including increased physical ac-tivity as the behavioural change, five for changed diet and six for stopped smoking. The first and the second estimations (M1 and M2) are common for the three behavioural changes and tested the relationship between the self-declared health status and its main determinants plus having acted the behavioural change during the life course (M1) and the timing of the change (M2). When the lifestyle of interest is a change on diet, M3 added interac-tions terms between gender and having changed diet to the initial estima-tion. In M4, we included interactions terms between educational attainment and having changed diet, while M5 tested for both interactions (gender and changed diet, educational attainment and changed diet). When analysing the effect of having stopped smoking on self-declared health status, we added a sixth model with the interaction term between current smoking habits (be-ing a smoker at the time of the survey) and hav(be-ing stopped smok(be-ing for at least one year during the life course. This allowed us to clean the effect that having stopped smoking might have on the self-declared health considering that, even if having acted the change, some abandoned the new healthy life-style behaviour to start smoking again.
Last estimations were enriched with interaction terms to identify which effects on an individual’s self-declared health status, if any, differ across groups. We introduced interaction effects to test if there are some mediator variables influencing the relationship between a behavioural change made during the life course and the self-declared state of health. In particular, we hypothesized that the relationship between state of health and having acted behavioural life-style changes will probably depend on gender and educa-tion, when the change regards diet, and on being a smoker at the time of the survey, when having stopped smoking (for at least one year) is the variable of interest. Models include variables that were used to compute interaction effects, even if their effects were not statistically significant (Harrell, 2015).
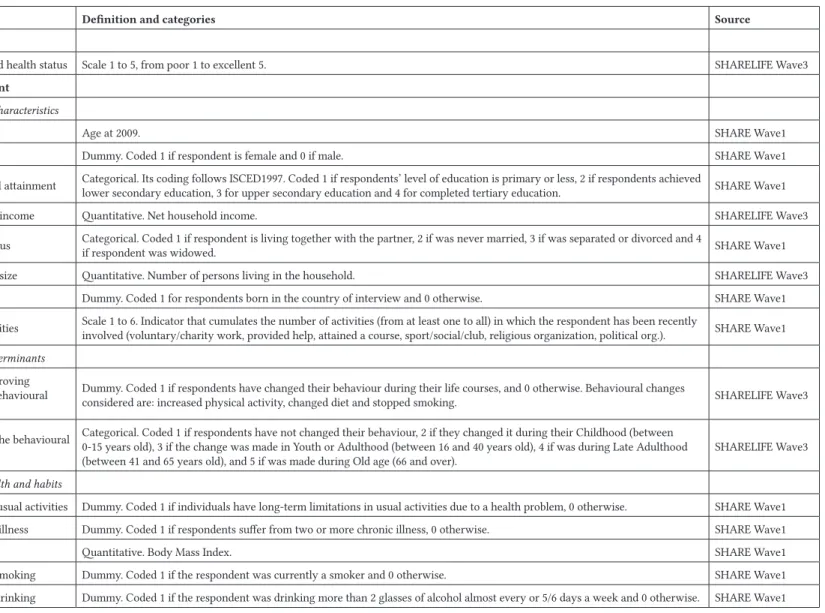
Table 1 - Definition and source of variables
Variable Definition and categories Source
Dependent
Self-declared health status Scale 1 to 5, from poor 1 to excellent 5. SHARELIFE Wave3
Independent
Individual characteristics
Age Age at 2009. SHARE Wave1 Gender Dummy. Coded 1 if respondent is female and 0 if male. SHARE Wave1 Educational attainment Categorical. Its coding follows ISCED1997. Coded 1 if respondents’ level of education is primary or less, 2 if respondents achieved lower secondary education, 3 for upper secondary education and 4 for completed tertiary education. SHARE Wave1 Household income Quantitative. Net household income. SHARELIFE Wave3 Marital status Categorical. Coded 1 if respondent is living together with the partner, 2 if was never married, 3 if was separated or divorced and 4 if respondent was widowed. SHARE Wave1 Household size Quantitative. Number of persons living in the household. SHARELIFE Wave3 Ethnicity Dummy. Coded 1 for respondents born in the country of interview and 0 otherwise. SHARE Wave1 Social activities Scale 1 to 6. Indicator that cumulates the number of activities (from at least one to all) in which the respondent has been recently involved (voluntary/charity work, provided help, attained a course, sport/social/club, religious organization, political org.). SHARE Wave1
Lifestyle determinants
Health improving activities (behavioural changes)
Dummy. Coded 1 if respondents have changed their behaviour during their life courses, and 0 otherwise. Behavioural changes
considered are: increased physical activity, changed diet and stopped smoking. SHARELIFE Wave3
Timing of the behavioural
change
Categorical. Coded 1 if respondents have not changed their behaviour, 2 if they changed it during their Childhood (between 0-15 years old), 3 if the change was made in Youth or Adulthood (between 16 and 40 years old), 4 if was during Late Adulthood
(between 41 and 65 years old), and 5 if was made during Old age (66 and over). SHARELIFE Wave3
Current health and habits
Limited in usual activities Dummy. Coded 1 if individuals have long-term limitations in usual activities due to a health problem, 0 otherwise. SHARE Wave1 2+ chronic illness Dummy. Coded 1 if respondents suffer from two or more chronic illness, 0 otherwise. SHARE Wave1 BMI Quantitative. Body Mass Index. SHARE Wave1 Currently smoking Dummy. Coded 1 if the respondent was currently a smoker and 0 otherwise. SHARE Wave1 Currently drinking Dummy. Coded 1 if the respondent was drinking more than 2 glasses of alcohol almost every or 5/6 days a week and 0 otherwise. SHARE Wave1
Table 2 - Descriptive statistics
Variable Mean/ % Std.Dev. Min Max
Dependent variable
Self-declared health status 2.8 1.0 1 5
Independent variables Age at 2009 68.9 10.6 30 108 Female 55.6 Educational attainment Primary or less 34.4 Lower secondary 17.5 Upper secondary 29.5 Tertiary education 18.6
Household net income 30,806.2 35,276.7 0 1,140,000 Marital status
Living with partner 72.9 Never married 5.3 Separated/divorced 7.2 Widowed 14.6 Household size 2.2 1.0 1 9 Born abroad 11.9 1.295 1 5 Social activities 1.3 1.6 1 7
Current health and habits
Limited in usual activities 41.1 2+ chronic illness 41.0
BMI 25.9 5.6 0 77.1 Currently smoking 19.3
Currently drinking 12.4
Behavioural changes
Increased physical activity 13.5 Changed diet 13.2 Stopped smoking 13.5
N 16,546
Source: Own elaboration, SHARE (Waves1&3).
Descriptive statistics of the sample and independent variables are present-ed in Table 2. The mean value of the dependent variable self-declarpresent-ed health status (how is your health in general?) is 2.8, being fair the most frequent
cate-gory (37.6%). Sample mean age is around 69 years old and the share of females is 55.6%. Educational attainment was introduced coding those with primary education or less (34.4%), against those having achieved higher levels (i.e.: 18.6% achieved tertiary education). The mean net household income (annual) is around 30,000 euro. To approach ethnicity, a dummy variable was built to identify those who were born abroad (11.9%). Almost 73% of respondents were living with a partner at the time of the survey, in a household with 2.2 persons (mean value). Respondent’s engagement in several types of activities (volun-tary/charity work, provided help, attained a course, sport/social/club, religious association, political association) points to a mean value ranging around 1.3.
Models also control for current health and habits. Around 41% declared to suffer from diseases that limit their usual activities, the same share is suffer-ing from more than two chronic illnesses. As a proxy of healthy diet habits, we have included the BMI, its mean (25.9) is indicating a border-line value between normal and overweight. Regarding habits, 19.3% of respondents was smoking at the time of the survey and 12.4% was drinking more than 2 glasses of alcohol almost every or 5/6 days a week.
We used three indicators of lifestyle behavioural changes in individuals’ life courses. The share of respondents having increased their levels of physical activity, changed diet or stopped smoking (for at least one year) at least once during their life courses is 13.5%.
Results: life course changes on lifestyle behaviours and health
outcomes
The positive role of having increased physical activity
What individual characteristics are related to the self-declare health sta-tus? Females and respondents born abroad display lower levels of health if compared to males and natives (Table 3). In societies where social exclusion is strongly related to ethnicity, being foreign-born influences opportunities and trajectories during the life-course. In line with previous studies (Moullan & Jusot, 2014; Sand & Gruber, 2018), our results show that foreigners’ health sta-tus is significantly poorer than natives. As age increases, the health advantage of foreigners seems to decrease. This might be also linked to foreigners’ cu-mulative exposure (Markides & Rote, 2019) to disadvantaged social positions they face on host countries, such as: low income, poor education and housing, physically demanding jobs, discrimination, welfare deservingness, etc.
The log-odds for declaring a better level of health diminishes as age in-creases: for one year of increase in age, we expect a 0.0298 increase in the log-odds of feeling healthier. This effect becomes even larger if we control by the timing of the change made (-0.0308***, M2).
There is also a net effect of the marital status: those who never got married have lower ordered logs of better health than those living with their part-ners. Here the protective effect of living in couple, a sort of positive selection that seems to promote health, well known and defined by specialized litera-ture on the subject (Lillard & Panis, 1996; Brockmann & Klein, 2004; Huijts & Kraaykamp, 2011). The number of components living in the household also influence self-declared health status of respondents. Thus, for a one unit in-crease in the size of the household, the ordered logit of having a better general health decrease by 0.038.
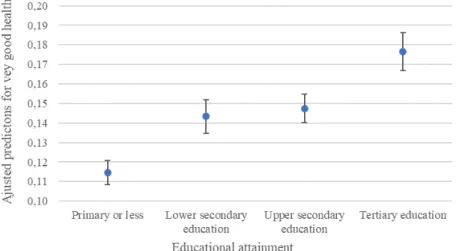
Especially important is the role played by the level of education (Börsch-Supan et al., 2011). The predicted probabilities computed give a clear picture of differences in general health status by educational attainment, while holding the rest of variables constant at its mean values. As shown in Figure 3, an av-erage respondent with tertiary education is almost 1.6 times as likely to have declared a very good general health status as an average respondent with pri-mary education or less (17.7% compared with 11.4%). Further, we see that there is a large increase in the predicted probability of declaring a very good general state of health between having primary or lower secondary education and an even bigger jump between the highest levels of education (upper secondary and tertiary education).
Confirming the importance of the socio-economic and cultural status as main health determinants, household income is positively related to levels of self-perceived health status.
Figure 3 - Adjusted predictions of educational attainment (95%CI) for very-good general health status. Increased physical activity
The number of activities in which respondents are involved is another determinant of an individual’s health status. Moving to a higher number of activities (i.e.: from being involved in two activities to be involved in three) would increase the ordered logit of reporting a better state of health by 0.112. One of the most recent studies on formal social participation and health (Santini et al., 2020) using SHARE data has confirmed the function of being active in social activities as a protective factor associated to lower levels of chronic conditions and higher levels of quality of life. Our findings further support the almost proven idea that higher levels of engagement with the social environment led to better health (Adams et al., 2011).
Table 3 also reveals, as expected, a strong negative association between objective measures of health, as limitations in usual activities and suffering from more than 2 chronic illnesses and declaring a higher rate of gener-al hegener-alth status. Within this group of independent variables, gener-also the Body Mass Index (BMI) and the variable identifying smokers are negatively relat-ed to the health status. In fact, for one unit of increase in the BMI, we expect a 0.024 decrease in the log-odds of declaring a higher level of health; and smoking tend to reduce the self-perceived general state of health.
Which role of having increased physical activity -as a behavioural change made during the life course- on health? The relationship between having made a lifestyle change by increasing levels of physical activity and the gen-eral health status is positive (Table 3, M1), indicating a higher health status of respondents who have increased physical activity against those whose levels remained stable. This positive effect differs according to the phase of the life course in which the change has been made (Table 3, Model2), being particularly important in old age. These results are in line with those of Go-pinath et al. (2018), who found that maintaining regular levels of physical ac-tivity while getting old was crucial for aging successfully, and Chakravarty et al. (2012), who reported lower mortality and disability rates among elders who exercise regularly. Both educational and life course gradients found support previous research (Shaw & Spokane, 2008) highlighting the impor-tance of promoting health through increased physical activity during early elderhood targeting interventions according to the socioeconomic status.
Table 3 - Results of ordinal regression models of self-declared health status. In-creased physical activity
Variables M1 M2
Age at 2009 -0.0298*** -0.0308*** (0.00196) (0.00200) Female -0.0869*** -0.0870*** (0.0314) (0.0314)
Lower secondary 0.285*** 0.284*** (0.0444) (0.0444) Upper secondary 0.322*** 0.324*** (0.0401) (0.0401) Tertiary education 0.570*** 0.573*** (0.0464) (0.0465) Household income (net) 1.98e-06*** 1.98e-06***
(4.57e-07) (4.57e-07) Never married -0.238*** -0.239*** (0.0705) (0.0705) Sparated/divorced -0.0973 -0.0996 (0.0614) (0.0614) Widowed -0.0662 -0.0648 (0.0496) (0.0496) Household size -0.0379** -0.0377** (0.0183) (0.0183) Born abroad -0.240*** -0.243*** (0.0647) (0.0647) Social activities 0.112*** 0.112*** (0.00877) (0.00878) Limited in usual activities -1.252*** -1.250*** (0.0338) (0.0338) 2+ chronic diseases -0.781*** -0.782*** (0.0333) (0.0334) BMI -0.0244*** -0.0245*** (0.00303) (0.00303) Currently smoking -0.259*** -0.261*** (0.0387) (0.0387) Currently drinking -0.00182 -0.00131 (0.0435) (0.0434) Increased physical activity 0.126***
-(0.0344) -Childhood (0-15 yrs) - 0.219
- (0.279) Youth and adulthood (16-40 yrs) - 0.0469 - (0.0750)
Late adulthood (41-65 yrs) - 0.0764* - (0.0407) Old age (66+) - 0.280*** - (0.0700) Observations 16,546 16,546 Pseudo-R2 0.106 0.106 Log-likelihood -21,577 -21,574
(Robust standard errors) ***p<0.01, **p<0.05, *p<0.1
Changed diet: gender and education as moderators
One of the most interesting findings is the huge consistency of self-de-clared health determinants included in model estimations. Each one of the coefficients remain pretty much stable (same sign and almost invariant val-ues). The source of variation between specifications (Tables 3-5) are those coming from life course changes made in lifestyle behaviours. Thus, the dis-cussion of findings hereinafter is focused on behavioural changes and mod-erator effects (M3-5, Figure 4).
The first moderator is gender. The ordered log-odds linking a change made to a healthier one to a better auto-perceived health status turns posi-tive for females. This might be indicating the presence of a protecposi-tive role of certain lifestyle-behaviours that might neutralize male-female differences in self-reported health status, given that women declare a worse health status than men (Hosseinpoor et al., 2012; Boerma et al., 2016). This further sup-port theories in which women tend to have higher health consciousness, fol-low more accurately dietary recommendations and be more prone to adopt healthy dietary habits (Fagerli & Wandel, 1999; Lallukka et al., 2007).
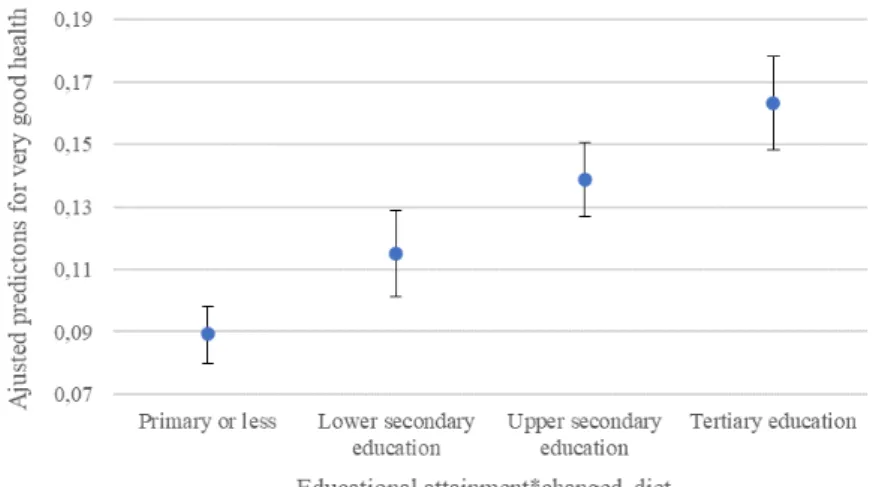
There is a substantial educational gradient on the relationship between having switched to a healthier diet and feeling better (general health sta-tus). M4-5 displayed on Table 4 include interaction terms between changed diet and educational attainment. As can be observed, the effect of having changed diet on the general health status is positive for respondents having achieved the two highest levels of education. This result is confirmed by pre-dicted probabilities computed for the interaction term (Figure 4). According to it, the average respondent who changed diet and has tertiary education has a 16.3% chance of declaring a very good state of general health, twice the chances of individuals that changed their diet but have achieved primary education or less (8.9%). This result seems to be pointing at the interplay between socio-cultural factors and individual patterns of behaviour related
to lifestyle. In accordance with present results, previous studies have demon-strated that the level of education is one of the most relevant determinants of changing to healthier dietary habits, which may take the lead to a better health (Johansson et al., 1998; Lallukka et al., 2007; Darmon & Drewnowski, 2008). Hence, education must be intended as a key contributor on the con-struction of peoples’ lifestyles or habitus (Lizardo, 2004; Singh-Manoux & Marmot, 2005; Tomelleri, 2019).
This finding may be explained by the fact that the improvement of health is mediated by education given that more educated people tend to increase both their health knowledge and healthy behaviours (Braveman et al., 2011). Moreover, higher educational levels are related not only to health-promoting behaviours but also to earlier adoption of health-related recommendations.
Figure 4. Adjusted predictions of the interaction between educational attainment and having changed diet (95%CI) for very-good health status.
Source: Own elaboration, SHARE (Waves1&3). Stopped smoking, but only if definitively
The third behavioural change analysed regards having stopped smoking (at least for one year) during the life course. In accordance to previous re-sults for having changed diet and in line with literature on this subject, this lifestyle change also encompasses moderator effects of both gender (positive for females) (Graham et al., 2006; Bricard et al., 2016; Pampel et al., 2017) and education (negative for upper secondary education) (Jefferis et al., 2004; Federico et al., 2007; Hiscock et al., 2012; Gagné et al., 2019).
Unsurprisingly, the most important moderator effect are current smoking habits. Results show that the effect of having stopped smoking is negative for respondents who started smoking again, being smokers at the time of the
survey. Having stopped smoking does not mean having stopped definitively because the process of start-stop smoking may repeat itself several times during the life course. Non-smokers have a higher likelihood of being in good health than ex-smokers but there were not differences in the self-eval-uation of the own health status between current smokers and ex-smokers (Blaylock & Blisard, 1992).
Our results, in line with Gilman et al. (2003), underpin the transitional character of smoking given that the processes of initiation, maintenance and cessation change over the life course and its consequences on health might cumulate depending on this. Thus, further research is needed to disentangle the complex influence of smoking on self-rated health following a life course approach: how many years being a smoker? during which phases of life? which interactions with other health related life course events?
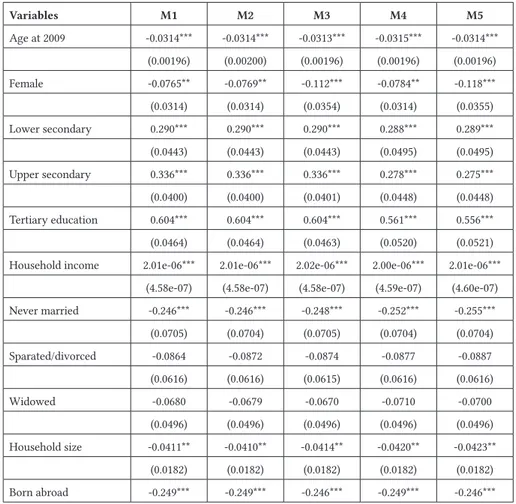
Table 4 - Results of ordinal regression models of self-declared health status. Changed diet. Variables M1 M2 M3 M4 M5 Age at 2009 -0.0314*** -0.0314*** -0.0313*** -0.0315*** -0.0314*** (0.00196) (0.00200) (0.00196) (0.00196) (0.00196) Female -0.0765** -0.0769** -0.112*** -0.0784** -0.118*** (0.0314) (0.0314) (0.0354) (0.0314) (0.0355) Lower secondary 0.290*** 0.290*** 0.290*** 0.288*** 0.289*** (0.0443) (0.0443) (0.0443) (0.0495) (0.0495) Upper secondary 0.336*** 0.336*** 0.336*** 0.278*** 0.275*** (0.0400) (0.0400) (0.0401) (0.0448) (0.0448) Tertiary education 0.604*** 0.604*** 0.604*** 0.561*** 0.556*** (0.0464) (0.0464) (0.0463) (0.0520) (0.0521) Household income 2.01e-06*** 2.01e-06*** 2.02e-06*** 2.00e-06*** 2.01e-06***
(4.58e-07) (4.58e-07) (4.58e-07) (4.59e-07) (4.60e-07) Never married -0.246*** -0.246*** -0.248*** -0.252*** -0.255*** (0.0705) (0.0704) (0.0705) (0.0704) (0.0704) Sparated/divorced -0.0864 -0.0872 -0.0874 -0.0877 -0.0887 (0.0616) (0.0616) (0.0615) (0.0616) (0.0616) Widowed -0.0680 -0.0679 -0.0670 -0.0710 -0.0700 (0.0496) (0.0496) (0.0496) (0.0496) (0.0496) Household size -0.0411** -0.0410** -0.0414** -0.0420** -0.0423** (0.0182) (0.0182) (0.0182) (0.0182) (0.0182) Born abroad -0.249*** -0.249*** -0.246*** -0.249*** -0.246***
(0.0648) (0.0648) (0.0649) (0.0648) (0.0649) Social activities 0.116*** 0.116*** 0.116*** 0.116*** 0.116*** (0.00875) (0.00875) (0.00875) (0.00875) (0.00875) Limited in usual activities -1.245*** -1.244*** -1.246*** -1.244*** -1.245*** (0.0338) (0.0338) (0.0338) (0.0338) (0.0339) 2+ chronic diseases -0.767*** -0.767*** -0.766*** -0.766*** -0.765*** (0.0335) (0.0335) (0.0335) (0.0335) (0.0335) BMI -0.0236*** -0.0236*** -0.0237*** -0.0236*** -0.0237*** (0.00303) (0.00303) (0.00303) (0.00303) (0.00303) Currently smoking -0.280*** -0.280*** -0.281*** -0.279*** -0.281*** (0.0386) (0.0386) (0.0386) (0.0387) (0.0386) Currently drinking -0.0113 -0.0115 -0.0132 -0.0122 -0.0145 (0.0434) (0.0434) (0.0434) (0.0434) (0.0434) Changed diet -0.231*** - -0.319*** -0.356*** -0.464*** (0.0342) - (0.0541) (0.0629) (0.0779) Childhood - -0.296 - - -- (0.433) - - -Youth and adulthood - -0.256** - - -- (0.112) - - -Late adulthood - -0.225*** - - -- (0.0403) - - -Old age - -0.222*** - - -- (0.0623) - - -Interactions Female*changed diet - - 0.148** - 0.167** - - (0.0689) - (0.0693) Lower secondary*changed diet - - - 0.0192 0.0162 - - - (0.103) (0.103) Upper secondary*changed diet - - - 0.260*** 0.269*** - - - (0.0866) (0.0868) Tertiary education*changed diet - - - 0.188** 0.207** - - - (0.0948) (0.0952) Observations 16,546 16,546 16,546 16,546 16,546 Pseudo-R2 0.106 0.106 0.106 0.106 0.107
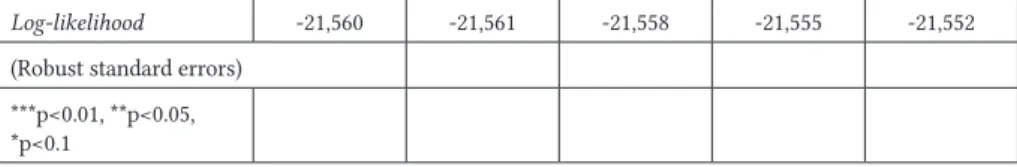
Log-likelihood -21,560 -21,561 -21,558 -21,555 -21,552 (Robust standard errors)
***p<0.01, **p<0.05, *p<0.1
Table 5 - Results of ordinal regression models of self-declared health status. Stopped smoking. Variables M1 M2 M3 M4 M5 M6 Age at 2009 -0.0305*** -0.0304*** -0.0303*** -0.0304*** -0.0303*** -0.0300*** (0.00196) (0.00199) (0.00196) (0.00196) (0.00195) (0.00196) Female -0.101*** -0.100*** -0.154*** -0.0961*** -0.0883*** -0.140*** (0.0323) (0.0323) (0.0370) (0.0324) (0.0324) (0.0372) Lower secondary 0.291*** 0.292*** 0.290*** 0.276*** 0.287*** 0.273*** (0.0444) (0.0444) (0.0444) (0.0503) (0.0444) (0.0504) Upper secondary 0.331*** 0.330*** 0.326*** 0.370*** 0.329*** 0.364*** (0.0400) (0.0400) (0.0401) (0.0449) (0.0400) (0.0449) Tertiary education 0.587*** 0.586*** 0.581*** 0.602*** 0.584*** 0.596*** (0.0463) (0.0463) (0.0463) (0.0528) (0.0463) (0.0528) Household income 2.08e-06*** 2.06e-06*** 2.07e-06*** 2.09e-06*** 2.09e-06*** 2.09e-06***
(4.58e-07) (4.58e-07) (4.58e-07) (4.58e-07) (4.57e-07) (4.56e-07) Never married -0.246*** -0.247*** -0.251*** -0.246*** -0.243*** -0.247*** (0.0704) (0.0705) (0.0705) (0.0705) (0.0705) (0.0706) Sparated/divorced -0.0946 -0.0944 -0.0994 -0.0950 -0.0964 -0.102* (0.0615) (0.0615) (0.0615) (0.0615) (0.0614) (0.0615) Widowed -0.0686 -0.0691 -0.0653 -0.0663 -0.0687 -0.0627 (0.0496) (0.0496) (0.0496) (0.0496) (0.0496) (0.0496) Household size -0.0398** -0.0401** -0.0395** -0.0391** -0.0396** -0.0386** (0.0182) (0.0183) (0.0183) (0.0183) (0.0182) (0.0183) Born abroad -0.249*** -0.246*** -0.249*** -0.248*** -0.247*** -0.246*** (0.0648) (0.0648) (0.0648) (0.0648) (0.0647) (0.0646) Social activities 0.114*** 0.114*** 0.114*** 0.114*** 0.114*** 0.115***
(0.00875) (0.00875) (0.00875) (0.00875) (0.00874) (0.00875) Limited in usual activities -1.248*** -1.248*** -1.250*** -1.248*** -1.249*** -1.250*** (0.0338) (0.0338) (0.0338) (0.0338) (0.0338) (0.0338) 2+ chronic diseases -0.779*** -0.778*** -0.778*** -0.778*** -0.781*** -0.780*** (0.0334) (0.0334) (0.0334) (0.0334) (0.0334) (0.0334) BMI -0.0245*** -0.0245*** -0.0244*** -0.0245*** -0.0246*** -0.0245*** (0.00304) (0.00304) (0.00304) (0.00304) (0.00304) (0.00304) Currently smoking -0.273*** -0.268*** -0.282*** -0.272*** -0.188*** -0.196*** (0.0386) (0.0388) (0.0388) (0.0386) (0.0440) (0.0441) Currently drinking 0.00114 0.00117 -0.00214 0.00114 -0.00219 -0.00565 (0.0435) (0.0435) (0.0435) (0.0435) (0.0435) (0.0436) Stopped smoking -0.231*** - -0.162*** -0.0166 -0.00731 -0.0327 (0.0342) - (0.0464) (0.0675) (0.0390) (0.0742) Childhood - 0.329 - - - -- (0.888) - - - -Youth and adulthood - 0.00978 - - - -- (0.0615) - - - -Late adulthood - -0.105** - - - -- (0.0435) - - - -Old age - -0.0754 - - - -- (0.0742) - - - -Interactions Female*stopped smoking - - 0.210*** - - 0.224*** - - (0.0708) - - (0.0711) Lower secondary*stopped smoking - - - 0.0484 - 0.0318 - - - (0.102) - (0.103) Upper secondary*stopped smoking - - - -0.160* - -0.165* - - - (0.0885) - (0.0886) Tertiary education*stopped smoking - - - -0.0670 - -0.0821
- - - (0.0963) - (0.0963) Currently smoking*stopped smoking - - - - -0.362*** -0.368*** - - - - (0.0891) (0.0891) Observations 16,546 16,546 16,546 16,546 16,546 16,546 Pseudo-R2 0.105 0.105 0.106 0.105 0.106 0.106 Log-likelihood -21,581 -21,580 -21,577 -21,578 -21,572 -21,565
(Robust standard errors) ***p<0.01, **p<0.05, *p<0.1
Concluding remarks
The life course perspective might be extremely helpful to get a deep-er awareness of how lifestyle behaviours change during the lifespan, being particularly useful to understand how the timing of these changes might dif-ferently affect health outcomes later in life. This paper has shed some lights on the ways in which having changed the own lifestyle influences health outcomes at later ages. The life course gradient of behavioural changes is particularly evident when analysing people who increased their levels of physical activities. In general, its effect on subsequent health status is pos-itive but, when considering the phase of the life in which the change was made, the positive effect is confirmed for the phase of late adulthood (41-65 years old) becoming even more important if the increased was acted in old age (after the 66th birthday).
Other important element that deserves to be considered is the way in which the relationship between lifestyle and health differs across groups of individuals triggering new forms of health inequities. In this sense, having switched into healthier dietary habits generates positive effects for women and for highly educated individuals but not for men or for individuals with lower levels of education.
Individuals add and remove healthier behaviours during their lifespan. In some cases, these changes may be definitive (becoming habits) but some-times changes may not be maintained for longer periods, losing their poten-tial as health improvers. Thus, the life course perspective could help towards the planning of more innovative and sustainable public health policies iden-tifying when to adopt measures in people’s lifespans and which health de-terminants to switch based on social characteristics of recipient individuals.
References
Abel, T. (2008). Cultural capital and social inequality in health. Journal of Epidemiology and Community Health, 62, 1-5.
Abel, T., & Frohlich K. L. (2012). Capitals and capabilities: Linking structure and agency to reduce health inequalities. Social Science & Medicine, 74(2), 236–244. doi:10.1016/j. socscimed.2011.10.028.
Adams, K.B., Leibbrandt, S., Moon, H. (2011). A critical review of the literature on social and leisure activity and wellbeing in later life. Ageing Societies, 31, 683-712.
Antonovsky, A. (1967). Social class, life expectancy and overall mortality. Milbank Memorial Fund Quarterly, 45(2), 31- 73.
Bartley M., Sacker A., & Clarke P. (2004). Employment status, employment conditions, and limiting illness: Prospective evidence from the British household panel survey 1991– 2001. Journal of Epidemiology and Community Health, 58(6), 501-506. doi:10.1136/ jech.2003.009878.
Blane, D., Kelly-Irving, M., d’Errico, A., Bartley, M., & Montgomery, S. (2013). Social-biological transitions: How does the social become biological? Longitudinal and Life Course Studies, 4(2), 136-146. doi:10.14301/llcs.v4i2.236.
Blane, D., Netuveli, G., & Stone, J. (2007). The development of life course epidemiology. Revue d’Épidémiologie et de Santé Publique, 55(1), 31-38. doi:10.1016/j.respe.2006.12.004. Blaylock, J. R., & Blisard, W. N. (1992). Self-evaluated health status and smoking behaviour.
Applied Economics, 24(4), 429-435.
Boerma, T., Hosseinpoor, A. R., Verdes, E., & Chatterji, S. (2016). A global assessment of the gender gap in self-reported health with survey data from 59 countries. BMC public health, 16(1), 675.
Börsch-Supan, A. (2019). Survey of Health, Ageing and Retirement in Europe (SHARE) Wave 1. Release version: 7.0.0. SHARE-ERIC. Data set. DOI: 10.6103/SHARE.w1.700
Börsch-Supan, A. (2019). Survey of Health, Ageing and Retirement in Europe (SHARE) Wave 3 - SHARELIFE. Release version: 7.0.0. SHARE-ERIC. Data set. DOI: 10.6103/SHARE. w3.700
Börsch-Supan, A. and Jürges, H. (Eds.). (2005). The Survey of Health, Ageing and Retirement in Europe – Methodology. Mannheim: Mannheim Research Institute for the Economics of Aging (MEA).
Börsch-Supan, A., A. Brugiavini, H. Jürges, J. Mackenbach, J. Siegrist and G. Weber. (2005). Health, ageing and retirement in Europe – First results from the Survey of Health, Ageing and Retirement in Europe. Mannheim: Mannheim Research Institute for the Economics of Aging (MEA).
Börsch-Supan, A., Brandt, M., Hank, K., Schröder, M. (eds.) (2011). The Individual and the Welfare State: Life Histories in Europe. Springer: Heidelberg.
Börsch-Supan, A., Brandt, M., Hunkler, C., Kneip, T., Korbmacher, J., Malter, F., Schaan, B., Stuck, S., Zuber, S. (2013). Data Resource Profile: The Survey of Health, Ageing and Retirement in Europe (SHARE). International Journal of Epidemiology DOI: 10.1093/ije/ dyt088.
Börsch-Supan, A., Brugiavini, A., Jürges, H., Kapteyn, A., Mackenbach, J., Siegrist, J., Weber, G. (eds.) (2008). Health, Ageing and Retirement in Europe– Starting the Longitudinal Dimension (2004-2007). MEA: Mannheim.
Braveman, P. A., Egerter, S. A., & Mockenhaupt, R. E. (2011). Broadening the focus. The need to address the social determinants of health. American Journal of Preventive Medicine, 40(1), S4–S18. doi:10.1016/j.amepre.2010.10.002.
Bricard, D., Jusot, F., Beck, F., Khlat, M., & Legleye, S. (2016). Educational inequalities in smoking over the life cycle: an analysis by cohort and gender. International Journal of Public Health, 61(1), 101-109.
Brockmann, H., & Klein, T. (2004). Love and death in Germany: The marital biography and its effect on mortality. Journal of Marriage and Family, 66(3), 567-581.
Burton-Jeangros, C., Cullati, S., Sacker, A., & Blane, D. (Eds.). (2015). A life course perspective on health trajectories and transitions (Vol. 4). Springer.
Bourdieu, P. (1986). The form of Capital. In J.G. Richardson, Handbook of Theory and research for the Sociology of education. Greenwood Press: New York.
Bourdieu, P. (1995). Ragioni Pratiche. Il Mulino: Bologna.
Chadwick, E. (1842). Report on the Sanitary Condition of the Labouring Population of Great Britain. London, England: W Clowes.
Chakravarty, E. F., Hubert, H. B., Krishnan, E., Bruce, B. B., Lingala, V. B., & Fries, J. F. (2012). Lifestyle risk factors predict disability and death in healthy aging adults. The American journal of medicine, 125(2), 190-197.
Clemente, C. & García-Pereiro, T. (2020). Introduzione alla sociologia dei corsi di vita. Milano: FrancoAngeli.
Cockerham, W. C. (2000). The sociology of health behavior and health lifestyles. In C. E. Bird, P. Conrad, A. M. Fremont (Eds.), Handbook of medical sociology (pp. 159–172), Upper Saddle River: Prentice-Hall.
Cockerham, W. C. (2005). Health lifestyle theory and the convergence of agency and structure. Journal of Health and Social Behavior, 46, 51-67.
Dahlgren G., Whitehead, M. (1993). Tackling inequalities in health: what can we learn from what has been tried? Working paper, King’s Fund, Ditchley Park, Oxfordshire. London. Dahlgren, G., Whitehead, M. (1991). Policies and strategies to promote social equity in health.
Institute for Future Studies. Available at: https://core.ac.uk/download/pdf/6472456.pdf. Darmon, N., Drewnowski, A. (2008). Does social class predict diet quality? Am J Clin Nutr, 87,
pp. 1107-1117. https://doi.org/10.1093/ajcn/87.5.1107
Darnton-Hill, I., Nishida, C., James, WP. (2004). A life course approach to diet, nutrition and the prevention of chronic diseases. Public Health Nutrition, 7, 1A, 101-21.
de Breij, S., Huisman, M., Deeg, D. J.H. (2020). Macro-level determinants of post-retirement health and health inequalities: A multilevel analysis of 18 European countries. Social science & Medicine, 245-112669.
DiMaggio, P. (1997). Culture and cognition. Annual Review of Sociology, 23, 263-287.
DiPrete, T., & Eirich, G. (2006). Cumulative advantage as a mechanisms for inequality: A review of theoretical and empirical developments. Annual Review of Sociology, 32, 271-300.
Donovan, J. E., Jessor, R., & Costa, F. M. (1993). Structure of health-enhancing behavior in adolescence – A latent-variable approach. Journal of Health and Social Behavior, 34(4), 346–362.
Elder, G. H., Johnson, M. K., & Crosnoe, R. (2003). The emergence and development of life course theory. In J. T. Mortimer & M. J. Shanahan (Eds.), Handbook of the life course (pp. 3–19). New York: Kluwer.
Elder, G. H., Jr. (1998). The life course as developmental theory. Child Development, 69, 1–12. Evans, R. G., Barer, M. L., & Marmor, T. R. (Eds.). (1994). Why are some people healthy and
others not?: The determinants of the health of populations. Transaction Publishers. Federico, B., Costa, G., & Kunst, A. E. (2007). Educational inequalities in initiation, cessation,
and prevalence of smoking among 3 Italian birth cohorts. American Journal of Public Health, 97(5), 838-845.
Fagerli, R. A., & Wandel, M. (1999). Gender differences in opinions and practices with regard to a” healthy diet”. Appetite, 32(2), 171-190.
Gagné, T., Quesnel-Vallée, A., & Frohlich, K. L. (2019). Considering the age-graded nature of associations between socioeconomic characteristics and smoking during the transition towards adulthood. Preventive Medicine, 123, 262-269.
Gillman, MW. (2004). A life course approach to obesity A life course approach to chronic disease epidemiology. 2 ed: Oxford University Press.
Gilman, S. E., Abrams, D. B., & Buka, S. L. (2003). Socioeconomic status over the life course and stages of cigarette use: initiation, regular use, and cessation. Journal of Epidemiology & Community Health, 57(10), 802-808.
Giskes, K., Avendano, M., Brug, J., & Kunst, A. E. (2009). A systematic review of studies on socioeconomic inequalities in dietary intakes associated with weight gain and overweight/obesity conducted among European adults. Obesity Reviews, 11(6), 413–429. Glouberman, S., & Millar, J. (2003). Evolution of the determinants of health, health policy, and
health information systems in Canada. American Journal of Public Health, 93(3), 388-392. Gopinath, B., Kifley, A., Flood, V. M., & Mitchell, P. (2018). Physical activity as a determinant
of successful aging over ten years. Scientific reports, 8(1), 1-5.
Graham, H., Francis, B., Inskip, H. M., Harman, J., & SWS Study Group. (2006). Socioeconomic lifecourse influences on women’s smoking status in early adulthood. Journal of Epidemiology & Community Health, 60(3), 228-233.
Harrell Jr, F. E. (2015). Regression modeling strategies: with applications to linear models, logistic and ordinal regression, and survival analysis. Springer.
Heinz W. R., & Krüger, H. (2001). Life course: Innovations and challenges for social research. Current sociology, 49(2), 29-45.
Hiscock, R., Bauld, L., Amos, A., Fidler, J. A., & Munafò, M. (2012). Socioeconomic status and smoking: a review. Annals of the New York Academy of Sciences, 1248(1), 107-123. Holt-Lunstad, J., Smith, T.B., Layton, J.B. (2010). Social relationships and mortality risk: a
meta-analytic review. PLoS Med. 7, e1000316.
Hosseinpoor, A. R., Williams, J. S., Amin, A., De Carvalho, I. A., Beard, J., Boerma, T.,… & Chatterji, S. (2012). Social determinants of self-reported health in women and men: understanding the role of gender in population health. PloS one, 7(4).
Huijts, T., & Kraaykamp, G. (2011). Marital status, nation marital status composition, and self-assessed health: a multilevel test of four hypotheses in 29 European countries. European Societies, 13(2), 279-305.
IHME. (2018). Findings from the Global Burden of Disease Study 2017. Institute for Health Metrics and Evaluation Seattle, United States: (http://vizhub.healthdata.org/gbdcompare/, accessed 25 Feb 2020).
Jefferis, B. J., Power, C., Graham, H., & Manor, O. (2004). Changing social gradients in cigarette smoking and cessation over two decades of adult follow‐up in a British birth cohort. Journal of Public Health, 26(1), 13-18.
Johansson, L., Thelle, D. S., Solvoll, K., Bjørneboe, G. E. A., & Drevon, C. A. (1999). Healthy dietary habits in relation to social determinants and lifestyle factors. British Journal of Nutrition, 81(3), 211-220.
Kawachi, I. (1999). Social capital and community effects on populations and individual health. Annals of the New York Academy of sciences, 896.
Kino, S. Bernabé, E., Sabbah, W. (2018). The role of healthcare and education systems in co-occurrence of health risk behaviours in 27 European countries. Eur J Public Health, 28(1),186–92.
Kuh, D., Ben-Shlomo, Y., Lynch, J., Hallqvist, J., & Power, C. (2003). Life course epidemiology. Journal of Epidemiology and Community Health, 57(10), 778–783.
Kuh, D., Karunananthan, S., Bergman, H. (2014). A life-course approach to healthy ageing: maintaining physical capability. Proceedings of the Nutrition. Society. 73(2), 237-48. Lalonde, M. (1974). A New Perspective on the Health of Canadians. Ottawa, Ontario, Canada:
Minister of Supply and Services.
Lallukka, T., Laaksonen, M., Rahkonen, O., Roos, E., & Lahelma, E. (2007). Multiple socio-economic circumstances and healthy food habits. European Journal of Clinical Nutrition, 61(6), 701-710.
Lillard, L. A., & Panis, C. W. (1996). Marital status and mortality: The role of health. Demography, 33(3), 313-327.
Lizardo, O. (2004). The cognitive origins of Bourdieu’s habitus. Journal for the Theory of Social Behaviour, 34(4), 375-401.
Lynch, J., & Smith, G. D. (2005). A life course approach to chronic disease epidemiology. Annu. Rev. Public Health, 26, 1-35.
Lynch, S.M. (2003). Cohort and life-course patterns in the relationship between education and health: a hierarchical approach. Demography, 40(2), 309-31.
Mackenbach, JP. (2005). Health inequalities: Europe in profile. London: UK Presidence of the EU.
Markides, K. S., & Rote, S. (2019). The healthy immigrant effect and aging in the United States and other western countries. The Gerontologist, 59(2), 205-214.
Marmot, M., Allen, J., Bell, R., Bloomer, E., & Goldblatt, P. (2012). WHO European review of social determinants of health and the health divide. The Lancet, 380(9846), 1011-1029. McKay, L. (2000). Health Beyond Health Care: Twenty Five Years of Federal Health Policy
Development. Ottawa, Ontario, Canada: Canadian Policy Research Networks.
McKeown, T. (1979). The Role of Medicine: Dream, Mirage or Nemesis? Oxford, England: Basil Blackwell.
Missinne S., Neels K., Bracke P. (2014). Reconsidering inequalities in preventive health care: An application of cultural health capital theory and the life course perspective. Sociology of Health & Illness, 36(8), 1259-1275.
Missinne S. (2015). Moving Towards a Better Understanding of Socioeconomic Inequalities in Preventive Health Care Use: A Life Course Perspective. In Burton-Jeangros C., Cullati S., Sacker A., & Blane D. (eds.), A Life Course Perspective on Health Trajectories and Transitions, Springer, Switzerland.
Moullan, Y., & Jusot, F. (2014). Why is the ‘healthy immigrant effect’ different between European countries?. The European Journal of Public Health, 24(suppl_1), 80-86.
Navickas, R., Petric, V.-K., Feigl, A.B., Seychell, M. (2016). Multimorbidity: what do we know? What should we do? J. Comorbidity, 6, 4-11.
Nickoloff, B. (1996). Health Canada. Towards a Common Understanding: Clarifying the Core Concepts of Population Health: A Discussion Paper. Ottawa, Ontario, Canada: Health Canada.
Pampel, F. C., Bricard, D., Khlat, M., & Legleye, S. (2017). Life course changes in smoking by gender and education: A cohort comparison across France and the United States. Population Research and Policy Review, 36(3), 309-330.
Phelan J. C., Link B. G., Diez-Roux A., Kawachi I., & Levin B. (2004). Fundamental causes” of social inequalities in mortality: A test of the theory. Journal of Health and Social Behavior, 45, 265-285.
Raghupathi, V., & Raghupathi, W. (2020). The influence of education on health: an empirical assessment of OECD countries for the period 1995–2015. Archives of Public Health, 78(1), 1-18.
Raphael, D., & Bryant, T. (2015), Power, intersectionality and the life-course: Identifying the political and economic structures of welfare states that support or threaten health. Social Theory Health, 13, 245-266.
Romanow, R. (2002). Building on Values: The Future of Health Care in Canada. Ottawa, Ontario, Canada: Commission on the Future of Health Care in Canada.
Ross, C., & Wu, CL. (1995). The links between education and health. Am Soc Rev, 60(5), 719-45. Sabia, S., Singh-Manoux, A., Hagger-Johnson, G., Cambois, E., Brunner, E. J., & Kivimaki, M.
(2012). Influence of individual and combined healthy behaviours on successful aging. Cmaj, 184(18), 1985-1992.
Sand, G., & Gruber, S. (2018). Differences in subjective wellbeing between older migrants and natives in Europe. Journal of Immigrant and Minority Health, 20, 83-90. doi:10.1007/ s10903-016-0537-5
Santini, Z. I., Jose, P. E., Koyanagi, A., Meilstrup, C., Nielsen, L., Madsen, K. R., & Koushede, V. (2020). Formal social participation protects physical health through enhanced mental health: A longitudinal mediation analysis using three consecutive waves of the Survey of Health, Ageing and Retirement in Europe (SHARE). Social Science & Medicine, 251(C). Shaw, B. A., & Spokane, L. S. (2008). Examining the association between education level and
physical activity changes during early old age. Journal of aging and health, 20(7), 767-787. Shim, J. K. (2010). Cultural health capital: A theoretical approach to understanding health
care interactions and the dynamics of unequal treatment. Journal of Health and Social Behavior, 51, 1-15.
Singh-Manoux, A., & Marmot, M. (2005). Role of socialization in explaining social inequalities in health. Social Science & Medicine, 60(9), 2129-2133.
Schröder, M. (Ed.) (2011). Retrospective data collection in the Survey of Health, Ageing and Retirement in Europe. SHARELIFE methodology. Mannheim: Mannheim Research Institute for the Economics of Aging (MEA).
Smith, K.P., Christakis, N.A. (2008). Social networks and health. Annu. Rev. Sociol., 34, 405–429. Thoits, P.A. (2011). Mechanisms linking social ties and support to physical and mental health.
J. Health Soc. Behav, 52, 145-161.
Tokgozoglu, L., Hekimsoy, V., Costabile, G., Calabrese, I., Riccardi, G. (2020). Diet, Lifestyle, Smoking. In Handbook of Experimental Pharmacology. Springer, Berlin, eidelberghttps:// doi.org/10.1007/164_2020_353
Tomelleri, S. (2019). Quando l’habitus fa il monaco: mutamenti sociali, stili di vita e disuguaglianze. BioLaw Journal-Rivista di BioDiritto, 17(2), 65-76.
Walker, A. (2005). A European perspective on quality of life in old age. European Journal of Ageing, 2(1), 2-12.
Weber, M. (1922). Economia e società. trad. it. Edizioni di Comunità: Milano.
WHO, CSDH. (2008). Closing the gap in a generation: health equity through action on the social determinants of health: final report of the CDSH. WHO, Geneva.
WHO. (2007). The determinants of Health. Geneva
WHO. (2014). Global status report on noncommunicable diseases 2014. Geneva.
WHO. (2018). Global action plan on physical activity 2018–2030: more active people for a healthier world. Geneva.
WHO. (2019a). WHO global report on trends in prevalence of tobacco use 2000-2025. Geneva. WHO. (2019b). European Tobacco use. Trends Report 2019. Copenhagen.
Williams, S. J. (1995). Theorizing class, health and life-styles - Can Bourdieu help Us. Sociology of Health & Illness, 17(5), 577-604.