An EPR study on ancient and newly synthesised Egyptian blue
Emilio F. Orsega
∗, F. Agnoli, G.A. Mazzocchin
Dipartimento di Chimica Fisica, Universit`a Ca’Foscari di Venezia, Calle Larga S. Marta 2137, 30123 Venezia, Italy
Received 21 January 2005; received in revised form 2 May 2005; accepted 8 June 2005 Available online 1 August 2005
Abstract
Two sets of ancient roman Egyptian blue (EB) samples and one set of EB samples synthesised in our lab, were analysed by EPR spectroscopy, a technique not commonly used in this field. The spectroscopic parameters obtained were used to attempt the discrimination of the provenance and of the manufacturing techniques of the investigated samples.
The results obtained show that EPR technique could be very useful for this purpose.
Furthermore, the similarity of the obtained parameters between the ancient and new samples testify the successful attempt to reproduce the EB according to the chemical knowledge.
© 2005 Published by Elsevier B.V.
Keywords: EPR; Egyptian blue; Synthesis
1. Introduction
1.1. Egyptian blue
The number of reports dealing with Egyptian blue (EB herein) has been remarkably increasing in the last few years, also on non-specialised journals. It is not surprising in view of the growing interest in ancient things and on the techniques employed in the past.
EB appeared in Egypt during the third millennium before the Common Era and was used at least for 3000 years as a precious pigment, spreading in the whole Roman Empire. After the decline of the Roman Empire itself, the use of this synthetic pigment disappeared. This seems to be related to the loss of the chemical and technological knowledge required for the synthesis of this pigment.
At the beginning of the XX century, Fouqu`e[1]and Laurie et al.[2]attempted both the synthesis of this compound and the study of the effects of cooking temperature and of the concentration of the fluxes.
The use of X-rays[3]allowed the characterisation of EB as a calcium-copper tetrasilicate (CaCuSi4O10). Moreover, ∗Corresponding author. Tel.: +39 041 234 8601; fax: +39 041 234 8594.
E-mail address: [email protected] (E.F. Orsega).
it allowed to ascertain that EB and the mineral cuprorivaite, discovered by Minguzzi in the Vesuvio lava in 1938[4], are actually the same material.
In more recent years, many researchers got involved into the production and characterisation of EB with different procedures and techniques of analysis [5–14], but there is not a final conclusion yet about the role of the different materials and melting temperature. Moreover, to the best of our knowledge, there is only one paper dealing with an EPR study of an EB sample, and just as a part of an investigation using different spectroscopic techniques
[15].
1.2. Samples of the present investigation
The ancient EB samples of the present investigation come from roman wall paintings, which are all dating back to the period between the I century before the C.E. and the II century of the C.E.
The sets of the studied samples were labelled as follows. Set N: five samples coming from North-Eastern Italy (the ancient roman X regio Venetia et Histria), in particular from the cities of Verona (two samples from two different sites, N1 and N2), Vicenza (N3), Pordenone (N4) and Trieste
0039-9140/$ – see front matter © 2005 Published by Elsevier B.V. doi:10.1016/j.talanta.2005.06.001
(N5). Group S: three samples coming from the Southern Italy, one from the Museum of Naples (S1, surely made in the Naples region) and two from the city of Pompei (S2 and S3). Group M: six modern samples (from M1 to M6), synthesised according to different recipes (see Section
2). All the samples were synthesised in our lab, with the exception of M1, which was kindly provided by Prof. Baraldi.
1.3. EPR spectroscopy
Electron spin resonance (ESR) – or electron paramag-netic resonance (EPR) – is a spectroscopic technique which allows to detect and characterise molecules or ions containing unpaired electrons, namely paramagnetic substances, such as radicals and many transition metal ions[16,17]. This tech-nique analyses the paramagnetic samples without altering or destroying them. This is essential when dealing with archae-ological samples, since the researchers are allowed to get back the samples after the measurements without any kind of alteration or damage.
As far as this paper is concerned, we were mainly inter-ested in the EPR characteristics of the Cu2+ paramagnetic ion in EB. EPR can detect, as spectral lines, the transitions allowed between electronic spin states, when an external static magnetic field H is applied.
The most important EPR characteristic spectral parame-ters are:
(a) the number of lines (one or more, depending on the inter-action of the electronic unpaired spin with zero or non-zero spin nuclei, respectively (hyperfine interaction); (b) the position of the spectrum centre with respect to
exter-nal magnetic field, H (measured in gauss, G), defined through an adimensional parameter called g-factor; (c) the distance between the lines (in gauss units) due to the
hyperfine interaction;
(d) the line widths (peak to peak, in gauss units).
In the case of polycrystalline (as like as the samples stud-ied in this paper) or amorphous samples, each line is usually characterised by three components (one for each reference axis), in some cases unresolved, defined by three different values of the g-factor, gx, gyand gz, related to the ligand field
geometry. When the ligand geometry has an axial symmetry
gx= gy; the spectral line is characterised by the two
compo-nents of g: g⊥(perpendicular or transversal) and g||(parallel or longitudinal).
This work deals with the application of the EPR tech-nique to get information useful to characterise and classify EB samples. Three easily measurable spectral parameters, allowed us to compare ancient roman EB samples of different provenance and to verify in this way whether it was possi-ble to classify them. Furthermore, the comparison between ancient and modern samples, synthesised according to dif-ferent recipes, was performed.
2. Experimental
The archaeological samples were obtained, as dry fine powder, by a gentle scraping of the painted surface of the wall fragments. The carbonates due to the mortar substrates were eliminated by treating the samples with a 1 M HCl solution followed by repeated washing with water. This treatment was performed since the un-washed EB samples showed spurious spectra (Section3).
The synthetic samples were obtained according to the recipes reported in detail by Mazzocchin et al.[14], which can be summarised as follows:
• M1: stoichiometric ratio of Si/Ca/Cu, with malachite as
copper source[13];
• M2: stoichiometric ratio of Si/Ca/Cu, with malachite as
copper source[14];
• M3: “Bolognese mixture”[14];
• M4: with silica gel[14], according to the recipe by Schippa and Torraca[5];
• M5: stoichiometric ratio of Si/Ca/Cu, with KCl as flux
[14];
• M6: stoichiometric ratio of Si/Ca/Cu, with CuO as copper
source.
2.1. Electron paramagnetic resonance (EPR)
EPR spectra were recorded at room temperature, since the comparison with a reference spectrum of EB[15]taken at 77◦K did not show any relevant differences in the line shape and resolution. We used a Bruker E 200D X-band spectrom-eter equipped with a TE102microwave resonant cavity. The
instrumental parameters were the following: magnetic field range: 300–4800 G; microwave power: 20 mW; modulation amplitude: 2 G; sweep time: 300 s.
EB samples, each of about 20 mg of fine powder, were put in the resonant cavity inside quartz tubes of 4 mm internal diameter. A suitable amount of DPPH ( ␣,␣-diphenyl--picryl-hydrazyl) powder was used as a reference (g = 2.0036± 0.0002) for the calculation of the components of g[16].
The spectra were digitally recorded, analysed and decon-voluted using Win-EPR SimFonia software, kindly provided by the Bruker Co., and refined by means of Microcal Origin Pro 6.1 software.
2.2. Energy dispersion X-rays spectroscopy (EDS)
EDS analysis were carried out using a Jeol (Tokyo, Japan) JSM 5600 LV scanning electron microscope equipped with an Oxford Instruments 6587 EDS microanalysis detector. The analyses were performed in low vacuum conditions where samples did not show charging. EDS microanalysis was made to obtain information on the elemental composition of the sample and the spectra were collected using ISIS software and refined using Microcal Origin Pro 6.1 software.
2.3. Infrared Spectroscopy (FT-IR)
Absorption spectra in the IR region were collected using a Nicolet Magna 75 FT-IR spectrometer. Thirty-two signal-averaged scans were acquired on the samples. Few milligrams of each sample were diluted in KBr (IR grade, Merck) pellet of a diameter of about 13 mm.
3. Results and discussion
3.1. EPR spectral pattern
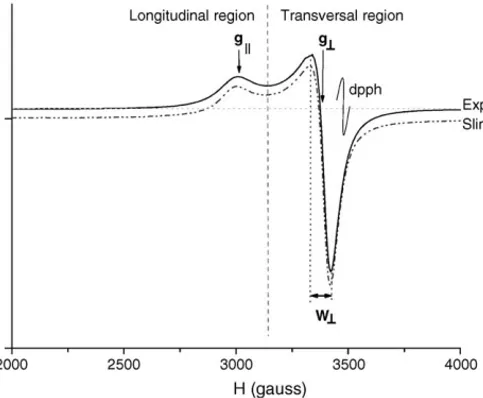
At first sight, the spectra of N, S and M sets of samples (recorded after the chemical treatment with HCl) seemed to be very similar among themselves and to the pattern shown inFig. 1.
Each spectrum consists of two absorption lines, respec-tively, corresponding to the components parallel (or longitu-dinal) and perpendicular (or transversal) (Fig. 1). This is in agreement with the presence of a unique copper(II) param-agnetic species, with an unpaired electron in the d9 orbital and in the B1gground state of an apparent D4h axial ligand
field geometry[15]. The spectra appear totally unresolved in their hyperfine components, because of the strong spin–spin interaction due to the very high Cu2+density. The ranges of the measured values of g||= 2.32–2.34 and g⊥= 2.055–2.060 are consistent with a ligand field either in octahedral or in square planar geometry[16,17]. These features are in agree-ment with the EPR characterisation of an ancient EB sample carried out by Mirti et al.[15], where a square planar geome-try of the ligand field was stated. The high values (≈4) of the parameter G = (g||− 2)/(g⊥− 2), according to the model by Procter et al.[18,19], should suggest an octahedral geometry,
Fig. 1. EPR experimental (solid line) and simulated (dotted line) spectrum of an EB sample, with the indication of the three parameters used for the characterisation.
but this is not relevant for the aims of the present work. With the above mentioned spectral features we performed simula-tions very well fitting the experimental spectra, as shown in the exemplum ofFig. 1.
3.2. Spurious spectra
Some of the studied samples showed some differences in the EPR line shapes, not in agreement with the typical one for this kind of geometry[15–17]. We hypothesised the presence of some signal superimposed to the one described above for Cu2+ ion in EB, since both the theoretical assessment and the simulation attempts did not give satisfactory results. The chemical treatment with a 1 M HCl solution for 1 h, and the following repeated rinse with distilled water, allowed us to eliminate almost all the spurious signals. This procedure was applied to all the samples.
As an example, inFig. 2the spectral patterns of the sample S1 before (A) and after (B) the chemical treatment are shown. The difference between the patterns (A–B), corresponds to the quenched spurious signal and is consistent with the pres-ence of a paramagnetic Fe3+ complex, probably due to the presence of traces of the mortar substrate in the pigment sam-ples. This hypothesis was also confirmed by a study on the EB supporting mortars in which the presence of significant amounts of Fe3+was detected, corresponding to a very large and unresolved EPR line centered at g≈ 2[20].
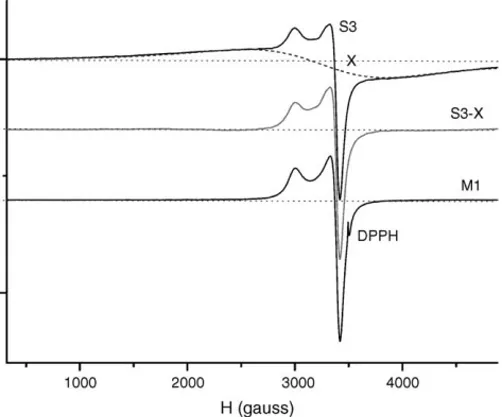
Some samples kept a residual spurious signal (Type 2 herein) even after the chemical treatment. A deconvolution analysis allowed us to simulate, for each sample, the spurious signal and, by subtracting it from the experimental spectrum, to evaluate the spectral pattern in absence of type 2 interfer-ing spurious signal. As an example, inFig. 3the experimental
Fig. 2. EPR spectral patterns of N4 sample before (A) and after (B) the chemical treatment with HCl 1 M. A–B representing the difference between A and B.
Fig. 3. EPR spectrum of S3 sample, which presents a superimposed spurious spectral line, simulated as X. The S3-X line represents the difference between S3 and X.
spectrum of S3, the simulated spurious spectrum X and their difference, S3-X, are shown. The last spectrum is very similar to the ones obtained after chemical treatment (see M1 sample spectrum inFig. 3). The X line is characterized by param-eters consistent with the presence of a copper(II) complex with parallel and longitudinal components totally unresolved. This could be due to the presence of a fraction of very high density Cu(II) clusters, as like as “clots in an unsuccessful pudding”.
3.3. Useful parameters for the classification of the samples
The calculation of g and linewidth components (g⊥, g||,
W⊥, W||, respectively) could be done trough an assignment by means of repeated simulation, until they fit the experimen-tal spectra, as shown inFig. 1. Since the simulation processes are time consuming, the values of only three parameters, g⊥,
g||and W⊥will be considered first. Those values can be easily and directly obtained from the experimental spectrum, with a little error (see Fig. 1). Simulation techniques should be employed only for cases in which a more refined determi-nation of the parametric values is required, i.e. for W||, the measurement of which can be affected by a relevant error if directly performed on the spectra.
Standard deviations of 0.001 for the g values, and of 1 G for the W⊥linewidth values were evaluated.
3.4. Classificatory analysis
InFigs. 4 and 5, respectively, g⊥versus W⊥and g||versus
W⊥plots are shown. The simulations show that the superim-posed type 2 spurious signal does not affect the parameters measured for the experimental spectrum M5. On the
con-Fig. 4. Plot of g longitudinal component values (g||) vs. the line width of the transversal component (W⊥) of the EPR spectra for all the EB tested samples.
trary, the big errors in the measurement of the M6 sample, which was then eliminated from this analysis, are due to this signal.
The parameters concerning the sample S3 are also affected by the type 2 superimposed signal, but this effect does not compromise its assignment zone (see below).
All the parameters values reported in the plots concern the spectra of the samples after carbonate elimination. In both plots inFigs. 4 and 5we can recognize three separated zones. In the first one (top-right), here named zone 1, all the S roman samples are localized. In the second zone (bottom-left, zone 2), we find all the N roman samples, except the two from Verona (N1 and N2). These latter are localized in a third zone (top-left, zone 3). All the newly synthesised samples M appear grouped in a cluster that is central respect to the other samples and mainly superimposed to the zone 2.
Fig. 5. Plot of g transversal component values (g⊥) vs. the line width of the transversal component (W⊥) of the EPR spectra for all the EB tested samples.
On the one hand, these results are in a good agreement with the results obtained by means of FT-IR spectroscopy, while on the other hand EDS spectra did not show any significant corre-lation for the discrimination of the samples according to their geographical provenance. It is worth noting, on the contrary, that the plot in which Cu versus Ca peak areas are compared, an extreme position of N1 and N2 samples is shown with respect to all the other samples, and this is in agreement with the fact that they belong to the separate EPR zone 3.
4. Conclusions
The experimental results show that EPR spectroscopy can be useful in the characterisation of EB samples and also to get interesting information on the similarity degree inside a set of samples, in order to give complementary suggestions to the archaeological research.
In particular:
(a) The peculiar shape of EB EPR spectrum, which is very different from the ones of all the other blue pigments (some of which are not EPR detectable), allows the iden-tification of the EB pigment.
(b) The clustering of the two samples N1 and N2 in a dif-ferent zone of the plot than the other N samples suggests manufacturing techniques or at least different periods with respect to the samples coming from other sites of the Roman X regio Venetia et Histria, namely N3, N4 and N5. Therefore, the distance from the points representing N1 and N2 in the plots seems to suggest that the two samples recovered in Verona city most likely come from different workshops and/or periods.
(c) The clustering of the S set of samples in the same zone should indicate a close proximity in both their manufac-turing technique and period, as also suggested by their geographical provenance.
(d) The distribution of the M set of samples (as shown in
Figs. 4 and 5), which were obtained according to different recipes, shows that the related EPR parameters values are in the zones of the ancient samples.
It is worth noting that the attempt to reproduce the EB by availing of the modern chemical knowledge was
success-ful. This could also be evidence that many recipes to obtain EB pigments did exist in the Roman Empire period. The wider distribution in the parametric values of the examined Roman samples with respect to the M set of samples can be explained by considering that Roman craftsmen did not calculate, of course, the stoichiometry of components, as a modern chemist would do, but they simply used empirical recipes, which were rather variable, depending on the region, the period and the school.
References
[1] F. Fouqu´e, Bulletin de la Societ´e de Min´eralogie 12 (1889) 36–38. [2] A.P. Laurie, W.F.P. McLintock, F.D. Miles, Proc. Roy. Soc. (London)
89 (1914) 418–429.
[3] F. Mazzi, A. Pabst, Am. Mineral. 47 (1962) 409. [4] C. Minguzzi, Periodico di Mineralogia 8 (1938) 333–345. [5] G. Schippa, G. Torraca, Bollettino dell’Istituto Centrale di Restauro
31–32 (1957) 97–107.
[6] H.G. Wiedemann, G. Bayer, Anal. Chem. 54 (1982) 619A–620A, 622A, 624A, 626A, 628A.
[7] M. Tite, M. Binson, M.R. Cowell, in: J.B. Lamber (Ed.), Archaeo-logical Chemistry, Anal. Chem. Soc., Washington 3 (1984) 215. [8] D. Ullrich, PACT 17, II.3.1 (1987) 323–332.
[9] F. Delamare, Scienze e materiali del patrimonio culturale 4 (1998) 177–195.
[10] F. Delamare, Scienze e materiali del patrimonio culturale 4 (1998) 143–163.
[11] J. Riederer, Egyptian blue, Artists’ Pigments: a handbook of their history and characteristics 3 (1997) 23–45.
[12] S. Bruni, F. Cariati, F. Casadio, L. Toniolo, Vib. Spectrosc. 20 (1999) 15–25.
[13] P. Baraldi, F. Bondioli, C. Fagnano, A.M. Ferrari, A. Tinti, M. Vinella, Annali di Chim. 91 (2001) 679–692.
[14] G.A. Mazzocchin, D. Rudello, C. Bragato, F. Agnoli, J. Cultural Heritage 5 (2004) 129–133.
[15] P. Mirti, L. Appolonia, A. Casoli, R.P. Ferrari, E. Laurenti, A. Amisano Canesi, G. Chiari, Spectrochim. Acta 51A (No 3) (1995) 437–446.
[16] B.R. McGarvey, Electron spin resonance of transition-metal com-plexes, in: Transition Metal Chemistry, vol. 3, Marcel Dekker, New York, 1966, pp. 89–201.
[17] Abragam, E. Bleaney, Electron Paramagnetic Resonance of Transi-tion Ions, Oxford University Press, London, 1970.
[18] M. Procter, B.J. Hathaway, P. Nicholls, J. Chem. Soc. A (1968) 1678–1684.
[19] B.J. Hathaway, D.E. Billing, Coordin. Chem. Rev. 5 (1970) 143–207. [20] Unpublished results by the authors of this paper.