PHOTOCATALYTIC
OXIDATION OF ORGANIC
POLLUTANTS UNDER
VISIBLE LIGHT
IRRADIATION: FROM
N-DOPED TIO
2
PHOTOCATALYSTS TO THE
DESIGN OF A CONTINUOUS
FIXED BED REACTOR
STUDI DI SALERNO
Department of Industrial Engineering
Ph.D. Course in Chemical Engineering
(XIII Cycle-New Series)
PHOTOCATALYTIC OXIDATION OF
ORGANIC POLLUTANTS UNDER VISIBLE
LIGHT IRRADIATION: FROM
N-DOPED TIO
2PHOTOCATALYSTS TO THE
DESIGN OF A CONTINUOUS FIXED BED
REACTOR
Supervisor
Ph.D. student
Prof. Diana Sannino
Olga Sacco
Scientific Referees
Prof. Paolo Ciambelli
Prof. Dionysios D. Dionysiou
Ph.D Vincenzo Vaiano
Ph.D. Course Coordinator
“I poeti dicono che la scienza rovina la
bellezza delle stelle, riducendole solo ad ammassi
di atomi di gas. Solo? Anche io mi commuovo a
vedere le stelle di notte nel deserto, ma vedono di
meno o di più?[..]
Richard Feyman
“Nobel per la fisica 1965”
contributo alla comprensione nella natura della luce
Sono ora giunta al mio terzo step accademico, ma non si è ancora spenta la “curiositas “ scientifica che mi spinge ogni giorno a pensare di poter fabbricare un mondo migliore. Sicuramente un pensiero utopistico, ma il motivatore migliore che mi ha risollevato anche in alcuni momenti bui.
Perciò pongo i miei ringraziamenti più fervidi innanzitutto a me stessa che ho saputo apprezzare e valorizzare l’aiuto e i consigli di tutti coloro che hanno contribuito alla realizzazione di questo lavoro.
Un sincero grazie va alla mia famiglia universitaria, in modo particolare al mio super tutor “ST”, Vincenzo con cui si è creata una sitonia lavorativa magica; la Prof. Sannino che ha saputo coltivatare il mio entusmio, assecondando la mia indole creativa. Giusy e Peppe che con i loro consigli e la loro simpatia hanno reso indimenticabili anche giornate che sembravano anonime. Vorrei ringraziare inoltre Rosaria e Nico che, pur non coinvolti nella mia attività di ricerca, hanno allietato questi tre anni di attività.
Infine ringrazio il Prof. Paolo Ciambelli, per aver reso possibile la realizzazione di questo lavoro.
Publications list
1. Sacco, O. ; Stoller, M.; Vaiano, V. ; Ciambelli, P. ; Chianese, A.; Sannino, D. Photocatalytic degradation of organic dyes under visible light on n-doped TiO2 photocatalysts International Journal of
Photoenergy Volume 2012, 2012, Article number 626759
2. Sannino D; Vaiano V.; Sacco, O.; Ciambelli, P. Mathematical modelling of photocatalytic degradation of methylene blue under visible light irradiation Journal of Environmental Chemical
Engineering Volume 1, Issue 1-2, 2013, Pages 56-60
3. Vaiano V.; Sacco O.; Stoller M.; Chianese A.; Ciambelli P., and Sannino D.
Influence of the photoreactor configuration and of different light sources in the photocatalytic treatment of highly polluted wastewater
International Journal of Chemical Reactor Engineering 2013;
11(1): 1–13doi 10.1515/ijcre-2013-0090
4. Rizzo, L. , Sannino, D. , Vaiano, V., Sacco, O., Scarpa, A., Pietrogiacomi, D. Effect of solar simulated N-doped TiO2photocatalysis on the inactivation and antibiotic resistance of an E. coli strain in biologically treated urban wastewater
Applied Catalysis B: Environmental Volume 144, January 2014,
Pages 369-378
5. Vaiano, V.; Sacco, O.; Sannino, D.; Ciambelli, P.; Longo, S.; Venditto, V.; Guerra, G. N-doped TiO2/s-PS aerogels for photocatalytic degradation of organic dyes in wastewater under visible light irradiation Journal of Chemical Technology and
Biotechnology Volume 89, Issue 8, August 2014, Pages 1175-1181
6. Vaiano, V.; Sacco, O.; Sannino, D.; Ciambelli, P.; Increasing the photoactivity of N-doped TiO2 photocatalysts using phosphors as light carriers Chemical Engineering Transactions Volume 39, Issue Special Issue, 2014, Pages 619-624
7. Vaiano, V.; Sacco, O.; Sannino, D.; Ciambelli, P.; Photocatalytic
removal of spiramycin from wastewater under visible light with N-doped TiO2 photocatalysts Chemical Engineering Journal
8. Sacco O.; Vaiano, V. ; Han C.; Sannino D; Dionysiou, D.D.; Photocatalytic removal of atrazine using N-doped TiO2 supported on phosphors Applied Catalysis B: Environmental Volume 164, March 01, 2015, Pages 462-474
9. Vaiano, V.; Sacco, O.; Sannino, D.; Ciambelli, P. Process
intensification in the removal of organic pollutants from wastewater using innovative photocatalysts obtained coupling ZnS-based phosphors with nitrogen doped semiconductors Journal of Cleaner
removal of Organic Dyes using nanostructured N-doped TiO2 coated on glass spheres Environmental Science and Pollution Research 11. Sacco O.; Vaiano, V. ; Han C.; Sannino D; Dionysiou, D.D.; Long
Afterglow green phosphors functionalized with Fe-N Doped TiO2 for the photocatalytic removal of emerging contaminants Chemical
Engineering Transactions
I
Introduction ... 1
I.1
Advanced oxidation processes (AOPs) ... 3
I.1.1
Basic Principles ... 4
I.2
Fundamental Engineering Aspects ... 8
I.2.1
Photoreactor Geometries ... 9
I.2.2
Modeling of Photocatalytic Reactors ... 17
I.3
Aim of the Work ... 19
II
Sol-gel synthesis and characterisation techniques ... 21
II.1
Sol-gel process ... 21
II.1.1
XRD powder diffraction ... 22
II.1.2
UV-vis Diffuse Reflectance Spectroscopy... 27
II.1.3
Surface area and pore structure evaluation by gas
adsorption
... 28
II.1.4
Electron microscopy ... 32
II.1.5
The Raman spectroscopy ... 35
II.1.6
Infrared spectroscopy (FTIR) ... 41
II.1.7
Dynamic light scattering (DLS) ... 44
III
Nitrogen
doped
TiO
2photocatalysts:
synthesis
characterization and optimization ... 53
II
characterization ... 53
III.1.1
UV-vis spectra ... 54
III.1.2
Micro-Raman spectroscopy ... 55
III.1.3
Fourier Transform Infrared (FTIR) spectroscopy .
... 57
III.1.4
XRD measurements ... 59
III.1.5
Specific surface area (BET) ... 61
III.1.6
Discussion ... 61
III.2
Optimitation of samples preparation ... 62
III.2.1
Termogravimetric analyses ... 63
III.2.2
Point of zero charge (PZC) ... 64
III.2.3
TEM ... 65
IV
Experimental Results: Photocatalytic tests on N-doped
TiO
2... 67
IV.1
Photocatalytic Degradation of Organic Dyes under
visible light irradiation ... 67
IV.1.1
Photocatalytic Activity Tests under Visible Light ..
... 68
IV.2
Photocatalytic
removal
of
spiramycin
from
wastewater under visible light with N-doped TiO
2photocatalysts 76
IV.2.1
Photocatalytic Activity Tests under Visible Light ..
... 77
IV.3
Effect
of
solar
simulated
N-doped
TiO
2photocatalysis on the inactivation and antibiotic resistance of an E.
coli strain in biologically treated urban wastewater ... 82
inactivation tests ... 84
IV.3.4
Comparison among catalysts ... 86
IV.4
Effect of photocatalytic process on antibiotic
resistance
... 88
V
Mathematical modelling of photocatalytic degradation
of model solution ... 91
V.1
Mathematical modelling of photocatalytic degradation
of MB under visible light irradiation ... 91
V.1.1
Photocatalytic tests ... 92
V.1.2
Experimental photocatalytic tests ... 93
V.1.3
Adsorption of methylene blue in dark conditions 95
V.1.4
Mathematical modelling ... 96
V.2
Mathematical modelling of photocatalytic degradation
of MB under visible light irradiation ... 100
V.2.1
Photocatalytic tests ... 100
V.2.2
Adsorption in dark condition of SP ... 100
V.2.3
Evaluation of rate constant ... 101
VI
Photocatalytic degradation of highly polluted
wastewater ... 105
VI.1
Experimental set up apparatus and photocatalytic
tests conditions ... 105
VI.1.1
Photocatalytic tests ... 106
VI.1.2
Experimental results ... 109
VI.1.3
Mathematical modelling ... 111
VII
Limitations of the photocatalytic process in slurry
reactors
... 121
IV
of N-TiO
2particles in aqueous suspensions in presence of visible
light irradiation ... 121
VII.1.1
Photocatalytic activity test ... 123
VII.1.2
Selection of dispersing agent ... 123
VII.1.3
Particles size analysis in aqueous phase ... 124
VII.1.4
Photocatalytic activity results ... 130
VII.2
N-doped TiO
2/s-PS aerogels for photocatalytic
degradation of organic dyes in wastewater under visible light
irradiation
... 134
VII.2.1
.
N-doped
TiO
2nanocomposite
aerogels
preparation
... 135
VII.2.2
Photocatalytic activity tests ... 135
VII.2.3
. Samples characterization ... 136
VII.2.4
Photocatalytic activity results ... 140
VII.3
Increasing the photoactivity of N-doped TiO
2photocatalysts using phosphors as light carriers ... 147
VII.3.1
Preparation of N-doped TiO
2supported on
phosphors
... 147
VII.4
Photocatalytic activity tests ... 160
VII.5
Photocatalytic removal of atrazine using N-doped
TiO
2supported on phosphors ... 165
VII.5.1
Evaluation of photocatalytic activity ... 165
VII.5.2
Analytical method ... 165
VII.5.3
Photocatalytic activity of N-TiO
2/ZSP catalysts ....
... 166
... 177
VIII.1.1
Sol–gel synthesis ... 178
VIII.1.2
Immobilization of N-TiO
2on glass spheres .... 178
VIII.1.3
Photocatalytic activity tests ... 179
VIII.2
Optimization
of
N-TiO
2sol-gel
synthesis
temperature for the coating process ... 180
VIII.2.1
Samples characterization ... 180
VIII.2.2
Characterization of N-TiO
2immobilized on glass
spheres
... 186
VIII.2.3
Photocatalytic activity tests ... 188
VIII.2.4
Design of the fixed bed reactor: choice of the
photoreactor geometry ... 194
VIII.2.5
Design of the fixed bed reactor: fluid dynamic
conditions
... 195
VIII.2.6
Design of the fixed bed reactor: radiative
transfer model ... 198
VIII.2.7
Design of the fixed bed reactor: final design .. 201
VIII.3
Photocalytic activity tests with the designed
continuous fixed bed reactor... 201
VIII.3.1
Laboratory scale photoreactor ... 201
VIII.3.2
Experimental results using UV or visible light
sources
... 203
VIII.3.3
Kinetic modeling of the continuous fixed bed
reactor irradiated by UV light ... 204
VI
performances: possible solution for reducing the reactor volume
... 209
IX
Conclusions ... 213
X
References ... 218
Figure 1 VB and CB positions in metals, semiconductors, and
insulators (Lazar et al., 2012). ... 3
Figure 2 Illustration of the main processes occurring on a
semiconductor particle under electronic excitation ... 5
Figure 3 Illustration of the main processes occurring on a
semiconductor particle under electronic excitation (Kudo and
Miseki, 2009). ... 6
Figure 4 Costs vs operating period for different commercial light
souces (Bisegna et al. 2010) ... 12
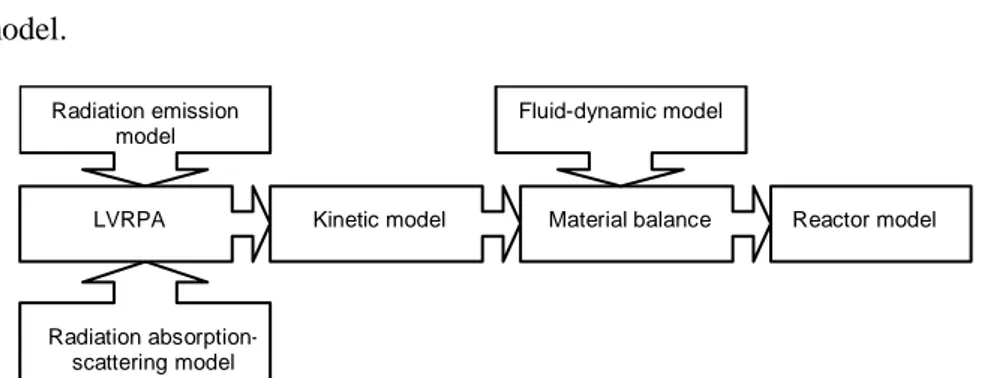
Figure 5 Schematic representation of the modeling of a photocatalytic
reactor ... 18
Figure 6 Schematic overview of the sol-gel process (Larry et al.1990)
... 22
Figure 7 Geometry for interference of a wave scattered from two
planesseparated by a spacing, d. The dashed lines are parallel to
the crests or troughs of the incident and diffracted wavefronts.
The important path length difference for the two rays is the sum
of the two dark segments ... 24
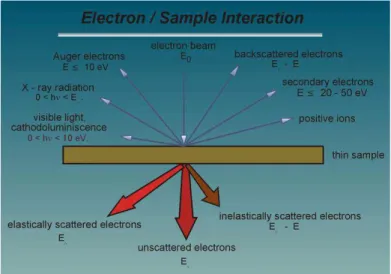
Figure 8 Signals generated when a high-energy beam of electrons
interacts with a thin specimen. ... 33
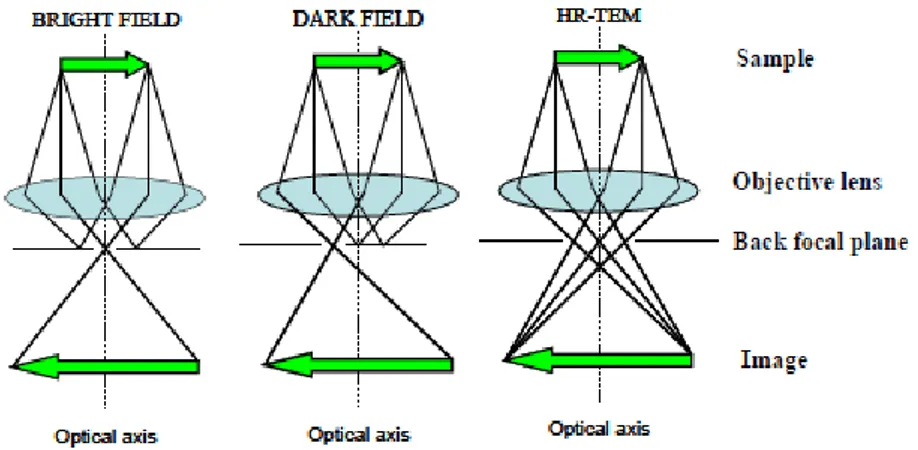
II
TEM. ... 35
Figure 11 The electromagnetic spectrum on the wavelength scale in
metres. ... 37
Figure 12 Diagram of the Rayleigh and Raman scattering processes.
The lowest energy vibrational state m is shown at the foot with
states of increasing energy above it. Both the low energy
(upward arrows) and the scattered energy (downward arrows)
have much larger energies than the energy of a vibration. ... 38
Figure 13 Stokes and anti-Stokes scattering for cyclohexane. To show
the weak anti- Stokes spectrum, the y-axis has been extended in
the inset. ... 39
Figure 14 Infrared and Raman spectra of benzoic acid. The top trace
is infrared absorption given in % transmission (%T) so that the
lower the transmission value the greater the absorption. The
lower trace is Raman scattering and the higher the peak the
greater the scattering. ... 40
Figure 15 Schematic detailing the scattering volume and subsequent
static anddynamic light scattering intensities ... 45
Figure 16 Intensity time trace showing the lack of discontinuity
expected for arandom signal when viewed across a short time
interval ... 45
Figure 17 Intensity correlation curves for ovalbumin and silicon
dioxide, measured with a Zetasizer Nano ZS static, dynamic, and
electrophoretic light scattering instrument. ... 46
Figure 18 Correlation curve and CONTIN distribution for 10-mg/mL
system. The Z average of 12.4 nm is indicated by the solid line in
the distribution results. ... 48
Figure 19 TG and DTG curves ... 49
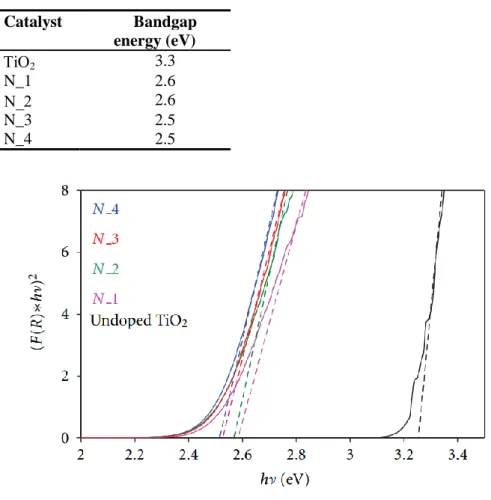
Figure 20 Band-gap estimation from UV-Vis DRS. ... 55
Figure 21 Raman spectra of undoped TiO2
, N_1; N _2; N _3; N _4 . 56
Figure 22 FTIR spectra of undoped TiO2
, N_1; N _2; N _3; N _4 .... 58
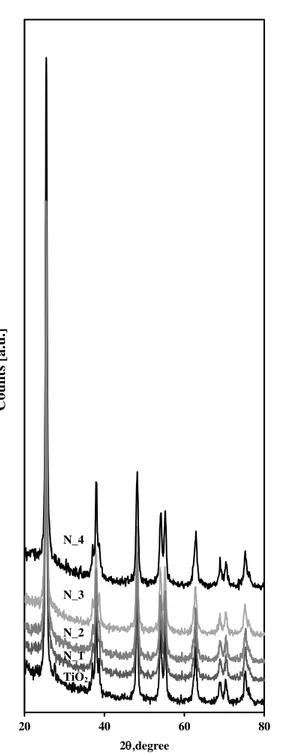
Figure 23 XRD spectra of undoped TiO2, N_1; N _2; N _3; N _4 .... 60
Figure 24 Amount of energy absorbed in visible region by N_4
catalyst as a function of calcination time. ... 63
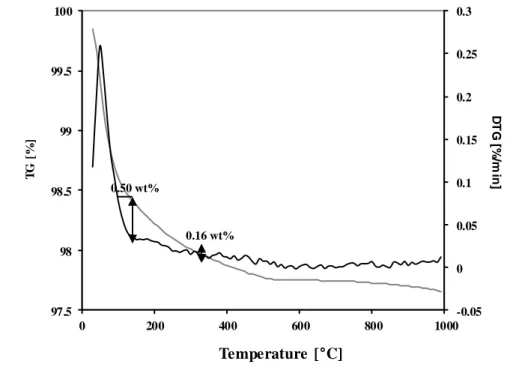
Figure 25 TG analysis of N_4 photocatalyst ... 64
Figure 26 PZC of N_4 sample ... 65
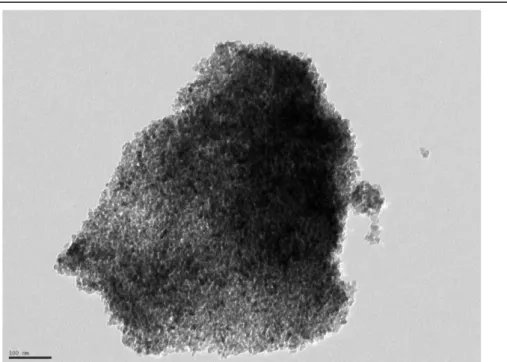
Figure 27 TEM imagine of N_4 ... 66
Figure 28 Emission spectum of the light sources and schematic picture
of the photoreactor. ... 68
Figure 29 Decolorization of MB under visible light generated by white
LEDs; catalyst weight: 0.3g; initial MB concentration: 7.5 ppm
... 69
Figure 30 Gas analysis phase during visible irradiation of MB
solution ... 70
Figure 31 TOC removal after 180 min of irradiation time ; catalyst
weight: 0.3g; initial MB concentration:7.5 ppm ... 71
Figure 32 Evaluation of decolorization kinetic ... 72
Figure 33 Evaluation of decolorization after 30 minute with different
amount of N_4 catalyst. ... 73
Figure 34 Evaluation of decolorization with different initial
concentration of MB; catalyst: N_4 ... 74
IV
different light source; initial MB and MO concentration:9 ppm 75
Figure 36 Evaluation of decolorization performances obtained on N_4
photocatalyst after one recycling experiment. Initial MB
concentration 7.5ppm. ... 75
Figure 37 Chemical structure of SP ... 77
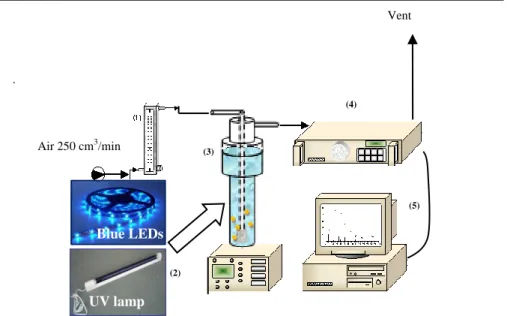
Figure 38 Experimental set up apparatus (1) flow meter; (2) magnetic
stirrer; (3) photoreactor; (4) CO
2analyzer, (5) personal
computer for data acquisition. ... 78
Figure 39 Comparison between photolysis under visible light and UV
light ... 79
Figure 40 Comparison between photolysis and photocatalysis (N-TiO
2dosage: 3g/L) using UV light sources ... 80
Figure 41 Gas phase analysis during photocatalysis in presence of UV
irradiation. ... 80
Figure 42 Comparison between photolysis and photocatalysis (N-TiO2
dosage : 3g/L) using visible light ( blue LEDs )sources ... 81
Figure 43 Comparison between UV-Vis spectra of PC50, PC100 and
NDT photocatalysts and emission spectrum of lamp ... 83
Figure 44 Initial inactivation rate as a function of N-TiO2
loading .. 85
Figure 45 E. coli inactivation ( ) and aggregates size ( ) as a
function of photocatalysts loading with pH value of the
suspension for each photocatalyst loading ... 87
Figure 46 Antibiotic resistance of E. coli strain to the target
antibiotics investigated (CIP, CEF, TET and VAN) according to
Kirby-Bauer test ... 89
LEDs; catalyst weight: 0.3g; initial MB concentration: 7.5ppm
and gas analysis of CO
2during visible irradiation of MB solution
... 93
Figure 49 Outlet reactor concentration (a.u.) of chlorine (m/z ) 35,
nitrogen (m/z ) 28, carbon dioxide (m/z ) 44, and sulphur dioxide
(m/z ) 64, as a function of run time. Initial cyclohexane
concentration 10 ppm; incident light intensity 32mW/cm
2. ... 94
Figure 50 Evaluation of MB adsorption constant and amount of MB
adsorbed on N-doped TiO
2(inset) ... 95
Figure 51 Comparison between model calculation and experimental
data to find the model constant. Catalyst weight: 0.3g; light
intensity: 32 mW cm
-2. ... 98
Figure 52 Experimental and predicted data as a function of MB initial
concentration; catalyst weight: 0.3g; light intensity: 32 mW/cm
2.
... 98
Figure 53 Experimental and predicted data as a function of catalyst
weight; initial MB concentration: 10 ppm; light intensity: 32 mW
/cm
2... 99
Figure 54 Evaluation of SP adsorption constant ... 101
Figure 55 Comparison between model calculation and experimental
data to find the reaction constant ... 103
Figure 56 Experimental and predicted data as a function of initial
TOC
0 ... 103Figure 57 Reactor configurations (A and B) and emission spectrum of
VI
sources in the configuration A; catalyst dosage: 3g/L. ... 109
Figure 59 Comparison between photoreactor configuration A and
configuration B using white LEDs and N-TiO
2catalyst; catalyst
dosage: 3g/L ... 110
Figure 60 Absorbance spectrum of tannery wastewater ... 114
Figure 61 Geometric schematization of light flux upper the
photoreactor (configuration A) ... 115
Figure 62 Calculated I
*for WL and BL. ... 116
Figure 63 Comparison between model calculation and experimental
data to evaluate the model constant; catalyst: N-TiO
2;
configuration B; catalyst dosage: 3g/L; light source: WL strip
... 117
Figure 64 Comparison between model calculation and experimental
data with a catalyst dosage of 1.5g/L; catalyst: N-TiO
2;
configuration B; light source: WL strip. ... 117
Figure 65 Comparison between model calculation and experimental
data with a catalyst dosage of 3 g/L; catalyst: N-TiO
2;
configuration A; light source: BL ... 118
Figure 66 Comparison between model calculation and experimental
data with a catalyst dosage of 3 g/L; catalyst: N-TiO
2;
configuration A; light source: WL. ... 118
Figure 67 Comparison between model calculation and experimental
data with a catalyst dosage of 3 g/L; catalyst: N-TiO
2;
data with a catalyst dosage of 3 g/L; catalyst: N-TiO
2;
configuration B; light source: UV lamp. ... 119
Figure 69 a) Aggregate size distribution of N-TiO2
with and without
azulene in range 10-3000 nm; b) Aggregate size distribution of
N-TiO
2without azulene in range 300-3000
m ... 124
Figure 70 Effect of concentration of AZ (2.5-20 mg L
-1) on the Dv 50
size of N-TiO
2suspensions; N-TiO
2dosage: 3g L
-1. ... 125
Figure 71 Effect of amount of N-TiO
2(0.75-6 g L
-1) on the Dv 50 size
of N-TiO
2suspensions in bidistilled water solution with AZ
concentration of 10 mg L
-1. ... 126
Figure 72 a) FTIR spectra of N-TiO
2b) The FTIR difference spectra
of AZ/N-TiO
2... 127
Figure 73 Hypotesis of the interaction of azulene with N-TiO
2surface
... 128
Figure 74 a) TG analysis of AZ/N-TiO2
sample; b) MS result of
AZ/N-TiO
2sample ... 129
Figure 75 a) Dark adsorption of MB on 3 g L
-1of N-TiO
2with and
without AZ; b) Photocatalytic decolourization of MB using 3g L
-1of N-TiO
2with and without AZ and photolysis of MB in presence
of AZ. ... 131
Figure 76 Photocatalytic decolourization of MB using 3g L
-1of
N-TiO
2with different AZ concentration ... 132
Figure 77 Photocatalytic decolourization of MB (AZ concentration 10
mg L
-1) using different amount of N-TiO
2(1.5 - 6g L
-1) ... 133
Figure 78 Nt-sPS composites step of synthesis ... 135
Figure 79 Raman spectra of Nt and Nts-PS ... 137
VIII
Figure 81 SEM image of Nt-sPS aerogel ... 140
Figure 82 Comparison between the photocatalytic activity of s-PS
aerogel and the photocatalyst dispersed in the polymeric
substrate (Nt-sPS) as a function of run time (a) and as a function
of irradiation time (b) ... 141
Figure 83 Comparison of photocatalytic activity of structured
photocatalyst (Nt-sPS) with respect to powdered catalyst ... 142
Figure 84 Evaluation of solution decolourization with different initial
MB concentration. ... 144
Figure 85 Influence of different surface-volume ratio (S/V) on
photocatalytic activity ... 145
Figure 86 Evaluation of MB decolourization performances obtained
on Nt-sPS after 5 recycling experiments. ... 146
Figure 87 UV-VIS DRS spectra (a) and band gap calculation (b) for
A) 50N-TiO
2/ZSP, B) 30N-TiO
2/ZSP, C) 15N-TiO
2/ZSP, D) ZSP
and E) N-TiO
2photocatalyst. ... 150
Figure 88 a) XRD patterns of 15 N-TiO2
/ZSP; 30 N-TiO
2/ZSP; 50
N-TiO
2/ZSP samples; b) XRD patterns spectra of ZSP and N-TiO
2samples. Legend:triangle=ZSP (Sphalerite cubic phase);
diamond= N-TiO
2(anatase) ... 151
Figure 89 a) Raman spectra of 15 N-TiO2
/ZSP; 30 N-TiO
2/ZSP; 50
N-TiO
2/ZSP samples ; b) Raman spectra of ZSP and N-TiO
2samples ... 153
Figure 90 Ratio between the maximum intensity of the phosphors
nominal loading ... 154
Figure 91 a) SEM images and b)EDAX analysis of the samples ZSP;
15 N-TiO
2/ZSP; 30 N-TiO
2/ZSP; 50 N-TiO
2/ZSP ... 156
Figure 92 TEM images: a)ZSP; b)15 N-TiO2
/ZSP; c) 30 N-TiO
2/ZSP;
d)50 N-TiO
2/ZSP (scale bar equals 5 μm) and e) N-TiO
2; f)15
N-TiO
2/ZSP; g) 30 N-TiO
2/ZSP; h)50 N-TiO
2/ZSP (scale bar equals
50 nm). ... 157
Figure 93 SEM imagines of a) ZSP; b) 15 N-TiO
2/ZSP; c) 30
N-TiO
2/ZSP; d) 50 N-TiO
2/ZSP ... 159
Figure 94 Aggregate size evaluation from SEM images... 160
Figure
95
(a)
Decolourization
of
MB.
(b)Evaluation
of
decolourization kinetic ... 161
Figure 96 Evaluation of the effect of different amount of ZPS in
physical combination with the similar amount of N-TiO
2(0.3 g )
on the decolourization of MB after one hour ... 162
Figure 97 Comparison of core-shell photocatalysts performances by
varying the extent of N-doped TiO
2shell (indicated by the
different weight percentages of N-doped TiO
2) in photocatalytic
decolourization of MB and gas-phase analysis of 30%NTiO
2-ZSP
... 163
Figure 98 a) Evaluation of decolourization with different initial
concentration of MB; photocatalyst: 30%NTiO
2-ZSP; b)
Evaluation of MO decolourization); photocatalysts 30%NTiO
2X
predicted data( - ) as function of irradiation time for the different
photocatalysts ... 166
Figure 100 Atrazine apparent kinetic constant and catalysts
agglomerates size as a function of N-TiO
2nominal loading ... 168
Figure 101 Effect of 30N-TiO2
/ZSP dosage on the removal of atrazine.
... 170
Figure 102 a) Photocatalytic removal of atrazine on 30N-TiO
2/ZSP at
different initial pH values, and b) apparent kinetic constant at
different initial pH values. ... 171
Figure 103 Possible degradation pathway of atrazine by ZSP under
UVA irradiation ... 172
Figure 104 Possible degradation pathway of atrazine by
30N-TiO
2/ZSP under UVA irradiation ... 173
Figure 105 Raman spectra of (a) N-TiO
2synthetized by sol-gel method
at 0°Cand (b) 0NDc
synthetized by sol-gel method at 0°C using
surface-active agent (Triton X-100); Raman shift of E
gmodes in
the range 110-200 cm
-1(inset) ... 181
Figure 106 Raman spectra of (a) 0NDc synthetized by sol-gel method
using surface-active agent (Triton X-100) at 0°C and (b) -20NDc
synthetized by sol-gel method using surface-active agent (Triton
X-100) at -20°C; Raman shift of E
gmodes in the range
100-200cm
-1(inset) ... 182
Figure 107 XRD patters of NdTc at different synthesis reaction
temperature ... 183
Figure 108 XRD patters of NDc of undoped TiO2
and -20 NDc sample
in the range 20-30 degree ... 184
of sol-gel synthesis reaction temperature ... 185
Figure 110 a) Raman spectra of N-TiO2
and NdTc samples in the
range100-800cm
-1and Raman shift of E
gmodes in the range
110-200 cm
-1(insert); b) Raman spectra of NdTc on glass
spheres in the range 100-800cm
-1... 186
Figure 111 a)SEM images of glass sphere, 3NdTcg, 4NdTcg and 6
NdTcg; b) SEM images of morphology of NdTc on glass spheres
... 188
Figure 112 Dark adsorption of MB and EBT on uncoated glass
spheres ... 189
Figure 113 Photolysis of MB and EBT in presence of uncoated glass
spheres under UV and visible light irradiation ... 190
Figure 114 Photocatalytic decolourization of MB under UV light
irradiation (optimization of NdTc amount on glass sphere) .... 191
Figure 115 Evaluation of MB decolourization performances obtained
on 4NdTcg after 4 recycling experiments. ... 192
Figure 116 Photocatalytic decolourization of MB and EBT under UV
and visible light irradiation on 4NdTcg ... 193
Figure 117 Photocatalytic mineralization of MB and EBT under UV
and visible light irradiation on 4 NdTcg ... 193
Figure 118 Preliminary domain for the fluid dynamic model where a)
is the homogenization zone; b) is the body of reactor where is
settled the structured photocatalyst bed; c) the outlet zone ... 195
Figure 119 Behavior of
v
/ v
maxas a function of reactor height
(z-direction) and behavior of
v
/ v
maxas a function of reactor
thickness at the bed inlet (inset). ... 198
XII
inside the packed bed ... 199
Figure 121 The Helmholtz model of light distribution inside the
reactor; Light sources: UV-lamps with intensity equal to 0.023 W
cm
-2; Reactor thickness: 2.5 cm ... 200
Figure 122 Experimental set up apparatus: (a) air flow meter;(a1
) air
distributor; (b) propeller; (c) feed tank; (d) peristaltic pump, (e)
inlet of the flow in the reactor; (f) light sources; (g) outlet of
liquid flow; (h) collection tank. ... 202
Figure 123 MB conversion profiles as function of contact time using
UV or visible light irradiation ... 203
Figure 124 Evaluation of MB adsorption constant on structured
catalyst ... 206
Figure 125 MB conversion as a function of inlet concentration;
comparison between model calculation and experimental data to
find the model constant. Light sources: UV-lamps; liquid flow
rate: 1.45l h
-1... 207
Figure 126 Experimental and predict data at different contact times
Light sources: UV-lamps; inlet MB concentration. 10ppm .... 208
Figure 127 MB conversion as a function of the packed- bed height
(z-direction) for different distances from the irradiated window
(y-direction). ... 209
Figure 128 The Helmholtz model of light distribution inside the
reactor; Light sources: UV-LEDs with intensity equal to 5.87 W
cm
-2; Reactor thickness: 2.5cm ... 210
Figure 129 Simulated MB conversion as function of z-direction, Light
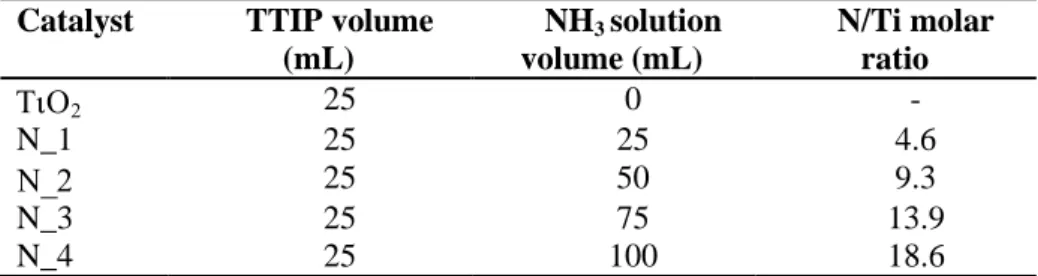
Table 1 List of catalysts with their nitrogen nominal content ... 54
Table 2 Band-gap estimation from UV-Vis DRS. ... 55
Table 3 Crystallites size from XRD analysis ... 61
Table 4 Specific surface area (BET) ... 61
Table 5 Specific surface area (BET). ... 63
Table 6 Characteristics of light sources. ... 108
Table 7 Spectral emission of light sources as a function of wavelength
[λ] ... 108
Table 8 Light absorbance of photocatalyst ... 113
Table 9 BET values for Nt, s-PS and Nt-sPS ... 138
Table 10 Crystallite size, SSA(BET) and optical band gap energy of
ZSP, N-TiO
2, 15N-TiO
2/ZSP 30N-TiO
2/ZSP and 50N-TiO
2/ZSP
photocatalyst ... 148
Table 11 Synthesis reaction temperature, amount of surface-active
agent (Triton X-100), crystallite size, SSA (BET) of different
N-TiO
2samples ... 178
Table 12 Number of dip-coating steps; crystallites size, SSA and
Abstract
As a consequence of the rapid growth of population in urban areas, water use and reuse has become a major concern, leading to an urgent imperative of developing effective and affordable technologies for the treatment of water and wastewater. Traditional methods for water treatment are usually based on physical and biological processes but, unfortunately, some organic pollutants, classified as bio-recalcitrant, are not biodegradable. In this way heterogeneous photocatalysis may become an effective water treatment technology to remove organic pollutants hardly oxidised by conventional techniques.
Photocatalysis represents one of the main challenges in the field of treatment and decontamination of water and air, because it is able to work at ambient temperature and atmospheric pressure. Heterogeneous photocatalysis is a catalytic process that uses the energy associated to a light source to activate a catalyst with semiconducting properties. The most common used photocatalyst is titanium dioxide (TiO2), which is able to oxidize a wide range of toxic organic compounds to harmless compounds such as CO2 and H2O. However, the following major factors limit both photocatalytic efficiency and activity of TiO2:
a) the band gap of anatase TiO2 is 3.2 eV, i.e. it absorbs light in the UV region, so that only a small portion (5%) of sunlight can be used for a photocatalytic process. This is a great limitation in its use as photocatalyst for the conversion of solar into chemical energy;
b) as in all semiconductors, photogenerated electron-hole couples undergo fast recombination in competition with charge transfer to adsorbed species on the catalyst surface;
c) the use of slurry reactors limits the industrial applications of photocatalysis, since the necessary separation of catalyst powders after liquid phase reactions is troublesome and expensive.
In this context, during this PhD project different routes have been explored to go beyond these limitations:
belonging to the p-block was investigated in recent years to sensitize TiO2 towards visible light, either by introducing newly created mid-gap energy states, or by narrowing the band gap itself. However, the role of titania dopants such as N, C, B, S, P, I and F is still not completely understood. The insertion of dopants in the crystalline structure of TiO2 may induce light absorption in the visible region, but also increases the rate of the undesired recombination of photogenerated charge carriers. This effect becomes relatively lower if the crystallinity of the oxide structure is higher.
Our attention was focused on nitrogen as dopant. N-doped TiO2 photocatalysts were prepared by sol gel method, via hydrolysis of titanium tetraisopropoxide by aqueous ammonia solution. More in details, the sol- process was carried out at 0°C to limit the evaporation of ammonia due to the exothermic character of the hydrolysis reaction, and then the obtained powders were dried and calcined at 450°C. N/Ti molar ratio and calcination time conditions were optimized. All samples were characterized by BET, UV-vis absorption, Raman spectroscopy, FTIR, SEM-EDAX, TEM and XRD. The effects of the dopant amount on the structural features of the doped materials were systematically investigated in relation to their photocatalytic activity.
The photocatalytic degradation of methylene blue (MB) in aqueous suspension was employed as test reaction. MB is a highly popular test pollutant in semiconductor photocatalysis used in the assessment of such key features as novel photocatalytic materials, photoreactors and light sources.
The best photocatalytic performances in the presence of visible light irradiation have been obtained with a N/Ti molar ratio equal to 18.6 and for a calcination time of 30 minutes.
The photocatalytic behaviour of the optimized N-doped TiO2 photocatalyst was further explored in other reactions, i.e. the degradation of spyramicin, atrazine, methyl orange and on the inactivation of E. coli.
It is also important to evidence that this optimized N-TiO2 photocatalyst resulted also able to reduce the total chemical oxygen demand (COD) of a highly polluted wastewater such as tannery wastewater.
2. The industrial application of photocatalytic processes is greatly hindered by the insufficient quantum efficiency of the photocatalytic reactions, which results from the relatively high recombination rate of photogenerated electron-hole (e−- h+) pairs. Therefore, N-doped TiO2 was coupled with other semiconductors. In particular, ZnS-based phosphors (ZSP) were chosen. The coupling with ZSP not only reduces the charge-carriers recombination rate but also enhances the photons transfer inside the photoreactor, because ZSP emits, under UVA excitation, visible light centred at 440nm, able to photoexcite N-doped titania catalyst.
N-doped TiO2 on the surface of ZSP was optimized. All samples were characterized by BET, UV-vis absorption, Raman spectroscopy, FTIR, SEM-EDAX, TEM and XRD. The effects of coupling (N-doped TiO2/ZSP) were systematically investigated in relation to their photocatalytic activity. In particular, the photocatalytic activity of N-doped TiO2/ZSP was firstly evaluated for the removal of MB and of atrazine under UVA light irradiation. Enhanced performance in comparison to either pure N-doped TiO2 nanoparticles or bare ZSP was obtained. The photocatalyst N-doped TiO2/ZSP at 30 wt % of N-dopedTiO2 loading (30N-TiO2/ZSP) exhibited the highest photocatalytic activity for the removal of MB and atrazine.
A study of the reaction intermediates during the photocatalytic removal of atrazine was also carried out by LC-QTOF and LC/MS/MS analyses. The degradation mainly involved dealkylation reaction and alkyl chain oxidation both in presence of 30N-TiO2/ZSP and ZSP. It has been found that the presence of N-doped TiO2 particles dispersed on ZSP surface led to a change of selectivity, lowering the number of intermediates formed during irradiation. It is important to underline that in the presence of ZSP support no dechlorination of aromatic structure occurred, and thus no formation of cyanuric acid was observed. This study clearly demonstrates the importance of using the ZSP as a supporting material for N-doped TiO2 nanoparticles.
3. The development of an optimized reactor in slurry configuration was then performed. In this case, the experimental results were carried out by using different light sources, such as white LEDs, blue LEDs and UV lamps, with the aim to evaluate the process efficiency at different operating conditions. From the collected experimental data it was developed a simplified mathematical model to correlate the power input of the used light source, and the geometrical properties of the reactor and of the emitting sources spectra with the performances of the photocatalytic reaction. This simplified mathematical model may represent a valuable tool to design and optimize photocatalytic processes for wastewater treatment.
The most limitation of the photocatalytic processes in slurry reactors is the low activity of N-doped TiO2 in powder form, mainly due to the aggregation phenomena between nanoparticles. Therefore, to understand the effect of aggregation, a dispersing agent was added to the N-doped TiO2 suspension and the influence of particles aggregate size on the photocatalytic activity was evaluated. The control of the dispersion and aggregation of the nanoparticles resulted crucial to exploit the advantages of the N-doped TiO2 particles in photocatalytic activity: a lower aggregate size increased the amount of MB adsorbed on the catalyst surface and enhanced the photocatalytic activity. In particular, after 120 minutes of visible light irradiation, MB degradation in the presence of dispersing agent was about
dispersing agent.
Moreover, taking into account the problem related to the scattering and screening of the light by the catalyst and the accessibility of the catalytic surface to photons and reactants, a novel way to achieve high dispersion of the photocatalyst was also investigated. It consists in dispersing it in a light-transparent support, permitting the penetration of the radiation in the inner core of the photocatalyst. , In particular, N-doped TiO2 was dispersed in transparent syndiotactic polystyrene monolithic aerogel (s-Ps) which, due to its high specific surface area, allows a better dispersion of the catalysts, strongly limiting the aggregation phenomena that typically occur when the catalyst is suspended in water solutions. These features increased the photocatalytic activity of the N-doped TiO2 under visible light irradiation in comparison with the powder sample dispersed in solution.
4. One of the most important drawbacks of photocatalytic process is that photocatalysts are used in slurry reactors. With this type of reactor, photocatalysts must be recovered from the purified water after the treatment, and the cost of this separation stage may even invalidate economically this technique. With the aim to overcome this technical limitation the N-doped TiO2 photocatalyst was immobilized on glass spheres to design a fixed bed continuous photoreactor. With respect to the methods reported in literature for the immobilization of N-doped TiO2 (mainly carried out through sputtering technique or chemical vapour deposition), the method developed is a simple sol-gel method that uses ammonia aqueous solution as the only doping source. The effect of sol-gel synthesis temperature on the crystallization and crystallite size of N-doped TiO2 was investigated; the best temperature for the immobilization through dip-coating process was found at -20°C.
The decolourization of MB and eriochrome black-T (EBT) aqueous solutions was tested in a traditional batch reactor to evaluate the photocatalytic activity of the immobilized photocatalyst. The optimization of N-doped TiO2 amount on glass spheres was established. It was found that until to four dip-coating steps, the photocatalytic activity increased. Moreover, the N-doped TiO2 immobilized on glass spheres (NdTcg) can be easily separated from the reaction mixture, and maintained excellent photocatalytic activity and durability after four cycles. Finally, NdTcg showed a high photocatalytic activity in the decolourization of MB and EBT both under UV and visible light irradiation.
The optimized NdTcg structured catalyst was used to design a continuous fixed bed photoreactor.
The geometric characteristics of the reactor were chosen to maximize the exposition of catalysts to the light source. The fluid dynamic in the packed bed reactor was also deeply studied. In particular, the inlet conditions of
distribution of pollutant concentration along the catalytic bed in the absence of reaction. In addition, a CFD model (COMSOL Multiphysics 4.2a) was utilized to determine the shape and the dimension of the transparent support for N-doped TiO2. A Langmuir–Hinshelwood kinetic model was applied for estimating the kinetic parameters of the catalyst, starting from experimental data collected at different contact times. In order to simplify the model of light distribution inside the reactor, instead of the traditional LVRPA, the Helmholtz equation set with the Dirichlet conditions on the boundary was used. The kinetic expression, together with the spatial photons distribution, was incorporated in the mass balance to achieve the theoretical distribution of the pollutant concentration in the reactor. The developed mathematical model allows determining the best irradiation conditions of the photoreactor to minimize the reactor volume required to achieve the complete removal of organic pollutants from liquid phase.
I Introduction
In the last century, due to the fast industrialization, a very severe problem has emerged, namely the intense water and air pollution. The progressive accumulation of organic compounds in natural waters is mostly due to the development and extension of chemical technologies for organic synthesis and processing (
Segneanu et al. 2013
).Population explosion, expansion of urban areas increased adverse impacts on water resources, particularly in regions in which natural resources are still limited. Currently, water use and reuse has become a major concern. For this reason, it is an urgent imperative to develop effective and affordable technologies for wastewater treatment.
The main causes of surface water and groundwater contamination are industrial discharges (even in low quantities), excess use of pesticides, fertilizers (agrochemicals) and land filling domestic wastes. General classes of compounds of concern include: solvents, volatile organics, chlorinated volatile organics, dioxins, dibenzofurans, pesticides, PCB's, chlorophenols, asbestos, heavy metals, and arsenic compounds. Some specific compounds of interest are 4-chlorophenol, pentachlorophenol, trichloroethylene (TCE), perchloroethylene (PCE), ethylene dibromide, vinyl chloride, ethylene
dichloride, methyl chloroform, p-chlorobenzene, and
hexachlorocyclopentadiene. Extensive research is underway to develop advanced analytical, biochemical, and physicochemical methods for the characterization and elimination of hazardous chemical compounds from air, soil, and water.
The wastewater treatment is based upon various mechanical, biological, physical and chemical processes. In fact, this is a combination of many operations like filtration, flocculation, chemical sterilization and the elimination of particles in suspension. The biological treatment is the ideal process (natural decontamination).
The physico-chemical processes (coagulation and flocculation) use various chemical reagents (aluminum chloride or ferric chloride, polyelectrolytes, etc.) and generate large amounts of sludge. Increasing demands for water quality indicators and drastic change regulations on
2
wastewater disposal require the development of processes more efficient and more effective (ion exchange, ultrafiltration, reverse osmosis and chemical precipitation, electrochemical technologies). Each of these treatment methods has advantages and disadvantages.
Water resources management exercises ever more pressing demands on wastewater treatment technologies to reduce industrial negative impact on natural water sources. Thus, the new regulations and emission limits are imposed and industrial activities are required to seek new methods and technologies capable of effective removal of heavy metal pollution loads and reduction of wastewater volume, closing the water cycle, or by reusing and recycling wastewater. Advanced technologies for wastewater treatment are required to eliminate pollution and may also increase pollutant destruction or separation processes. These technologies can be applied successfully to remove pollutants that are partially removed by conventional methods, e.g. biodegradable organic compounds, suspended solids, colloidal substances, phosphorus and nitrogen compounds, heavy metals, dissolved compounds, microorganisms that thus enabling recycling of residual water (Zhou and Smith, 2002). Special attention was paid to electrochemical technologies, because they have advantages: versatility, safety, selectivity, possibility of automation, environmentally friendly and requires low investment costs (Hansen et al., 2007).
The technologies for treating wastewater containing organic compounds fall within one of the following categories:
Non-destructive procedures are based on physical processes of adsorption, removal, stripping etc. Biological destructive procedures based on biological processes use active mud. Oxidative destructive processes – based on oxidative chemical processes can fall within one of the following categories:
• Incineration;
• WO "Wet Oxidation", operating in conditions of high temperature and pressure, with the versions:
WAO - "Wet Air Oxidation" (wet oxidation with O2 air oxidative agent);
CWAO - "Catalytic Wet Air Oxidation" (catalytic wet oxidation with O2 air oxidative agent);
SWA - "Supercritical Water Oxidation" (oxidation with O2 air oxidative agent in supercritical conditions).
• Liquid oxidation: AOPs - “Advanced Oxidation Processes", operate in conditions of room temperature and pressure and use as oxidative agents O3, H2O2 and even O2, catalysts and/ or UV radiations
Figure 1VB and CB positions in metals, semiconductors, and insulators (Lazar et al., 2012).
I.1
Advanced oxidation processes (AOPs)
Advanced oxidation processes (AOPs) are widely used for the removal of recalcitrant organic constituents from industrial and municipal wastewater. In this sense, AOPs type procedures can become very promising technologies for treating wastewater containing non-biodegradable or hardly biodegradable organic compounds with high toxicity. These procedures are based on generating highly oxidative HO radicals in the reaction medium.
H2O2
H2O2 + UV (direct photolysis)
H2O2 + Fe2+/3+ (classic, homogeneous Fenton) H2O2 + Fe/support (heterogeneous Fenton) H2O2 + Fe2+/3+ + UV (VIS) (Photo-Fenton)
O3
4
O3 + UV (photo-ozone feeding) O3 + catalysts (catalytic ozone feeding)
H2O2 + O3
TiO2 (heterogeneous catalysis) TiO2 + UV (photo-catalysis)
Photocatalytic water purification using semiconduxtor is a predominant advanced oxidation process (AOP) because of its efficiency and eco-friendliness. Among all AOP processes heterogeneous photocatalysis may not require any additional reagents beyond the catalyst. Photocatalysis can be defined as a “catalytic reaction involving the production of a catalyst by absorption of light” (Verhoeven, 1996). The appropriate positioning of valence (VB) and conduction (CB) bands in semiconductors (Figure 1) makes them suitable materials for the absorption of light and photocatalytic action.
I.1.1 Basic Principles
Photocatalysis is generally defined as the change in the rate of a chemical reaction or its initiation under the action of ultraviolet, visible or infrared radiation in the presence of a substance, the photocatalyst, which absorbs light and it is involved in the chemical transformation of the reaction partners. D
A D A tor semiconduc E light bgMoreover, when a solid material is used as the photocatalyst, the definition of heterogeneous photocatalysis is preferred (Schiavello, 1997). The most commonly used photocatalysts are semiconductor materials (most of them metal oxides) which, possess a void energy region (band-energy structure), where no energy levels are available (Figure 2). The void region which extends from the top of the filled valence band to the bottom of the vacant conduction band is called band gap, Eg.
Activation of a semiconductor photocatalyst is achieved through the absorption of a photon of ultra-band gap energy, which results in the promotion of an electron from the valence band into the conduction band, e- CB, and in the concomitant generation of a hole in the valence band, h+
VB. The reaction of either the photopromoted electron with a reducible adsorbed substrate (usually oxygen in aerated system) and/or the hole with an oxidizable adsorbed species can subsequently occur.
The overall process of semiconductor-sensitized photoreactions can be summarized as follows: The probability and the rate of such charge transfer processes depend on the position of the conduction and valence band edges and on the redox potentials of the adsorbed species. For example, when a semiconductor is used as a photocatalyst in the environmental remediation, usually involving the photodecomposition or complete mineralization of organic pollutants, it should be capable to generate a valence band hole with a redox potential that is positive enough to oxidise the organic pollutant. At the same time the photogenerated electron in the conduction band should be negative enough to reduce adsorbed O2 to superoxide radical anion (Hoffmann et al., 1995).
e
-h
+ CB VB D A A •-D•+ O X I D A T I O N R E D U C T I O NFigure 2 Illustration of the main processes occurring on a semiconductor
particle under electronic excitation
Errore. L'origine riferimento non è stata trovata. Figure 3 shows the
band gap values of different semiconductors and their position on the electrochemical scale. A substrate can successfully interact only with some semiconductors: it is necessary that the electrochemical potential value of the electron acceptor is more positive (down in the graph) than the semiconductor conduction band potential, and that the electron donor potential is more negative (up in the graph) than that of the semiconductor
6
valence band. A photocatalytic reaction can take place only under such conditions.
Recombination of electron-hole pairs can occur, in competition with charge transfer to adsorbed species, in the volume of the semiconductor particle or in its surface with the release of heat. This phenomenon represents the major deactivation path which could significantly decrease the overall photocatalytic efficiency.
The detrimental process of back-donation to the semiconductor after charge transfer to the adsorbed species can also occur.
The efficiency of a photocatalyst depends on the competition of different interface transfer processes involving electrons and holes and their deactivation by recombination (Fox and Dulay, 1993; Hoffmann et al., 1995; Serpone, 1997).The position of the flatband of an SC in solution follows a Nernstian pH dependence, decreasing 59mV per pH unit (Ward et al., 1983), and consequently, the ability of electrons and holes to enact redox chemistry can be controlled by changes in the pH.
Figure 3 Illustration of the main processes occurring on a semiconductor
particle under electronic excitation (Kudo and Miseki, 2009).
By using a semiconductor (SC), the heterogeneous photocatalytic process is a complex sequence of reactions that can be expressed by the following set of simplified equations (Linsebigler et al., 1995):
a) Charge separation
SC+he-CB + h+VB
e-CB + h + VB heat c) Surface trapping h+VB+≡Ti-OH ≡ Ti-O . + H+ e-CB +≡Ti-OH ≡ Ti . + OH- d) Surface recombination e-CB ≡Ti-O+H +. ≡ Ti-OH h+VB+≡Ti-OH ≡ Ti-O . + H+ e) Interfacial charge transfer
Red1+≡Ti-O. Ox1 +≡ Ti-OH Ox2+ H2O +≡ Ti.
Red2 +≡ Ti-OH f) Back reaction
Red2+≡Ti-O.
Ox2 +≡ Ti-OH Ox1 +≡ Ti. Red1 +≡ Ti-OH
It’s worth to remember that a semiconductor free of impurities is defined intrinsic. A semiconductor doped with impurities is called extrinsic.
Doping involves the addition of a different element into the semiconductor.
The visible light photoactivity of metal-doped TiO2 can be explained by a new energy level produced in the band gap of TiO2 by the dispersion of metal nanoparticles in the TiO2 matrix. As shown in Figure. 1, electron can be excited from the defect state to the TiO2 conduction band by photon with energy equals hv2. Additional benefit of transition metal doping is the improved trapping of electrons to inhibit electron-hole recombination during irradiation. Decrease of charge carriers recombination results in enhanced photoactivity.
Many techniques have been examined to achieve this purpose. Metal and non-metal doped TiO2 has attracted considerable attention due to its reported activity in the visible light. There are many elements for doping TiO2 such as Fe, W, Cr, Ru, V, Mo, Nb, Au, Pt, Pd, Ag, Sb, Co, Mn, Ni, Zn, Zr or with heteroatoms such as fluorine, sulfur, carbon, phosphorus, boron, iodine, chlorine, bromine, nitrogen (Biedrzycki et al., 2014; Zaleska, 2008).
For example, for the titania doped with nitrogen (N-doped TiO2), there are three different main opinions regarding modification mechanism of TiO2 doped with doping: (1) Band gap narrowing; (2) Impurity energy levels; and (3) Oxygen vacancies:
8
1. Asashi, et al.(Asahi et al., 2001) found N 2p state hybrids with O 2p states in anatase TiO2 doped with nitrogen because their energies are very close, and thus the band gap of N-doped TiO2 is narrowed and able to absorb visible light;
2. Irie, et al. (Irie et al., 2003) stated that TiO2 oxygen sites substituted by nitrogen atom form isolated impurity energy levels above the valence band. Irradiation with UV light excites electrons in both the VB and the impurity energy levels, but illumination with visible light only excites electrons in the impurity energy level;
3. Ihara, et al. (Ihara et al., 2003) concluded that oxygen-deficient sites formed in the grain boundaries are important to emerge vis-activity and nitrogen doped in part of oxygen-deficient sites are important as a blocker for reoxidation. The modification mechanism of anatase doped with nonmetals was also analyzed by Zhao et al. (Zhao et al., 2014). They investigated N-TiO2 and concluded that TiO2 doped with substitutional nitrogen has shallow acceptor states above the valence state. In contrast, TiO2 doped with interstitial nitrogen has isolated impurity states in the middle of the band gap. These impurity energy levels are mainly hybridized by N 2p states and O 2p states.
I.2
Fundamental Engineering Aspects
The photocatalytic process results from the excitation by UV-visible light of a solid semiconductor, generating free electrons and holes, which lead to redox processes on the surface and the attack of adsorbed molecules. Direct attack of organic molecules on the surface, or formation of highly reactive hydroxyl radicals results, in the presence of oxygen, in the oxidation of the organic molecules, which, in most cases, leads to a complete
Mineralization hotocatalytic reactions are the result of the interaction of photons having the appropriate wavelength with a semiconductor. When the arriving light has energy equal or greater than the semiconductor band gap, radiation is absorbed and electrons are moved from the valence band to the conduction band giving rise to the formation of electron–hole pairs. These charge carriers can migrate to the catalyst surface in competition with an exothermic and normally fast recombination reaction. When they reach the semiconductor surface they may, once more recombine, or participate in successive chemical reactions (Alfano et al., 2000). The main components of
a photocatalytic process are indeed the photoreactor and the radiation sources (Augugliaro et al., 1997). For thermal and catalytic processes the parameters that affect reactors performance are:
1. the mode of operation;
2. the phases present in the reactor; 3. the flow characteristics;
4. the needs of heat exchange;
5. the composition and the operative conditions of the reacting mixture.
For selecting the type of heterogeneous photoreactor additional parameters must be considered since photons are the primary source for the occurrence of photoreaction. The selection of the construction material for the photoreactor must be generally done in order to allow the penetration of radiation into the reacting mixture. The choice of the radiation source must be made by considering that the absorbed radiation energy should be equal to or higher than the band gap.
I.2.1 Photoreactor Geometries
Two main features determine the design of the reactor: • suspended or immobilised catalyst;
• source of irradiation.
The most useful reactors for the wastewater treatment are heterogeneous phototoreactors, where the photocatalysts can be present in suspended modes (slurry reactor) or immobilized on transparent support (fixed bed reactor). Most of the early photoreactors have employed a TiO2 suspension because it offers a high surface area for the reactions. The disadvantages of the slurry photocatalysis include 1) difficulty and time consuming process of separation or filtration of the photocatalyst after the photocatalytic process; 2) particle aggregation and agglomeration at high photocatalyst concentration; and 3) difficulty of using the suspended photocatalyst in continuous processes (Sopyan et al., 1996). Various types of support have been used, made mainly of glass (plate, beads, fibreglass mat) but also paper, cotton, fibres. The source of irradiation can be either natural (solar irradiation) or artificial (lamp). The geometry of the reactor is strongly related to the source of irradiation, in particular it has to be designed so as to