Sustainability 2019, 11, 4598; doi:10.3390/su11174598 www.mdpi.com/journal/sustainability Article
Methodological Insights to Measure the Agenda 2030
at Urban Level in Italy
Luca Farnia 1, Laura Cavalli 2, Giula Lizzi 2 and Sergio Vergalli 2,3,* 1 Fondazione Eni Enrico Mattei, Isola S. Giorgio 8, 30100, Venice, Italy 2 Fondazione Eni Enrico Mattei, Corso Magenta 63, 20019, Milan, Italy 3 Department of Economics and Management, University of Brescia, via San Faustino 74/b, 25122 Brescia, Italy * Correspondence: [email protected] Received: 11 July 2019; Accepted: 20 August 2019; Published: 23 August 2019 Abstract: In this paper, we deal with the issue of measuring the Agenda 2030 at the urban level in Italy; the results are useful for the policy analysis and dissemination of sustainable development at the local level. The proposed tool merges 53 available economic, social and environmental elementary indicators into 16 composite indices and one composite dimension representing 16 out of 17 Sustainable Developments Goals (SDGs) adopted by the United Nations in 2015. The contribution of the paper is twofold: While the results of the indices show the geographical and demographic heterogeneity within the country when considering each of the 16 dimensions, the methodological discussion highlights the complexity of the phenomena, due to the multidimensional definition of the Agenda 2030.
Keywords: SDGs Indices; Italian municipalities; sustainable urban development; spectral value
decomposition 1. Introduction In August 2017 the Sustainable Development Solutions Network (SDSN) presented in New York the first US City Index on the Sustainable Development Goals (SDGs) at urban level [1]. This index was put beside the Global SDG Index [2], underlining the specific role of cities. The SDGs recognize that sustainability is a universal goal and that all countries and communities can play an important role in achieving its Agenda. From a global point of view, cities are crucial for the achievement of sustainable development: They are relevant to assess the success or the failure of it, as they host more than half of the whole world’s population and they are the main source of carbon emissions.
Using indicators to track progress is an integral part of the SDGs, which are included in an international framework agreed by world leaders in 2015 aiming to end poverty, fight inequalities and stop climate change.
Although important references exist in Italy to monitor sustainability at national level, there are no explicit references to single urban realities. Numerous contributions that evaluate the country’s positioning in the field of sustainability are available [3]. They range from the documents and data used to prepare the National Strategy for Sustainable Development (provided by the Ministry of Environment in December 2016), which presents the positioning of Italy compared to 17 SDGs and 169 targets, to the index developed by the UN‐SDSN and by the Bertelsmann Foundation. This places Italy at the 29th place on 156 in the world in 2017, after Sweden, Denmark and Finland, but in the queue also to other countries like the Slovak Republic, Hungary and Latvia. In particular, this tool shows for which Goal Italy is far from reaching the target (mainly Goal 14, 12, 13 and 9), and for which instead the country is on the path toward sustainability (Goal 1, 3, 4, 6, 11).
Among other contributions, the Organization for Economic Cooperation and Development [4] provides a state of the art for the SDGs in OECD countries, comparing the OECD well‐being own framework to the Agenda 2030 and noticing that Italy has reached adequately 11 out of the 17 SDGs. Despite the importance of understanding the positioning of one country in an international perspective, in order to have a complete picture to be used as a basis for the identification of a system of priorities, it is also important to understand the direction of the change and the speed of the progress towards the SDGs. In this regard [5] underlines the significant progress on some SDGs made by the EU (Goal 3, 7, 11, 12, and 15), but it also reminds that such progress is not sufficient to achieve the Agenda 2030. To better understand the national situation, in 2017 the Italian Alliance for Sustainable Development (ASviS) [6], established in 2016 to raise awareness and mobilize actions to pursue the SDGs, has stated that Italy is far from sustainability on unemployment, inequality and environmental issues, while it is improving in the fields of education, good health and food security, even if it continues to remain far away from the target for what concerns all these issues. Furthermore, Italy is in delay in the adoption of fundamental strategies relating to energy, climate change and circular economy.
The process to reach targets or to reach the Goals of the Agenda also depends on the different policies adopted and their impacts. At this regard [7] developed a measure of the current well‐being and the future sustainability, generating forecasts up to 2030 for 45 different geopolitical areas (individual countries or macro‐regions), based on the different hypotheses of policies adopted in a composite indicator (so‐called Assessment, Projection and Policy of Sustainable Development Goals, APPS) that depends on a general equilibrium economic model. The results show that Italy stands at the 15th place among the 45 regions considered and, within the European Union, its performance is better only compared to that of the Czech Republic, Spain and Greece. While the studies that analyse countries in the context of the SDGs are numerous, nationally— but even internationally, with the only exception of the US—there are only a few explicit references to urban realities. Several international organizations have created specific programs to develop and harmonize urban indicators worldwide; these include, among others [8], the United Nations Centre for Human Settlements (UNCHS), the UN Commission on Sustainable Development, the World Bank, the OECD, the European Environment Agency (EEA), and the World Health Organization (WHO).
Considering the available international sources deep inside [9] we can distinguish a first generation of urban indicators which was set during the 1960s when the World Bank launched the first World Development Indicators Series, aiming at monitoring urban achievement of the international development goals of that time [10,11]. After that, the Global City Indicators Program (GCIP) was introduced, which enabled cities to measure, report on, and improve their performance and quality of life, to facilitate capacity building, and to share best practices through an easy‐to‐use web portal. During the latest century, the Cities Data Book (CDB) was formulated by the Asian Development Bank as a comprehensive set of urban indicators able to improve urban management and performance measurement; in the same years, the Global Urban Indicators (GUI) database was established to monitor progress on the implementation of the UN‐Habitat Agenda. As social and environmental indicators are concerned, [12] review a series of environmental indicators developed in the last years that were found suitable to be applied at the corporate level for the evaluation of production processes and products. The indicators reviewed in their paper were classified into four main groups: (1) Indicators of Energy and Material Flows; (2) Indicators with a Territorial Dimension; (3) Indicators of Life‐Cycle Assessment; and (4) Indicators of Environmental Risk Assessment. The definition of the environmental impact of economic activities has been gradually integrated with a broader concept, given that “sustainability” has also included social elements. Therefore, [13] and [14] studied the community quality‐of‐life (QOL) indicators using Human Wellbeing Index (HWI) and Ecosystem Wellbeing Index (EWI) in their research, respectively. Further literature has been developed by following the SDGs, trying to define some SDGs indices [15].
Currently, there are several indicator frameworks that offer a tool to measure the sustainability of urban realities worldwide: Most, but not all of them, shall apply to European cities, being all
scalable and easily enforceable. Among the frameworks, some indices evaluate sustainability on the whole, such as the China Urban Sustainability Index [16], considering nearly 200 Chinese cities. Alongside in Europe, the Reference Framework for Sustainable Cities (RFSC) assists European cities implementing the 17 SDGs in line with Europe 2020 guidelines [17]. This provides different, more extensive outputs, compared to the previous benchmarks that generally dwell on some specific meanings of the 17 SDGs, normally more confined to unique concerns, such as water, environment, transportation. In this respect, the City Blueprints, based on 24 indicators divided into eight categories, measure water sustainability in a city, with the aim of helping European stakeholders and policy makers define sustainable urban water management. Along the same lines, the European Green City Index analyses the environmental sustainability level of 30 European cities based on various quantitative and qualitative indicators [18].
Fewer are the sources available at a local level, although when implementing the Agenda 2030 it is particularly important to define the strategies through the alignment of local or regional development plans with the Goals, the targets and the indicators of the Agenda 2030. For example, in October 2018 the Spanish SDSN Network, REDS, launched the SDG Spanish Cities Index, showing the progress of 100 Spanish cities towards the SDGs. [19] set some composite indices of well‐being for Italian regions, as well as 110 Italian provinces, using 11 dimensions of well‐being associated with 11 composite indices. Locally adopting the Agenda is much more than reaching the target: in order to build a local strategy there is a need for the design, the sharing and the development of tools that photograph the “implementation status” of the SDGs in the main Italian municipalities; this to help local communities tackle the still unresolved challenges affecting single cities. With this purpose and deciding to favor the outlined methodological approach, more deeply explained forward, it is unquestionable that no unique system of measurement and correct approach towards sustainability is sufficient to frame policy decisions and problems solutions. In fact, the relevant characteristics of some principal issues, clearly contained, but not specifically ascertainable through the 17 Sustainable Development Goals and their targets, given the numerous representations of them, are difficult to analyze with a perspective being one and only. The problematic nature of this article’s reason makes a much higher problematic issue in the use of scientific tones and technocratic expressions. Actually, sustainability assessment implies a set of multi‐dimensional indicators that are not influenced nor constrained by policy needs. With various attempts already occurred, there is currently no unanimity over the outcomes of a specific multidimensional system of urban sustainability indicators. The indicators aggregation has constituted a dilemma in previous literature and remains so in the current one, mainly because of the complexity of urban sustainability overall: The factors on which it depends, the way in which they are arranged, their mutual relationship [20]. Considering not only the way in which urban realities constantly evolve, but also the many challenges related to this process, as well as the trade‐offs between the different dimensions of sustainable development, for which economic policy instruments naturally tend to neglect environmental and social advancements and vice versa, a multi‐dimensional framework would help assess urban sustainability in a more correct form. This, also taking into consideration the comparability issue of these three (four, including the cultural) dimensions, that implies a value dispute when ranking different activities with common‐comparative terms. “Measuring sustainability” is, therefore, a process that asks for a set of multi‐dimensional indicators, in order to avoid the aggregation‐related issues, which could result in preference structures depending on the final aim and user of the measurement. As explained in [21], the above‐mentioned issues can result in preference relations made possible by the existence of trade‐offs between criteria, keeping in mind the situation for which some indicators improve while others. The present work aims not only to fill in the gaps of the above literature, but also to derive the implicit influence of each SDG on sustainability as defined by United Nations, hence as a fulfilment of the 17 SDGs. To do so, first, it identifies the available indicators related to the sustainability level of Italian cities; then, it derives both a composite measure for each SDG and for sustainability as a whole, by means of Spectral Value Decomposition [22].
This paper is organized as follows: Section 2 is dedicated to the description of the composite index; Section 3 explains the main results; Section 4 offers a consistent conclusion of the study. The main sources and graphs are put in the appendix. 2. Methodological Approach UN defined sustainability as “meeting the needs of the present without compromising the ability of future generations to meet their own needs.” In order to track the achievement of a better and more sustainable future for all, the Assembly introduced 17 SDGs: Their fulfilment could be seen as a way of reaching and measuring sustainability. The composite index structure closer to this definition is the one in which all the SDGs are individually linked to the composite measure. Given such definition and structure, we evaluate the performance of Italian municipalities in each SDG and identify their implicit influence on sustainability on the basis of 53 elementary indicators. Due to missing values, the initial set of 71 indicators and 111 municipalities was reduced to 53 indicators and 98 municipalities according to the maximum information criterion, i.e., n°indicators times n° municipalities. Structured into 16 out of 17 SDGs; due to comparability reasons, even if some data are available for Goal 14, “Life below water”, this Goal is not included in the analysis. The list of the elementary indicators is shown in the Appendix (Table A1), and Figure 1 graphically represents the composite index structure.
These indices do not measure the sustainability level of Italian urban reality; instead, they measure the Italian municipalities’ performance respect to the average. The reason is that only in few indicators a specific UN target (sustainable level) is available, and, on the other side, no unsustainable thresholds exist at all. We stress indeed the following: Since, in a composite index, the distance to the target (upper bound) is rescaled on a 0,1 scale because of the presence of indicators with different units of measure, no rescaled distance based on a single point can be precisely computed. The choice of the lower bound plays indeed a crucial role in determining such distance and cannot depend on the data set—for example the 2.5 percentile [1]—especially when we compare realities that are homogeneous, i.e. cities or regions belonging to the same country, or countries with similar wellbeing level (OECD, etc.). Instead of keeping a few indicators and setting as many lower bounds (a difficult task), we have preferred to retain the whole set of indicators and build a fast, unsupervised composite index on standardized data. Therefore, the scores obtained in each dimension cannot reveal a sustainability level per se, but only a comparison between municipalities’ performances in relation to an average value (set to zero by construction).
Data have been merged in two levels: In the first level indicators have been aggregated within each Goal; in the second level, the Goals have been aggregated into the Sustainability Index. The uneven distribution of indicators among Goals (Goal 7, for example, has only one indicator, while Goal 4 has 9) required a re‐standardization of the value obtained to balance the Goal’s influence on the final index. Indeed, from a probabilistic point of view, Goals with fewer indicators exhibit a higher variance with respect to those formed by several, with a consequently greater influence on the final composite index.
Figure 1. Composite Index Structure.
Moreover, the high dimensionality of the index has required the check for latent implications, due to the multivariate distribution of data; it is mathematically proved [23,24] that not only the heterogeneous variance among indicators plays a central role on the aggregated value, but also the degree of correlations among them. With this aim, in order to identify the latent structure of data (see sub Section 2.1), the Spectral Value Decomposition has been applied, clustering both indicators within each Goal and the Goals themselves. The weights attached to the indicators have been set in such a way to better represent the dimensions the data describe, favouring the ones that are statistically independent and, conversely, penalizing those that belong to the same dimension. In this way, a more balanced representation of data is obtained.
2.1. Criteria Weighting
Consider a composite index formed by 𝑝 indicators 𝑥 with 𝑖 1,2, … 𝑝 , that have been previously adjusted according to their polarity. If such indicators have been previously standardized too, their covariance matrix coincides with the correlation matrix (denoted with 𝐑). The Spectral Value Decomposition (SVD) allows to rewrite the correlation matrix in the following way:
𝐑 𝐀𝚲𝐀′ (1)
where 𝚲 𝑝 𝑝 is the diagonal matrix of eigenvalues of 𝐑 and 𝐀 𝑎 𝑝 𝑝 matrix of eigenvectors. SVD is the fundamental step in Principal Component Analysis (PCA) and Factor Analysis (FA). We prefer to use the former term instead of the latter, because, in the context of composite indices, the components or factors are not used directly to compute the synthetic measure: A transformation and/or a rescaling of the eigenvector matrix is required to guarantee a positive direct effect of the elementary indicators on the composite measure. Although several techniques exist in literature to define weights by means of PCA and FA, there is no consensus on which one is the best to use. The most commonly employed can be found in [25], more specifically in [26]. However, this approach leads to two severe consequences: First, it could overweigh indicators that are correlated, penalizing those that are independent, leading consequently to an unbalanced composite index. The reason is that the initial weights of the indicators (represented by the proportion of variance explained in each component) are weighted again proportionally to the variance explained by the components. Second, the criterion adopted to retain the number of
components (around 85% of total variance should be explained); this could drop components that in theory play a central role in the description of the data or it could retain too many components.
We, hence, followed the approach of [22]: Each component has the same weight and the number of components to retain equals the number of eigenvalues greater than 1 (because data are standardized). Mathematically, the weight vector 𝐰 𝑝 1 :
𝐰 𝑑1𝐁𝐢 (2)
where 𝑑 represents the number of components retained, 𝐁 𝑏 𝑎 𝑝 𝑑 matrix where 𝑗 1, … , 𝑑 and 𝐢 𝑑 1 vector of ones.
The composite index 𝑦 is, hence, a weighted average of the indicators belonging to it:
𝑦 𝐰 𝐱 (3)
2.2. Final Goal’s Influence on the Composite Index
In literature [23,24] the final influence of the 𝑖‐th indicator on a composite index 𝑦 (formed as linear combinations of some criteria) is expressed as the squared correlation between the two:
𝐼𝑛𝑓𝑙𝑢𝑒𝑛𝑐𝑒 , 𝑐𝑜𝑟 𝑥 , 𝑦 . (4)
This allows us to better understand the real importance of a variable in a composite index, catching both the direct (weight/coefficient) and the indirect effect.
3. Results
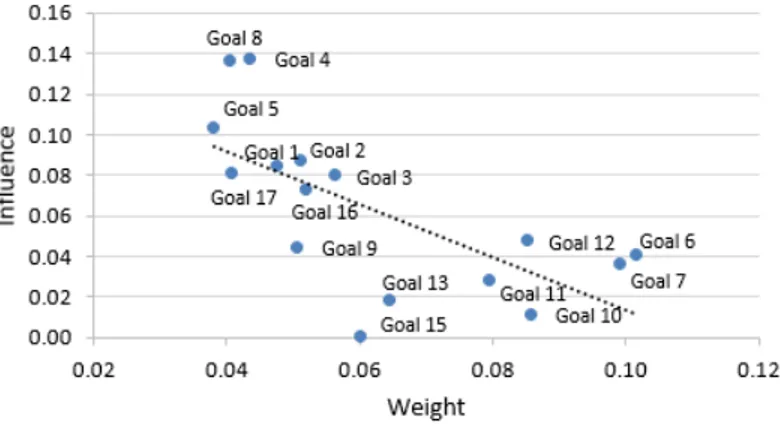
According to Equation (4), the overall influence of each SDG on the composite measure is reported in Table 1and graphically represented in Figure 2. Although SVD technique tends to impose, at least for our data set, higher weights to less influencing Goals (see Figure A1 in Appendix), to better balance the structure of the data, such results highlight a criticality in UN sustainability’s definition and measurement.
For this reason, such an index is not valid, per se, but very useful for deriving some additional insights on sustainability. Although in a hypothetical measure of sustainability this issue could be mitigated using non‐additive techniques or rearranging the 17 SDGs into different clusters, a political/social dilemma persists: While the Agenda 2030 theoretically recommends looking at each specific Goal, it could paradoxically induce policy makers to enhance quality of education (Goal 4), decent work and economic growth (Goal 8) and gender equality (Goal 5), given the strong interconnection of these Goals with many other Goals too, to the detriment, however, of environmental and wealth inequalities priorities. It is likely that such results represent the Italian political strategy at municipal level, as well as what has recently happened in practice. Indeed, we can all agree that in the past, not only in Italy but worldwide, environmental issues and wealth inequalities have never represented a priority. We are indeed, still in a society that, in an optimistic view, prefers to produce in a greener way and consume greener products, but undoubtedly far from consuming and producing less even in favour of disadvantaged people.
The distribution of the SDGs’ influence at municipality level could be considered both as a reflection of the state of the art of Italian municipalities and as a proxy for monitoring the urban strategy towards sustainability; in an ideal path, these values should converge to the same one.
Table 1. The overall influence of Sustainable Developments Goals (SDGs) and their weights.
Goal Std. Infl. Weight Goal Std. Infl. Weight
Goal 4 0.137 0.044 Goal 12 0.047 0.085 Goal 8 0.136 0.041 Goal 9 0.044 0.051 Goal 5 0.103 0.038 Goal 6 0.040 0.102 Goal 2 0.087 0.051 Goal 7 0.036 0.099 Goal 1 0.084 0.048 Goal 11 0.028 0.080 Goal 17 0.081 0.041 Goal 13 0.018 0.065 Goal 3 0.079 0.057 Goal 10 0.011 0.086 Goal 16 0.072 0.052 Goal 15 0.000 0.060 Figure 2. Graph representation of the influence (sphere size) of SDGs on the composite index and the correlation (|𝐶𝑜𝑟 𝑥, 𝑧 | 0.35) among them. Given the importance of looking specifically at the SDGs to better understand the state of the art of the municipalities and their different specificities, rankings for each Goal have been provided (see Table A2 to Table A4 and their graphically representation in Figure A2 to Figure A4). It is always important to remember that the Agenda 2030 is a complex program that aims at avoiding trade‐offs between the Goals, still recognizing the peculiarities of every single actor and the need of integration between them. One of the points to focus the attention on, once the individual rankings have been obtained, is the high degree of diversification, which strongly—but not surprisingly—indicates the degree of heterogeneity of the Italian municipalities.
From a comparative perspective, Bolzano is at the top of the ranking in the Goals linked to Poverty (Goal 1) and to Sustainable Cities (Goal 11). Milan is the best performer in the SDGs related to Economic growth, Infrastructures and Innovation (Goal 8 and 9); it is on the podium in Goal 6 (clean water and Sanitation), but at the same time it displays the worst result in SDG 10 (economic inequality) and second to last in Goal 15 (life on land). If numerous northern cities, such as Belluno, Venezia and Padova are the best performers respectively in Goal 12 (responsible production and consumption), 13 (climate change) and 7 (clean energy), on the other side Terni and Rome (cities of central Italy) rank at the top in SDG 3 (good health) and 5 (gender equality), and 17 (partnership for the goals) respectively. Finally, Matera and Enna, municipalities in the southern part of the country, are on the top of the ranking in SDG 15 (life on land) and 16 (peace). Deepening the analysis that concerns the top and bottom municipalities for each Goal, multiple conclusions can be drawn. First of all, not even Trento, which is the most sustainable city as appears from the ranking given by the Composite Index, reaches the full sustainability level in each one the 17 SDG acceptation: In fact, it can be defined as the city showing the greater balance. In the same vein also Bolzano, at the top of the ranking in different Goals, but showing a red‐coloured light in Goal 7 (clean energy). Almost all the municipalities at the top in at least one Goal are northern cities, while the southern ones are placed in the opposite part of the ranking. While the first group is very heterogeneous, in
some cases being at the top and in others at the bottom of the ranking, for the second group a marked homogeneity towards the bottom arises: Rarely they can be found at the top of the ranking with positive values above average. The cases of some big cities is emblematic, in that they are placed both at the top of the ranking in one Goal, and at the bottom in another: for example, Rome lies at the top in Goal 5, and at the bottom in Goal 3, Milan is the first one in Goals 8 and 9, and the last one in Goal 10, while Padua is the first one in Goal 12 and the last one in Goal 15. This difference may depend on the complexity of the city itself, which is also evidence of the heterogeneity above mentioned. To give other examples of the trend, Turin is at the top in Goal 2, but does not perform well in Goals 3, 10 and 11; Vercelli and Matera are at the top in Goal 10 and 15, respectively, but do not perform well in Goals 13 and 16. Mantua (at the top in Goal 6), Belluno (12) and Cremona (4) show good performances overall, with few negative performances in the other SDGs. As mentioned before, Bolzano is the leader in Goals 1, 11 and 17, but it is not the first one in all the Goals; similarly, Trento, performing better in some of the Goals, but not being the absolute best performer in all of them.
Speaking of worst performances, the municipality performing the worst as appears from the Composite Index (Catania), is also the worst in two Goals (6 and 8); the second to last municipality, Naples, is the worst in one Goal (4) and it performs badly in even 8 Goals (1, 2, 3, 8, 10, 15, 16, 17); afterwards, Trapani and Messina are the worst in two Goals (9, 5 and 1, 16 respectively). On the contrary, Crotone, performing badly overall, is the worst municipality in no specific Goal, which happens instead to Benevento, Taranto and Caltanissetta.
To conclude, the fact that Viterbo, Pesaro and Reggio nell’Emilia are the worst in Goals 13, 12, and 11, respectively, does not place them at the bottom of the overall ranking.
All that said, these results confirm the complex picture and the need of tools to help the coordination and the intersection between policies, sectors and stakeholders, in order to find innovative solutions to the challenges sustainable development addresses to.
4. Discussion and Conclusions
Defining and measuring sustainability is a complex issue, especially when we attempt to link numbers to the intrinsic value of the Agenda 2030. The complexity could in part be mitigated using non‐additive approaches or rearranging the 17 SDGs into the (three) traditional dimensions of sustainability or using different clustering approaches (for example item analysis, multidimensional scaling, ordination methods, cluster analysis) even if a second issue of how weighting such clusters arise; moreover, in these ways, we alter the real trade‐offs among goals. We opted instead for keeping the Assembly definition of sustainability, applying SVD approach (able not only to cluster the 16 analyzed goals into four latent dimensions, but to weigh them too, according to the variance explained by them in each dimension) and highlighting some implications that may arise even keeping the Goals distinct.
Comparing this research to the others above‐mentioned, it is to be stressed that, unlike several urban indicators improved, which give emphasis to some specific aspects of sustainability, the index for Italian municipalities considers sustainability as a whole, as defined by the UN, and, for this reason, follows in the attempt of seeking the fulfilment of all 17 SDGs at the same time, without favouring some issues (normally environmental and economic aspects) at the expense of some others (normally social data).
Against this background, the City Blueprints gives priority to the sustainability level of cities as water is concerned, and the European Green City Index places the environment as its core. The Reference Framework for Sustainable Cities itself, even if closer to the Italian index with regard to the overall vision and scope—that is to guide cities in their path towards sustainability—ends up subsuming the study into five dimensions/priorities policy makers are asked to choose: Spatial dimension, governance dimension, social dimension, economical dimension, environmental dimension. Undoubtedly, within all the sub‐groups, the key points of the 2030 Agenda are easily recognisable, sometimes in the form of the literal SDG reference (for example, in the case of the environmental dimension, “Climate change”). Moreover, the Urban Sustainability Index published by the Urban China Initiative, developing an analysis of the sustainability shifts across Chinese cities,
provides an indicator‐based assessment grouped into four categories: Economy, environment, society and resources.
The idea of sustainability which is closer to the one adopted in the Italian experience, all‐ encompassing and even‐handed in its contexts, is assumed in the SDSN Spanish City Index, in turn, inspired by the US City Index. The US Cities Index, following the SDSN methodological approach, ranks 100 cities according to 44 indicators on 15 of the 17 Sustainable Development Goals. Each indicator is scaled from 0 (worst score) to 100 (best score), with an arithmetic mean that is used to aggregate indicators within each SDG. The ranking of cities that accordingly derives is able to give an overall state of the art of the sustainability level of the cities matter of the study. Sustainability, indeed, remains a political/social dilemma: While the Agenda 2030 theoretically recommends looking at each specific Goal, it could paradoxically induce policy makers (pushed by society) to enhance quality of education (Goal 4), decent work and economic growth (Goal 8) and gender equality (Goal 5), given the strong interconnection of these Goals to many other Goals too, to the detriment, however, of environmental and wealth inequalities priorities. Data, environmental problems and wealth inequalities we have faced in Italy during the last years seem to be aligned, confirming that they were not a political priority. We are still in a society that, in an optimistic view, prefers to produce in a greener way and consume greener products, but undoubtedly far from consuming and producing less.
Again, theories and methods could help: The distribution of the SDGs’ influence at municipality level could be considered both as a reflection of the state of the art of Italian municipalities and as a proxy for monitoring the urban strategy towards sustainability (when data will be available at a regular time step).
Regarding the results, this paper offers the readers a list of SDGs indices for Italian municipalities. The results confirm in many cases the rift between the North and the South of the Country, but they highlight that a city could perform virtuously in some Goals, but still be in delay in others. Another important point that arises from the single SDG rankings is the high degree of diversification, which strongly—but not surprisingly—indicates the grade of heterogeneity of the Italian municipalities.
Also, given the Italian territorial structure, made of the regional and the further division for macro areas—that of North, Centre and South of the peninsula, further analysis can be made on this base. Therefore, the municipalities analysed in this paper could be clustered at a broader level, considering an adaption of the methodological approach with this scope, and, as a consequence, a specific proposal to weight such clusters. A consideration, based on regions or macro areas, could be improved starting from the results of the SDGs City Index, which underline a more heterogeneity of the northern cities—almost all of which were at the top in at least one Goal, while others placed low in the ranking. Southern cities tended to be more homogeneous, with of them tending towards the bottom of the ranking. Finally, from the technical perspective, future studies and developments can be devoted to the role of time in the index analyses. Further future prospects could be related to the definition of the targets and their impact on the synthetic index. Another approach, that does not depend on them, could change the results in a more balanced index. Author Contributions: This article is a joint work of the four authors. Luca Farnia wrote the methodological chapter, part of chapter 3 and conclusions. He computed the results and produced tables and Figures. Laura Cavalli was involved in the conception of the paper, data collection and contributed to write the paper. Sergio Vergalli contributed to write the paper, participated in the comments and analysis of the results. Giulia Lizzi, helped to draft and review the manuscript. All authors participated in the literature review and gave thought to the conclusions. Funding: None Conflicts of Interest: The authors declare no conflict of interest.
Appendix A
Table A1. List of indicators considered (Goal and Polarity displayed).
Indicator Source Year SDGs Polarity
Elderly people dependence index ISTAT 2017 1 negative
Economic distress MEF 2013 1 negative
Individuals in low‐working intensity families ISTAT 2011 1 negative
Urban bio gardens URBES 2013 2 positive
Obesity rate ISS 2016 2 negative
Healthy life expectancy at birth ISTAT 2016 3 positive
Healthy life expectancy at 65 years ISTAT 2016 3 positive
Deaths and injuries in road accidents ISTAT 2016 3 negative
Support to elderly people ISTAT 2015 3 positive
Suicide rate URBES 2011 3 negative
Infant mortality rate URBES 2011 3 negative
Nursery services for children aged 0‐36 ISTAT 2013 4 positive
Student literary competence URBES 2013/14 4 positive
Student numerical competence URBES 2013/14 4 positive
People with university degree ISTAT 2011 4 positive
Population with low school license (isced 3) ISTAT 2011 4 positive
Enrolled population at school aged 0‐16 ISTAT 2011 4 positive
Schools with ramps for people with
disabilities URBES 2013 4 positive
School with technologies MIUR 2015 4 positive
Population with pre‐university education ISTAT 2015 4 positive
Employment gender balance ISTAT 2016 5 positive
Woman mayor in the last 10 years DATI.GOV.IT 2016 5 positive
Women educational level compared to men URBES 2011 5 positive
Water losses ISTAT 2015 6 negative
Population connected to urban wasted water
treatment plants ISTAT 2015 6 positive
Population served by sewerage ISTAT 2015 6 positive
Solar PV installed Legambiente 2017 7 positive
Average taxable income per capita MEF 2015 8 positive
Neet (15–29) URBES 2011 8 negative
Youngs aged 18–24 not enrolled in any
educational course URBES 2011 8 negative
Public transportation availability Legambiente 2017 9 positive
Green firms UNIONCAMERE 2015 9 positive
Connection infrastructure Infratel 2015 9 positive
Gini index MEF 2014 10 negative
Cycling road Legambiente 2017 11 positive
People with no toilet URBES 2011 11 negative
Pm 2.5 emission ISPRA 2017 11 negative
Recycled waste ISPRA 2016 12 positive
Urban waste ISPRA 2016 12 negative
Incentive to recycling garden waste ISPRA 2016 12 positive
Public transportation mobility Legambiente 2017 13 positive
Bike sharing ISTAT 2015 13 positive
Propensity to public transportation ISTAT 2015 13 positive
CO2 emission OECD 2008 13 negative
Share area utilization SINAnet 2016 15 negative
Green urban areas per population Legambiente 2017 15 positive
Ecolabel licenses ISPRA 2017 15 positive
Political electoral participation Min. dell’Interno 2013 16 positive
Tribunal efficiency FPA 2012 16 negative
Firms rating ISTAT 2015 16 positive
Broadband penetration rate ISTAT 2011 17 positive
Propensity to association ANCITEL 2015 17 positive
Table A2. Top and bottom 15 municipalities (Sustainability Index to Goal 5).
Municipality S.I. Municipality Goal_1 Municipality Goal_2 Municipality Goal_3 Municipality Goal_4 Municipality Goal_5
Trento 2.30 Bolzano 1.83 Torino 5.61 Terni 1.91 Cremona 1.96 Roma 2.46
Cremona 1.51 Treviso 1.64 Parma 1.93 Treviso 1.89 Padova 1.85 Lodi 2.16
Bolzano 1.43 Pavia 1.27 Ferrara 1.43 Mantova 1.57 Trento 1.59 Torino 2.12
Padova 1.42 Rieti 1.16 Ravenna 1.18 Rimini 1.51 Udine 1.53 Ancona 2.06
Lodi 1.39 Padova 1.15 Pordenone 0.95 Forli’ 1.49 Rovigo 1.51 Piacenza 1.87
Macerata 1.37 Brescia 1.15 Bologna 0.94 Siena 1.38 Bologna 1.44 Savona 1.76
Verbania 1.23 Trieste 1.14 Trento 0.91 Pordenone 1.38 Belluno 1.39 Vercelli 1.70
Forli’ 1.21 Varese 1.13 Cremona 0.90 Perugia 1.37 Sondrio 1.35 Verbania 1.64
Mantova 1.18 Cremona 1.13 Belluno 0.90 Sondrio 1.29 Parma 1.33 Bologna 1.50
Verona 1.12 Lodi 1.05 Bolzano 0.87 Trento 1.23 Ancona 1.21 Alessandria 1.48
Ferrara 1.11 Firenze 1.05 Como 0.86 Macerata 1.23 Bergamo 1.20 Pavia 1.47
Bologna 1.10 Novara 0.99 Padova 0.85 Pistoia 1.23 Forli’ 1.16 Pisa 1.35
Modena 1.02 Modena 0.98 Modena 0.83 Teramo 1.22 Pavia 1.15 Siena 1.17
Parma 0.99 Matera 0.96 Sondrio 0.82 Campobasso 1.20 Gorizia 1.11 Milano 1.06
Siena 0.93 Siena 0.95 Lecco 0.81 Pesaro 1.16 Macerata 1.11 Firenze 0.92
⋮ ⋮ ⋮ ⋮ ⋮ ⋮ ⋮ ⋮ ⋮ ⋮ ⋮ ⋮
Catanzaro −0.87 Alessandria −0.99 Trapani −0.97 Cremona −0.91 Torino −1.01 Messina −0.97
Massa −1.08 Lecce −0.99 Agrigento −0.97 Alessandria −0.99 Caltanissetta −1.13 Massa −1.00
Brindisi −1.12 Roma −0.99 Messina −0.97 Milano −1.20 Brindisi −1.18 Bari −1.09
Caltanissetta −1.15 Cosenza −1.08 Matera −0.98 Genova −1.25 Alessandria −1.18 Ragusa −1.15
Frosinone −1.32 Taranto −1.19 Potenza −0.98 Palermo −1.35 Prato −1.21 Enna −1.23
Taranto −1.33 Vibo valentia −1.19 Campobasso −1.41 Enna −1.41 Massa −1.30 Agrigento −1.49
Benevento −1.34 Crotone −1.20 Reggio di Calabria −1.52 Catania −1.49 Agrigento −1.44 Taranto −1.56
Agrigento −1.51 Frosinone −1.21 Catanzaro −1.52 Messina −1.55 Oristano −1.44 Caltanissetta −1.72
Vibo valentia −1.56 Catania −1.34 Cosenza −1.52 Agrigento −1.59 Taranto −1.47 Palermo −1.73
Palermo −1.57 Sondrio −1.51 Vibo valentia −1.52 Pavia −1.63 Trapani −1.61 Catania −1.80
Crotone −2.14 Trapani −1.60 Crotone −1.52 Massa −1.68 Messina −1.70 Brindisi −1.88
Messina −2.19 Napoli −1.69 Napoli −1.75 Caltanissetta −1.84 Crotone −2.05 Foggia −2.01
Trapani −2.38 Palermo −1.77 Salerno −1.77 Roma −2.20 Catania −2.09 Napoli −2.05
Napoli −2.44 Agrigento −4.01 Avellino −1.77 Napoli −2.87 Palermo −2.47 Crotone −2.06
Catania −2.54 Messina −4.55 Benevento −1.77 Trapani −3.12 Napoli −2.91 Trapani −2.10
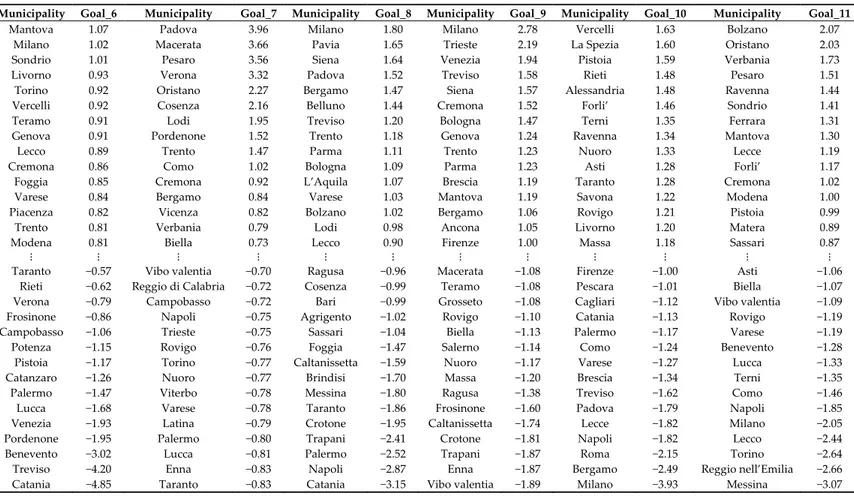
Table A3. Top and bottom 15 municipalities (Goal 6 to Goal 11).
Municipality Goal_6 Municipality Goal_7 Municipality Goal_8 Municipality Goal_9 Municipality Goal_10 Municipality Goal_11
Mantova 1.07 Padova 3.96 Milano 1.80 Milano 2.78 Vercelli 1.63 Bolzano 2.07
Milano 1.02 Macerata 3.66 Pavia 1.65 Trieste 2.19 La Spezia 1.60 Oristano 2.03
Sondrio 1.01 Pesaro 3.56 Siena 1.64 Venezia 1.94 Pistoia 1.59 Verbania 1.73
Livorno 0.93 Verona 3.32 Padova 1.52 Treviso 1.58 Rieti 1.48 Pesaro 1.51
Torino 0.92 Oristano 2.27 Bergamo 1.47 Siena 1.57 Alessandria 1.48 Ravenna 1.44
Vercelli 0.92 Cosenza 2.16 Belluno 1.44 Cremona 1.52 Forli’ 1.46 Sondrio 1.41
Teramo 0.91 Lodi 1.95 Treviso 1.20 Bologna 1.47 Terni 1.35 Ferrara 1.31
Genova 0.91 Pordenone 1.52 Trento 1.18 Genova 1.24 Ravenna 1.34 Mantova 1.30
Lecco 0.89 Trento 1.47 Parma 1.11 Trento 1.23 Nuoro 1.33 Lecce 1.19
Cremona 0.86 Como 1.02 Bologna 1.09 Parma 1.23 Asti 1.28 Forli’ 1.17
Foggia 0.85 Cremona 0.92 L’Aquila 1.07 Brescia 1.19 Taranto 1.28 Cremona 1.02
Varese 0.84 Bergamo 0.84 Varese 1.03 Mantova 1.19 Savona 1.22 Modena 1.00
Piacenza 0.82 Vicenza 0.82 Bolzano 1.02 Bergamo 1.06 Rovigo 1.21 Pistoia 0.99
Trento 0.81 Verbania 0.79 Lodi 0.98 Ancona 1.05 Livorno 1.20 Matera 0.89
Modena 0.81 Biella 0.73 Lecco 0.90 Firenze 1.00 Massa 1.18 Sassari 0.87
⋮ ⋮ ⋮ ⋮ ⋮ ⋮ ⋮ ⋮ ⋮ ⋮ ⋮ ⋮
Taranto −0.57 Vibo valentia −0.70 Ragusa −0.96 Macerata −1.08 Firenze −1.00 Asti −1.06
Rieti −0.62 Reggio di Calabria −0.72 Cosenza −0.99 Teramo −1.08 Pescara −1.01 Biella −1.07
Verona −0.79 Campobasso −0.72 Bari −0.99 Grosseto −1.08 Cagliari −1.12 Vibo valentia −1.09
Frosinone −0.86 Napoli −0.75 Agrigento −1.02 Rovigo −1.10 Catania −1.13 Rovigo −1.19
Campobasso −1.06 Trieste −0.75 Sassari −1.04 Biella −1.13 Palermo −1.17 Varese −1.19
Potenza −1.15 Rovigo −0.76 Foggia −1.47 Salerno −1.14 Como −1.24 Benevento −1.28
Pistoia −1.17 Torino −0.77 Caltanissetta −1.59 Nuoro −1.17 Varese −1.27 Lucca −1.33
Catanzaro −1.26 Nuoro −0.77 Brindisi −1.70 Massa −1.20 Brescia −1.34 Terni −1.35
Palermo −1.47 Viterbo −0.78 Messina −1.80 Ragusa −1.38 Treviso −1.62 Como −1.46
Lucca −1.68 Varese −0.78 Taranto −1.86 Frosinone −1.60 Padova −1.79 Napoli −1.85
Venezia −1.93 Latina −0.79 Crotone −1.95 Caltanissetta −1.74 Lecce −1.82 Milano −2.05
Pordenone −1.95 Palermo −0.80 Trapani −2.41 Crotone −1.81 Napoli −1.82 Lecco −2.44
Benevento −3.02 Lucca −0.81 Palermo −2.52 Trapani −1.87 Roma −2.15 Torino −2.64
Treviso −4.20 Enna −0.83 Napoli −2.87 Enna −1.87 Bergamo −2.49 Reggio nell’Emilia −2.66
Catania −4.85 Taranto −0.83 Catania −3.15 Vibo valentia −1.89 Milano −3.93 Messina −3.07
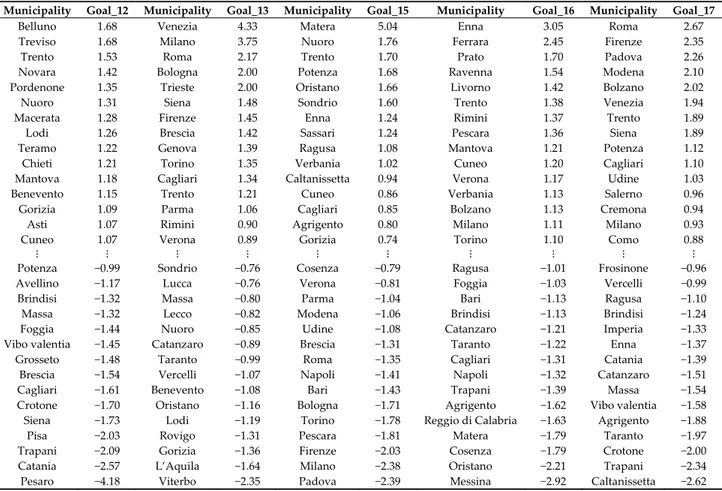
Table A4. Top and bottom 15 municipalities (Goal 12 to Goal 17).
Municipality Goal_12 Municipality Goal_13 Municipality Goal_15 Municipality Goal_16 Municipality Goal_17
Belluno 1.68 Venezia 4.33 Matera 5.04 Enna 3.05 Roma 2.67
Treviso 1.68 Milano 3.75 Nuoro 1.76 Ferrara 2.45 Firenze 2.35
Trento 1.53 Roma 2.17 Trento 1.70 Prato 1.70 Padova 2.26
Novara 1.42 Bologna 2.00 Potenza 1.68 Ravenna 1.54 Modena 2.10
Pordenone 1.35 Trieste 2.00 Oristano 1.66 Livorno 1.42 Bolzano 2.02
Nuoro 1.31 Siena 1.48 Sondrio 1.60 Trento 1.38 Venezia 1.94
Macerata 1.28 Firenze 1.45 Enna 1.24 Rimini 1.37 Trento 1.89
Lodi 1.26 Brescia 1.42 Sassari 1.24 Pescara 1.36 Siena 1.89
Teramo 1.22 Genova 1.39 Ragusa 1.08 Mantova 1.21 Potenza 1.12
Chieti 1.21 Torino 1.35 Verbania 1.02 Cuneo 1.20 Cagliari 1.10
Mantova 1.18 Cagliari 1.34 Caltanissetta 0.94 Verona 1.17 Udine 1.03
Benevento 1.15 Trento 1.21 Cuneo 0.86 Verbania 1.13 Salerno 0.96
Gorizia 1.09 Parma 1.06 Cagliari 0.85 Bolzano 1.13 Cremona 0.94
Asti 1.07 Rimini 0.90 Agrigento 0.80 Milano 1.11 Milano 0.93
Cuneo 1.07 Verona 0.89 Gorizia 0.74 Torino 1.10 Como 0.88
⋮ ⋮ ⋮ ⋮ ⋮ ⋮ ⋮ ⋮ ⋮ ⋮
Potenza −0.99 Sondrio −0.76 Cosenza −0.79 Ragusa −1.01 Frosinone −0.96
Avellino −1.17 Lucca −0.76 Verona −0.81 Foggia −1.03 Vercelli −0.99
Brindisi −1.32 Massa −0.80 Parma −1.04 Bari −1.13 Ragusa −1.10
Massa −1.32 Lecco −0.82 Modena −1.06 Brindisi −1.13 Brindisi −1.24
Foggia −1.44 Nuoro −0.85 Udine −1.08 Catanzaro −1.21 Imperia −1.33
Vibo valentia −1.45 Catanzaro −0.89 Brescia −1.31 Taranto −1.22 Enna −1.37
Grosseto −1.48 Taranto −0.99 Roma −1.35 Cagliari −1.31 Catania −1.39
Brescia −1.54 Vercelli −1.07 Napoli −1.41 Napoli −1.32 Catanzaro −1.51
Cagliari −1.61 Benevento −1.08 Bari −1.43 Trapani −1.39 Massa −1.54
Crotone −1.70 Oristano −1.16 Bologna −1.71 Agrigento −1.62 Vibo valentia −1.58
Siena −1.73 Lodi −1.19 Torino −1.78 Reggio di Calabria −1.63 Agrigento −1.88
Pisa −2.03 Rovigo −1.31 Pescara −1.81 Matera −1.79 Taranto −1.97
Trapani −2.09 Gorizia −1.36 Firenze −2.03 Cosenza −1.79 Crotone −2.00
Catania −2.57 L’Aquila −1.64 Milano −2.38 Oristano −2.21 Trapani −2.34
Figure A2. Map visualization of municipality’s performance for each dimension considered (Sustainability Index, Goal 1 to Goal 5). For visualization issues provinces are
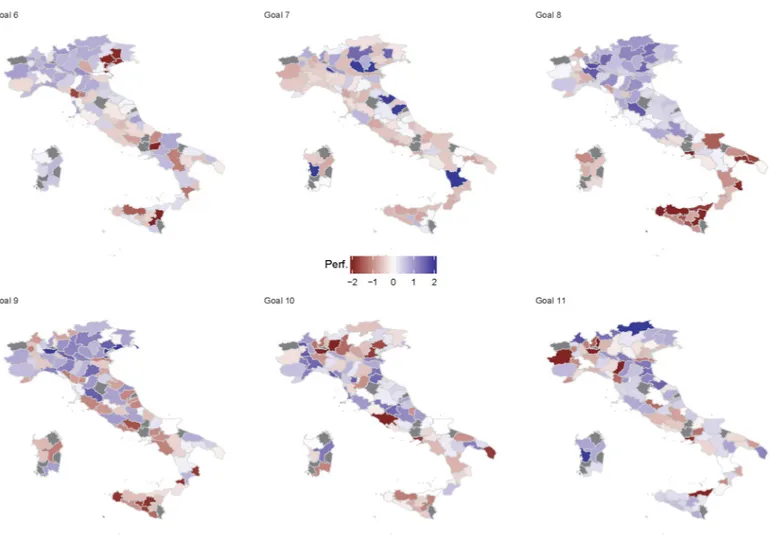
Figure A3. Map visualization of municipality’s performance for each dimension considered (Goal 6 to Goal 11). For visualization issues provinces are displayed as proxy
Figure 4. Map visualization of municipality’s performance for each dimension considered (Goal 12 to Goal 17). For visualization issues provinces are displayed as proxy
References
1. Prakash, M.; Teksoz, K.; Espey, J.; Sachs, J.; Shank, M.; Schmidt‐Traub, G. Achieving a Sustanable Urban
America; SDSN Report; Sustainable Development Solutions Network (SDSN): New York, NY, USA
2017.
2. Sachs, J.; Schmidt‐Traub, G.; Kroll, C.; Lafortune, G.; Fuller, G. SDG Index and Dashboards Report 2018; Bertelsmann Stiftung and Sustainable Development Solutions Network (SDSN): New York, NY, USA, 2018.
3. Cavalli, L. Da Agenda 2030 Globale ad Agenda 2030 Locale; FEEM Report; FEEM, Milano 2018. Available online: https://www.feem.it/en/publications/reports/agenda‐2030‐da‐globale‐a‐locale/ (accessed on 3 June 2019).
4. OECD. Measuring Distance to the SDG Targets: An Assessment of Where OECD Countries Stand. 2017. Available online: http://www.oecd.org/std/OECD‐Measuring‐Distanceto‐SDG‐ (accessed on 3 June 2019).
5. EUROSTAT. Sustainable Development in the European Union; Overview Progress on the Goals in the EU
Context; European Commission: Brussels, Belgium, 2017. 6. AsviS. LʹItalia e gli Obiettivi di Sviluppo Sostenibile; Report; Editron srl: Roma, Italy, 2017. 7. Campagnolo, L.; Carraro, C.; Eboli, F.; Farnia, L.; Parrado, R.; Pierfederici, R. The Ex‐Ante Evaluation of Achieving Sustainable Development Goals. Soc. Indic. Res. 2018, 136, 73‐116. 8. Alberti, M. Measuring Urban Sustainability. Environ. Impact Assess. Rev. 1996, 16, 381‐424. 9. Elmqvist, T.; Frantzeskaki, N.; Maddox, D.; Parnell, S.; Simon, D.; Bai, X.; Griffith, C.; McPhearson, T.; Romero‐Lankao, P.; Watkins, M. The Urban Planet: Knowledge Towards Sustainable Cities; Cambridge University Press: Cambridge, UK, 2018.
10. Wong, C. Quantitative Indicators for Urban and Regional Planning: The Interplay of Policy and Methods; Routledge: London, UK, 2006. Available online: www.un.org/sustainabledevelopment/development‐ agenda/ (accessed on 3 June 2019). 11. Wong, C. A Framework for ʹCity Prosperity Indexʹ: Linking Indicators, Analysis and Policy. Habitat Int. 2014, 45, 3‐9. 12. Herva, M.; Franco, A.; Carrasco, E.F.; Roca, E. Review of corporate environmental indicators. J. Clean. Prod. 2011, 19, 1687‐1699. 13. Sirgy, M.J.; Lee, D.; Miller, C.; Littlefield, J.E. The Impact of Globalization on a Countryʹs Quality of Life: Toward an Integrated Model. Soc. Ind. Res. 2004, 68, 251‐298.
14. Prescott‐Allen, R. The Wellbeing of Nations: A Contry‐by‐Country Index of Quality of Life and the
Environment; International Development Research Centre, Island Press/Ottawa: Washington, DC, USA,
2001.
15. Sanchez Rodriguez, R.; Ürge‐Vorsatz, D.; Salisu Barau, A. Sustainable Development Goals and climate change adaption in cities. Nat. Clim. Chang. 2018, 8, 181‐183.
16. Li, X.; Woetzel, J.; Zhang, G.; Zhang, Y. The China Urban Sustainability Index 2013. In Urban China
Initiative; Urban China Initiative: Beijing, China, 2014.
17. Van Dijken, K.; Dorenbos, R.; Kamphof, R. The Reference Framework for Sustainable Cities (RFSC): Testing
Results and Recommendations; Nicis Institute: Den Haag, The Nederland, 2012.
18. Watson, J. European Green City Index: Assessing the Environmental Impact of Europe’s Major Cities; Economist Intelligence Unit; Siemens: Munich, Germany, 2009. 19. Mazziotta, M.; Pareto, A. On a Generalized Non‐compensatory Composite Index for Measuring Socio‐ economic Phenomena. Soc. Indic. Res. 2016, 127, 983–1003. 20. Munda, G. Social multi‐criteria evaluation for urban sustainability policies. Land Use Policy 2006, 23, doi:10.1016/j.landusepol.2004.08.012. 21. Munda, G. Measuring sustainability: A multi‐criterion framework. Environ. Develop. Sustain. 2005, 7, 117–134, doi:10.1007/s10668‐003‐4713‐0.
22. Farnia, L. On the Use of Spectral Value Decomposition for the Construction of Composite Indices; FEEM Working Paper; FEEM: Milano, Italy, 2019; doi:10.2139/ssrn.3386080. 23. Wang, W.; Stanley, J. Differential weighting: A review of methods and empirical studies. Rev. Educ. Res. 1970, 40, 663–705. 24. Parulo, P.; Saisana, M.; Saltelli, A. Rating and Rankings: Vodoo or science? J. R. Statist. Soc. 2013, 176, 609–634.
25. OECD. Handbook on Constructing Composite Indicators: Methodology and UserGuide; OECD Publishing: Paris, France, 2005.
26. Nicoletti, G.; Scarpetta, G.; Boylaud, O. Summary Indicators of Product Market Regulation with an Extension to Employment Protection Legislation. In OECD Economics Department Working Papers; OECD Publishing: Paris, France, 2000. © 2019 by the authors. Licensee MDPI, Basel, Switzerland. This article is an open access article distributed under the terms and conditions of the Creative Commons Attribution (CC BY) license (http://creativecommons.org/licenses/by/4.0/).