“Severe Accident
Management Guidelines
(SAMGs) for
Russian-designed
nuclear plants”
DIMNP Universita’ di Pisa
Dottorando: Roberto Passalacqua
Relatori: Francesco Oriolo, Sandro Paci
Summary
So far, all studies in the field of severe accident management for Russian-designed nuclear plants, performed for example in the frame of projects of technical assistance for the recent Eastern new members of the EU or for the current acceding countries (e.g. PHARE projects), have suffered of a lack of methodology or have just faced specific topics of this broad matter. On the contrary, the original contribution of the work developed in the following chapters aims essentially at the description of the rationale behind which (as in a flowchart), starting from the peculiarities of VVER plants, and when assumptions of extreme severe accidents are made, underlies the reason for a potential mitigating action. In particular, the most original study here presented refers to the assessment of those actions which still have the chance to mitigate the ex-vessel phase of a hypothetical severe accident.
Therefore, the work here presented targets the definition and assessment of guidelines, for the operators of NPPs of Russian design (in particular operators of VVER-440 and VVER-1000 NPPs). To this purpose any potential severe accident (an accident with a release of fission products and radioactive aerosols to the environment) will be here described by an “in-vessel phase” which might lead to a vessel bottom head melt-through and an “ex-vessel phase” which might lead to a threat to the confinement/containment building.
In order to reach our final target, that is the development of Severe Accident Management Guidelines (SAMG), the logical process here adopted has firstly required a preliminary investigation of the VVERs’ plant-specific severe accident phenomenology, secondly the VVERs’ underlined plant-specific aspects have been modelled mainly in two available severe accident computer codes (this has been called “adaptation” of the ASTEC and MELCOR codes to the VVER design), thirdly, through a deep level-2 PSA analysis (again using the two above-mentioned codes), the source term specific to the so-called reference sequences (boundary sequences) has been assessed and finally an analysis of all possible operators’ actions meant to mitigate the ultimate consequences of the accident, that is the source term to the environment, has been performed.
Operators’ actions able to mitigate accident consequences have been classified in two types of actions: those able to limit the accident to the “in-vessel” phase (no vessel bottom head melt through) and those able to limit the accident to the “ex-vessel” phase (without release to the environment).
In some cases, because of the gravity of the envisaged consequences, also the possibility to modify the original design of the NPP, in order to overcome a possible shortcoming of the design, has been evaluated.
This work has tried to balance the SAM needs of both VVER-440 and VVER-1000 plants and it has also faced important plant-specific aspects of both types of plants.
Finally, the work here presented is not intended to be exhaustive, but it is a first attempt to find answers in an area which has recently become of strong concern, not only because of the enlargement process and therefore because several Russian-designed plants are going to be subject to the “Community approach”, but also because severe accidents are becoming a basis for the design of nuclear plants.
Table of Content
Introduction
1. Russian-designed nuclear power plants: plant-specific aspects
1.1 Background information on Russian-designed nuclear plants & scope of the work 1.2 Modelling of VVER specificities
1.2.1 VVER-440 reactors 1.2.2 VVER-1000 reactors
2. SA boundary sequences, SA phenomenology & VVER design assessment
2.1 Methodology for the study of severe accidents management (SAM) 2.1.1 Safety objective functions and safety barriers
2.1.2 Level 1&2 Probabilistic Safety Assessments (PSAs) 2.2 VVER-440 severe accident sequences
2.2.1 Initiating SA sequences and SA phenomenology
2.2.2 Possible plant modifications: In-Vessel Retention (IVR) through external cooling 2.3 VVER-1000 severe accident sequences
2.3.1 Initiating SA sequences and SA phenomenology
2.3.2 Assessment of effectiveness of possible plant modifications:
2.3.2.1 Assessment of In-Vessel Retention (IVR) for VVER-1000 reactors
2.3.2.2 Cavity modifications to avoid cavity/containment by-pass and provide for MCCI mitigation
3. Analysis of SA management (SAM) strategies
3.1 Use of level 1/level 2 PSAs for assessment of plant design against SA 3.1.1 Hydrogen risk
3.1.2 Phenomena immediately following vessel bottom-head failure 3.2 Evaluation of the optimum SAM strategy
4. Assessment of radiological consequences of risk-dominant SA sequences
4.1 VVER-440 reactors 4.2 VVER-1000 reactors
5. Examples of guidelines for SAM strategies
5.1 Examples of detailed SAM procedures 5.1.1 Depressurisation of steam generators 5.1.2 Coolant injection into steam generators
5.2 A quantitative assessment of containment management (ex-vessel phase) guidelines 5.3 General guidelines for the implementation of SAM procedures
5.3.1 In-vessel phase 5.3.2 Early ex-vessel phase 5.3.3 Long-term ex-vessel phase
6. Conclusions
Acronyms
References
Introduction
After a rather negative report of the International Atomic Energy Agency (IAEA) made in 1991 on several Russian-designed nuclear power plants (NPPs) located in the acceding countries (ACs), as for example the Kozloduy NPP, extensive “Safety Improvement Programmes” were initiated by the Governments of concerned acceding countries under the support of the European Commission. As part of the modernisation programme, the development of “Emergency Operating Procedures (EOPs)” based on the so-called “Westinghouse approach” was implemented in several eastern NPPs. The next logical step is the development of a manual providing NPPs’ operators with “Severe Accident Management Guidelines (SAMG)”.
The key parameter of a severe accident is the “source term”, which is the amount of radioactive products available for a release. This source term depends mostly on the accident dynamic and on the timing and filtering effect of the release path.
To give an example, in France, three “reference” source terms are considered in order to simplify the approach to severe accidents:
S1 which corresponds to an early loss of the containment;
S2 which corresponds to a direct (unfiltered) but delayed release; S3 which corresponds to an indirect (filtered) delayed release.
The ultimate goal of severe accident management is therefore to limit the source term to a value below S3, in order to stay within the acceptable limit of dose for the public and to meet the requirements of the “Civil Defence Emergency Planning”. In particular one important target is to provide for a time delay sufficient enough for the implementation of protection actions toward the public.
The assessment of SAMGs must take into account three main topics (which will be broadly discussed in the following chapters):
1) Phenomena investigation (mainly through analyses of the accident sequence); 2) Proposal of plant modification to overcome possible design’s shortcomings;
3) Demonstration of the feasibility of specific operators’ actions and formulation of guidelines. The methodology, for the assessment of SAMGs, adopted in this study is based on the sequential solution of the following tasks:
1) Review of VVER’s plant-specific aspects in the light of the modelling needs (chapter 1): available severe accident codes (e.g. the ASTEC or the MELCOR codes) need to take into account VVER specificities and therefore need to be “adapted” to the VVERs’ design;
2) Assessment of available techniques for the study of the severe accident phenomenology (paragraph 2.1): applications of the “safety objective” method and of (level 1 & 2) PSAs will be assessed with the aim to “categorise” all possible accident sequences in “boundary” sequences which represent, for a particular kind of initiating event, the worst possible sequence which must be faced by the plant operators. These boundary sequences, e.g. a High Pressure Melt Ejection (HPME) sequence or a by-pass sequence, can therefore be categorised in “release categories” in terms of the frequency of occurrence and the importance of the fission products release.
3) Study of the phenomenology of most probable SA initiating sequences as LOCA (Loss of Coolant) and SBO (Station Black-Out) sequences for both VVER-440 & 1000 plants (paragraphs 2.2 & 2.3): several SA initiating sequences, which give a dominant contribution to the CDF (Core Damage Frequency), and therefore leading to a vessel failure in the assumption of unavailability of
important safety features (ECCS, etc.), will be studied with the aim to assess and understand the accident phenomenology.
Through the use of specific “tools” of investigation, as the MELCOR and the ASTEC SA codes (extensively used in level 2 PSA analyses), a large database of thermal-hydraulics and fission products loads/background conditions is generated. This database is used to assess the capability of the VVER design to withstand the accident loads. In particular the VVER design will be assessed in the light of the capability to halt the vessel failure through external cooling since this important feature would be able to terminate the SA sequence and strongly limit the source term to the environment. Possible plant modifications able to allow the “in-vessel retention” (IVR) will be also investigated.
4) Analysis of SA management (SAM) strategies (chapter 3): In this chapter, the more general use of level 1&2 PSAs for plant design assessment is investigated (paragraph 3.1). Through this study a methodology for the evaluation of an optimum strategy for SA management is developed (paragraph 3.2).
5) Assessment of radiological consequences of risk-dominant SA sequences (chapter 4): The purpose of this study is to help understanding the relative impact of various severe accident phenomena or proposed SAM measures on the source term and its radiological consequence.
6) Examples of detailed SAM procedures (chapter 5): Two examples of detailed procedures for the depressurization of the secondary side (implemented in both type of VVER-440 & 1000 of the Kozloduy NPP) are illustrated as an example of recent adopted SA management. A set of general guidelines aiming at the definition of SAM procedures is established after a quantitative assessment (in the long term, therefore including the ex-vessel phase of the accident) of the consequences of the implementation of such SAM actions.
1.
Russian-designed nuclear power plants:
plant-specific aspects
VVER plant-specific aspects have to be taken into account in the analysis of severe accidents. These plant specificities will be consequently modelled in the input decks of the available SA tools (e.g. the ASTEC and the MELCOR codes).
For example one of the major differences with Western-style plants is the fact that, with the exception of the VVER-1000 design, Russian-designed reactors do not have a containment structure, but only a structure with very little retention capability (these structures are called confinement buildings).
VVER-440 and VVER-1000 plants’ specificities will be reviewed in two different chapters (chapters 1.2 & 1.3).
1.1 Background information on Russian-designed nuclear plants & scope of the
work
Russian-designed reactors are essentially variations of two basic designs: the VVER, or pressurized light water-type, and the RBMK, the graphite moderated, channel reactor.
Three generations of Soviet-designed VVER reactors, upgraded over time, are operating in Eastern Europe and the former Soviet Union. The first generation, the VVER-440 Model V230, operates at four plant sites in three countries: Russia, Bulgaria and the Slovak Republic. The second generation, the VVER-440 Model V213, operates at five plant sites in five countries: Russia, Ukraine, Hungary, the Czech Republic and the Slovak Republic. The third generation, the VVER 1000, operates at eight plant sites in three countries: Russia, Ukraine and Bulgaria.
The original design of VVER-440/230 reactor types was developed in the Soviet Union between 1956 and 1965, whilst the 440/213 was developed between 1965 and 1975. The VVER-1000 was designed between 1975 and 1985.
At the time of the collapse of the Soviet Union, two advanced versions of the VVER-1000 were under development. Russia has continued the development of an upgraded VVER-1000, and has developed a new design for a 1000-megawatt reactor with enhanced safety features.
Three generations of RBMK reactors are operating in the former Soviet Union: 11 units in Russia, two in Ukraine and two in Lithuania. Despite improvements to the RBMK design since the Chernobyl accident, concerns remain about these reactors, especially the first-generation ones.
Slovakian and Bulgarian NPPs and closure commitments for the VVER-440/230 reactor type: Slovakia has 6 nuclear reactors (generating 55% of its electricity). In 1958 the Czechoslovak
government started building its first nuclear power plant - a gas-cooled heavy water reactor at Bohunice (now in Slovakia). This 104-MWe (Bohunice A1) reactor, built by Skoda, was completed in 1972 and ran until 1977. It was closed following a severe accident during refuelling. The two VVER-440 type 230 reactors (V1 type) of the Bohunice plant were built by Atomenergoexport (Russia) and Skoda in 1972. In 1976 the two 213-type reactors (V2 type) were built by Skoda.
The construction of four units, based on the newer design of the VVER 440/213 type, started at Mochovce in 1981. Works on units 3 & 4 were halted in 1994 and, as a precondition for accession to the EU, the Slovak government committed to closing the Bohunice V1 units 1 and 2 (230 type). The dates agreed for closure are respectively 2006 and 2008. However, in the mean time both units 1 & 2 have been upgraded with several modernizations of the instrumentation and the control (I&C) system with the result of a decrease of the operational risk to a level similar to the one of VVER-440/213 reactors.
Presently Slovakia claims that all design safety deficiencies have been removed and the calculated core damage frequency (CDF), for both units 1 & 2, is now half of the target level set by IAEA for older nuclear plants (and 3% of that estimated for these units in 1991 –see par. 2.1.2 for an estimation of the CDF).
The plants currently operated by the state Slovak Electric (SE) utility are listed in the table below: Reactors Model V=PWR Net MWe Date of commissioning Bohunice 1 V-230 408 1978 Bohunice 2 V-230 408 1980 Bohunice 3 V-213 408 1984 Bohunice 4 V-213 408 1985 Mochovce 1 V-213 420 1998 Mochovce 2 V-213 420 1999 Total (6) 2472 MWe
Table 1: Slovakian power reactors in operation
Also the two Bulgarian units VVER-440/230 of the Kozloduy plant, which will be operated until 2006, have been modified with the modernization of the so-called “Accident Localization System”. This system comes into operation in case of a LOCA. The new safety feature consists of a Jet Vortex Condenser (JVC) able to retain fission products (FPs) from the steam which flow through the condenser (in a way similar to the “Bubble Tower Condenser”, BTC) of a VVER-440/213. For this reason, all SAM considerations developed in the following might also be applied to the two 440/230 units of Kozloduy plant (Units 3&4).
One more safety feature recently installed at the KNPP units 3&4 is the HIERARCH system (appendix 1) which is a dedicated system for SA management able to exert a control on the confinement leakage and the hydrogen combustion (through filtered venting and steam injection).
Scope of the present work (development of SAM Guidelines): the work here developed is
essentially limited to those power plants, located in new member countries as Slovakia, or in acceding countries as Bulgaria, for which there is no commitment for closure. The RBMK units (Ignalina 1 and 2) will be closed down respectively in 2006 and 2009. Similarly the VVER-440/230 of Kozloduy 3 & 4 in Bulgaria will be closed down before the end of 2006 (Kozloduy units 1 & 2 have been shut down in 2003) and, as discussed, the Bohunice V1 1 & 2 in Slovakia will be closed down respectively in 2006 and 2008.
Therefore we will essentially focus on two types of reactors:
1) VVER-440/213 (as for example the Paks plant in Hungary and the Bohunice V2 plants in Slovakia –see Appendix 1) and;
These reactors will be here shortly described in order to focus on some plant-specific issues which will be analysed later on for the development of SAMGs. Basic data are shown in table 2. More detailed info will be found in Appendix 1.
Plant type VVER-440/V230 VVER-440/V213 VVER-1000/V320
Thermal power [MW] 1375 1375 3000
Number of loops 6 6 4
Steam-generator horizontal horizontal horizontal Primary pressure [MPa] 12.5 12.3 15.7 Core inlet temp. [C] 267 268.7 288.1
Core Δt [C] 28 29 30
Core flowrate [kg/s] 9600 9600 16716 Average power rate [kW/l] 83 83 111 Primary coolant mass [tons] 224 224 320
Table 2: Comparison of VVER-440 and VVER-1000 reactor types
1.2 Modelling of VVER Specificities
As already mentioned, the severe accident models used for the SA assessment are essentially the MELCOR and the ASTEC computer codes. These computer tools require a precise description of the nuclear plants for which a particular accident scenario is assessed. Therefore the input decks of the SA computer codes shall be adapted to the “specificity” of the VVER plant design.
The most important VVER characteristics have been summarised in the two following two paragraphs with a particular attention to the needs of the severe accident modelling. This analysis has also allowed concluding that, especially because of the recent installation of the Jet Vortex Condenser (JVCs, see below), some VVER-440/230 plants (e.g. Kozloduy 3&4) can be considered equivalent to the VVER-440/213 plants (e.g. Packs NPP) at least within the degree of accuracy of the current tools for severe accident studies. Other safety features installed at the KNPP units 3&4 during recent plant modernizations are: 1) a diverse emergency feed water system (CEFWS); 2) a filtering/venting confinement system (FVS –“HIERARCH” system); 3) passive autocatalytic recombiners (PARs); 4) three independent “leak before break” systems (see Appendix 1 for a description of these safety features and for a more comprehensive set of VVER data).
1.2.1 VVER-440 reactors
Core components and vessel internals: the VVER-440 original design includes shrouds for fuel
assemblies and for control rod assemblies with followers and related structures below the core (because of the more difficult cooling conditions induced by the shrouds, the original design has been modified in several plants –see Appendix 1). The original VVER spacers were made of stainless steel. This material interacts with the cladding at about 1000 C, resulting in eutectic formation. The new fuel design uses Zr1%Nb alloy for spacer grids. The absorber part of control assemblies in VVER-440 reactors is made of boron steel.
Fuel cladding is made of a Zr1%Nb alloy (differently from Zircaloy -ZrSn alloy- of PWRs). The Zr1%Nb-alloy has a good operational experience and, at low temperature, is more resistant to oxidation than Zircaloy. The fuel cladding at the end of cycle has a much thinner oxide layer and takes up much less hydrogen than PWR cladding. For this reason the Zr1%Nb cladding appears to have considerable ductility even at high burn-up. The mechanical behaviour of VVER cladding is similar to that of Zircaloy-4 however, at high temperatures induced by hypothetical accidents, Zr1%Nb alloy takes up more hydrogen than Zircaloy and the cladding becomes more brittle.
The alpha-to-beta phase transition in Zr1%Nb takes place at lower temperature than in Zircaloy (~100 degrees below) and this affects the thermo-mechanical phenomena (such as plastic deformation) which takes place between 800-1000 C.
Reactor vessel: the VVER-440 core has a low power density (see Appendix 1). Reactor vessels
have an internal lining to provide better resistance to corrosion. Vessels of VVER-440s are made of steel with low level of impurities and have a weld in the core region. The upper part of the vessel includes the guide tubes for the followers of the control rod assembly. The bottom of the guide tubes is fixed to an additional plate.
VVER-440s have an elliptical bottom head, which, because of its smaller volume (in comparison to PWRs vessel bottom-heads) could cause a higher debris bed. Consequently the debris could reach the cylindrical part of the vessel walls which are thinner than those of PWRs (because of the lower design pressure -table 1). The bottom head is as thick as the cylindrical part of the reactor and a less important thermal stress is developed because of the thinner walls.
Primary circuit: VVERs have cold and hot legs at different elevations (see figures 4 and 5 in
Appendix 1): the cold legs do not penetrate the downcomer as in PWRs, but they have connections to the upper plenum (at a higher elevation). As a result of this arrangement there is more water above the core, which can allow a delay in the core uncovery.
Each of the six primary loops is equipped with a horizontal SG (5000 tubes in each SG). The steam generators can be isolated by the main gate valves (MGV) located in both cold and hot legs (see figure 6 in Appendix 1). The MGVs isolate the primary coolant pumps as well; however the connecting tubes of the pressuriser and emergency core cooling (ECC) injection are not isolated. The primary coolant pumps of this design have wet motors and little inertia, which results in fast coastdown.
Because of the low power density and the enhanced natural circulation in the primary system, the core cooling by reflux condensation mode should be modelled. Creep rupture of the SG tubes and confinement bypass is not expected because of the “loop seals” both in the hot and in the cold legs of the primary system. However, there is a risk of an important primary-to-secondary leakage, due to possibility of primary “hot collector lift-up” (34 mm-equivalent leakage).
Confinement: the confinement has a small volume with poor leak-tightness (12.6%/day), but
some improved VVER-440 confinement buildings have now a leakage of about 9 % of volume /day at a design overpressure 150 kPa. Confinement is performed by a set of interconnected compartments where is located the main equipment of the primary system with a total free volume about 14000 m3.
The confinement has been originally designed for a small (32 mm) LOCA with an absolute design pressure of 0.2 MPa. After modernisation, a 200 mm-break LOCA is the new DBA and a double-ended primary loop break (500 mm-LOCA) is assumed to be a Beyond Design Basis Accident (BDBA). In some VVER-440 (e.g. KNPP units 3&4) the design shortcoming related to the insufficient free volume has been mitigated by the installation of a “Jet Vortex Condenser” (JVC). This safety feature performs a pressure reduction in case of sudden steam release into the confinement providing for steam condensation and fission products retention (in a water volume contained in the JVCs) and maintains the pressure peak below the design pressure of the confinement (2 bar).
In case of a LOCA above a 200-mm break, a filtered venting system (FVS-HIERARCH) extracts non-condensable gases from the confinement and allow for steam injection to overcome the poor hydrogen mitigation. If the confinement pressure goes below 0.9 bar (abs), the JVS works as a flap valve to allow air from the environment to the confinement building and maintain a pressure between 0.97 and 0.96 bar (abs).
Reactor cavity: the reactor cavity is above the ground level. It is connected to the SG box (area
where the steam generators are located) through a vertical shaft and to the main coolant loops (MCL) through the reactor shaft penetration.
1.2.2 VVER-1000 reactors
Core components and vessel internals: VVER-1000/320 use Zircaloy cladding (Zr1%Nb)
therefore the thermo-mechanical behaviour is similar to the one of VVER-440’s cladding (as described in the previous paragraph). The stainless steel spacers of the original design have exhibited eutectic reaction with Zr alloys and subsequently replaced with Zircaloy spacers. B4C control rods, covered by stainless steel cladding, were also used in the original VVER-1000 design, but currently control rods contain mostly AIC and only small quantity of B4C.
Reactor vessel: power density and upper plenum structures are similar to those of PWR reactors
of similar total power. Fuel assemblies have a hexagonal structure. The assembly shroud tubes are used only in the Novovoronezh-5 unit (the first VVER-1000 unit). The core is supported by a core plate with supporting columns (between the vessel bottom head and the core plate). VVER 1000 vessels are made of steel and have no welds in the core region.
The bottom-head surface is a torispherical ellipsoid: this shape causes a stress distribution which is maximum at the bottom. This is compensated by a higher thickness of the bottom head (in comparison to PWRs). As in VVER-440, the small volume of the bottom head may allow the debris to reach the cylindrical part of the vessel wall.
Primary circuit: VVER-1000 NPPs have four primary loops with hot and cold legs connected to
the vessel at different levels; cold legs do not penetrate the downcomer as in PWRs, but they have connections to the upper plenum at a higher elevation. Thus, as for VVER-440, there is more water above the core. Loop seals exist only in the cold legs and there are no isolation valves (MGVs). Primary circuit piping is plated with stainless steel. Piping for the low pressure ECC is connected directly above the core and into the downcomer.
Steam generators are horizontal and steam generator tubes (11000 tubes) are made of stainless steel. There is a risk of important primary-to-secondary leakage, due to primary collector lift-up (100 mm-equivalent leakage). This is a major risk of containment by-pass with highly radioactive coolant during SA sequences.
Containment: the containment building is steel-lined with a pre-stressed large-volume
containment structure. The cylindrical part has an internal diameter of 45 m, covered with a hemispheric dome. The total free volume is approximately 60,000 m3. The lower elevation is +13.40 m and the upper elevation is + 65.25 m (the highest point of the containment dome). Design pressure is 5 bar.
Reactor cavity: the cavity walls have a thickness of 350 cm apart from the wall separating the
cavity from the shaft for inspection of the reactor internals which has a thickness of 230 cm (figures 42 of Appendix 1). At the opposite direction the cavity faces a neighbouring compartment from which is separated by a corridor and a steel door of size 300 x 180 cm. The thickness of the steel door is about 40 cm.
The cavity walls are crossed by 54 vertical channels which reach some compartments outside the confinement (see figure 43 of the Appendix) therefore corium debris could by-pass the cavity when concrete ablation takes place.
2.
SA boundary sequences, SA phenomenology &
VVER design assessment
In this chapter, the available techniques for the study of the severe accident phenomenology (i.e. the “safety objective tree” method and the level 1&2 PSAs) will be assessed in particular with the aim to evaluate their advantages and limits and with the target to “categorise” all possible accident sequences in “boundary” sequences which represent, for a particular kind of initiating event, the worst possible sequence which must be faced by the plant operators.
These boundary sequences (e.g. the High Pressure Melt Ejection, HPME) will then be categorised into “release categories” in terms of the frequency of occurrence and the importance of the fission products release.
The second part of this chapter is devoted to the study of some SA sequences essentially by means of level 2 PSA techniques for both types of VVER-440 & 1000. The most important tools of analysis are the MELCOR and the ASTEC codes which, from the so-called Plant Damage States (PDS –results of level 1 PSAs) are useful for the assessment of the SA phenomenology and the estimation of the consequences (source term).
The severe accident sequences which will be here studied are essentially those which give a dominant contribution to the CDF (Core Damage Frequency) and therefore leading to a vessel failure in the assumption of unavailability of important safety features (i.e. the ECCS).
The understanding of the accident phenomenology, sometimes very plant specific (e.g. the In-Vessel Retention, IVR), will allow to establish a basis of knowledge (a database) necessary for the assessment of the more appropriate accident management. However, the first tangible result (of level 2 PSAs) is the use of this database (of thermal-hydraulics and fission products loads/background conditions) for the assessment of the VVER design capability to withstand SA challenges.
In particular, because of the importance of the occurrence of the vessel failure for the consequences of the accident, the VVER design will be assessed in the light of the capability to halt the vessel failure through external cooling. The possible plant modifications able to allow the IVR will also be investigated.
2.1 Methodology for the study of severe accidents management (SAM)
Among the available methodology for the study of severe accidents management, two methods are most frequently used:
1) the first one is based on a deterministic method, the so-called “safety objective tree” method, which is a systematic assessment of accident challenges and possible counter-measures to mitigate the consequences;
2) the second one is based on a probabilistic safety assessment (PSA), for a specific design (e.g. VVER NPPs), of a potential sequence of events (accidents) and possible mitigation measures (by automatic safety features or operators’ actions) supposed to take place after the initiating events.
The two methods, which combine deterministic and stochastic approaches, are often used together: PSAs provide the frequency of a specific accident and allow for a categorization or regrouping of
accidents in a “release category” (see par. 2.1.2) which could be faced or mitigated, through to the “safety objective” method, by a proper “safety barrier” (see following paragraph).
The advantage of the safety objective tree method is the fact that, being a deterministic approach, it addresses the concrete answer (safety barrier) for the specific safety objective. Therefore it can be easily used by designers and SA experts. It is also immediately understood by the SAM support team (see paragraph 5.3) and by the operators of the plant.
Level 1&2 PSAs techniques require a team of specialists and cannot be “interrogated” while the accident is progressing. The only exceptions are the “Safety Monitors” (Passalacqua R. and Fumiaki Y., 2002), which are (on-line) level 1 PSA tools essentially following the state of the plant and characterised by a very fast “engine”.
In fact, generally, level 1&2 PSA techniques require 1) an accident-specific input and 2) a not negligible time for the execution of the calculation (currently not less than 1-2 days depending on the modelled phenomenology). These techniques also rely on the accuracy of the input and on the degree of validation of the computer codes used in level 2 PSAs, but have the advantage of being able to assess a quite complex phenomenology in an integral way, which is a task that could be tackled only by several experts from many different areas of study.
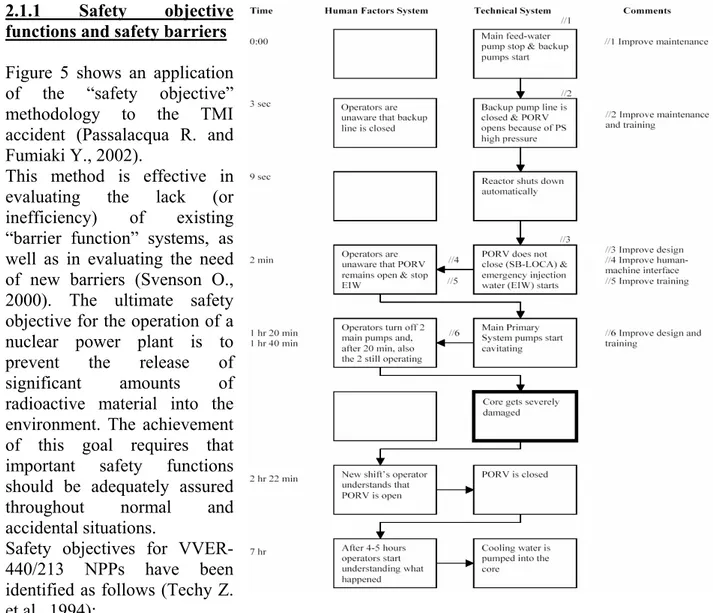
2.1.1 Safety objective functions and safety barriers
Figure 5 shows an application of the “safety objective” methodology to the TMI accident (Passalacqua R. and Fumiaki Y., 2002).
This method is effective in evaluating the lack (or inefficiency) of existing “barrier function” systems, as well as in evaluating the need of new barriers (Svenson O., 2000). The ultimate safety objective for the operation of a nuclear power plant is to prevent the release of significant amounts of radioactive material into the environment. The achievement of this goal requires that important safety functions should be adequately assured throughout normal and accidental situations.
Safety objectives for VVER-440/213 NPPs have been identified as follows (Techy Z. et al., 1994):
Figure 5: Simplified “barrier function” analysis for the TMI-2 accident
1) Prevention of core damage;
2) Prevention of the reactor vessel failure; 3) Prevention of confinement failure; and
4) Limitation of fission product release to the environment.
To achieve these safety objectives an appropriate number of safety functions must be verified and maintained. The related safety functions and barriers are described in table 3.
Safety objective Safety function Barrier Prevent Core Damage Reactivity Control
Secondary Heat Removal Maintain Core Cooling
Fuel rod cladding RCS boundary Prevent Reactor Vessel Failure Reactor Vessel Integrity RCS boundary Prevent Confinement Failure Confinement Integrity Confinement Limitation of Fission Product Release
to the Environment Confinement of Fission Products Confinement
Table 3: Relation between safety objectives, functions and barriers
The first safety objective “Prevent core damage” refers to preventive accident management, and is covered by normal and emergency operating procedures. The next safety objective "Prevent reactor vessel failure" refers to measures after the onset of core damage. In order to maintain an efficient “RCS boundary” barrier (see table 3), primary pressure should be reduced to mitigate the consequences of high pressure melt ejection. Emergency procedures involve a procedure for depressurization upon exceeding a core exit temperature set-point of 550 C for the Paks NPP (Bognar B., 2000). Along with the implementation of this procedure, pressurizer safety valves have been replaced at all VVER-440 plants (e.g. Paks and Kozloduy 3&4) as a major hardware upgrade to facilitate effective and fast depressurization of the primary system. Tables 4 to 6 give, for each potential challenge (in the first column), the accident phenomenology which will take place (second column), the existing safety features which should be used or recovered (third column) and those features or counter-measures which could be put in place to mitigate the accident (fourth column).
Once primary system pressure has been reduced, the accident would still progress to vessel failure and melt release, unless further mitigation measures are taken. An obvious option is the recovery of the Emergency Core Cooling (ECC), although it relies on AC power availability. A further measure to prevent vessel failure is the external cooling of the vessel by flooding the cavity. Of course this measure requires an assessment of the design capability and the implementation of needed design modifications (see paragraph 2.2.2).
The third safety objective in table 3 "Prevention of confinement failure" refers to the confinement integrity. This objective could be reached with counter-measures able to face three major challenges (table 5). Hydrogen combustion, for example, could be mitigated or avoided by the installation of recombiners.
Finally, the fourth safety objective “Limitation of radioactive release from confinement”, shown in table 6, could be reached with counter-measures able to face three more main challenges: 1) a confinement isolation failure; 2) a confinement by-pass and 3) a confinement failure.
Safety objective: Prevention of reactor vessel failure Challenge Accident phenomena Existing safety system
Possible mitigation system Comment High pressure vessel failure
High pressure melt ejection (HPME); DCH, FCI and MCCI
Primary system depressurisation; ECC recovery IVMR by flooding the reactor cavity Primary system depressurization (emergency procedures) Low pressure vessel failure
Corium slump into cavity;
Ex-vessel FCI and MCCI
ECC recovery IVMR by flooding the reactor cavity
Table 4: Prevention of reactor vessel failure for a VVER-440 (Techy Z. et al., 1994)
Safety objective: Prevention of Confinement Failure Challenge Accident phenomena Existing Safety System Possible Mitigation System Comment Slow pressurisation Steam pressurization; Pressurisation by non-condensable Gases Confinement spray system Dedicated SAM leakage control / spray system (e.g HIERARCH); Filtered venting See par. 2.2 Hydrogen combustion/ detonation - Recombiner; Igniter+ recombiner+ SAM l.c. / spray system; Inerting + recombiner See par. 2.2; Leakage control / spray system must
be operated in order not to induce
H2 combustion High pressure vessel failure Primary system depressurisation - Fast pressurisation Fuel – coolant
interaction (FCI) - - FCI is not feasible in a dry cavity; unsuccessful
in-vessel melt retention may lead
to FCI Molten corium– concrete interaction (MCCI) - Flooding of the cavity; Spreading of debris
outside the cavity; Core catcher system Melt attack Temperature induced failure (Failure of the cavity door) - Flooding of the cavity; Passive cooling of
the cavity door from external side
In case of flooded cavity (IVMR) MCCI and door
challenge are avoided
Safety objective: Limitation of radioactive release from confinement Challenge Accident Phenomena Existing Safety System Possible Mitigation System Comment Isolation
failure vessel release to In-vessel or ex-confinement
atmosphere
Confinement
spray system Leakage control / SAM spray system Same as for confinement atmosphere releases By-pass SGTR
Interface LOCA Primary system Loop isolation; depressurisation - Level 1-PSA should underline the relative importance of the sequence Release from confinement atmosphere Corium debris retained in-vessel; Corium debris released from the
vessel; Hydrogen combustion / Detonation Confinement spray system Leakage control / SAM spray; Flooding corium debris; Leakage control / SAM spray; Filtered venting See par. 2.2
Table 6: Limitation of radioactive release from a VVER-440 confinement (Techy Z. et al., 1994) 2.1.2 Level 1&2 Probabilistic Safety Assessments (PSAs)
Level 1 PSA: Level 1 PSAs give the core damage frequency (CDF) following one or more
initiating events. The first Level 1 PSA study (for operation at nominal power) for the Bohunice V2 NPP was prepared in the framework of the SAR after 10 years of operation in 1994.
The objectives of the study were as follows: 1) to determine the CDF; 2) to identify initiating events and accident sequences with dominant contribution to core damage.
The events considered in the study included initiating events (transients and LOCA), internal fires and internal floods. In a majority of cases, the PSA used plant operational data for the individual intensities of component failures; literature generic data were used whenever plant data were not available.
The first results, as of 1995, led to a CDF estimation of about 6.41E-04 / year. Main conclusions of the study were:
1) initiating events as break of main steamline, main steam header or feed-water header have a dominant contribution on CDF ( 41%);
2) operator errors to take remedial recovery actions during accidents are among the major factors contributing towards CDF (82.7%);
3) symptoms-oriented emergency procedures for operating staff should be developed;
4) independent SG feed water lines should be installed from the emergency feed water system. The PSA Level 1 model was updated to reflect further modernization measures implemented as of July 1997 (electric supplies to distribution switchboards, valves in water system and new emergency operating procedures). The updated model was also modified in order to be used in a real-time risk monitoring system (i.e. a “Safety Monitor” see Passalacqua R. and Fumiaki Y., 2002, for an example on the use of a risk monitoring system in NPPs). The re-evaluated CDF was 1.33E-04 / year.
The study also identified an important contribution to the CDF by potential clogging of strainers at the emergency core cooling system pumps suction. Therefore, after replacement of the ECCS pumps strainers and a further improvement based on the adoption of the so-called “symptom-oriented emergency operating procedures” (EOPs), the final CDF, as of 1 January 2000, was 7.36E-05 /year (Figure 6).
Figure 6: Comparison of PSA studies for the Bohunice V2 reactors (VVER-440/213)
The implementation of these (Westinghouse-designed) EOP emergency procedures, afterwards put in place in almost all VVER plants, has led to a reduction of the CDF by a factor 35.4%.
Low-power and shutdown level 1 PSA: the level 1 low-power and shutdown PSA study (SPSA)
for the Bohunice V2 reactors (VVER-440/213) was completed in 1999. The project was financed under the PHARE programme and presently represents the most comprehensive probabilistic risk assessment for shutdown VVER-440 reactors. After an improvement of normal and emergency shutdown procedures, the CDF has been further reduced: the CDF for SPSA conditions is now comparable to CDFs for power operation and equal to 6.44E-04 / year.
Level 2 PSAs: current PSAs of level 2, combined to the results of level 1 PSAs, estimate the
consequence (source term) and probability of a specific accident. Table 7 below shows results of a level 2 PSA for the VVER-440\213 of Paks NPP (Lajtha G., 2003). This level 2 PSA covers all accident event trees emerging from:
1) internal initiating events at nominal power;
2) internal initiating events emerging at shutdown states; 3) internal hazards as fire and flooding at nominal power.
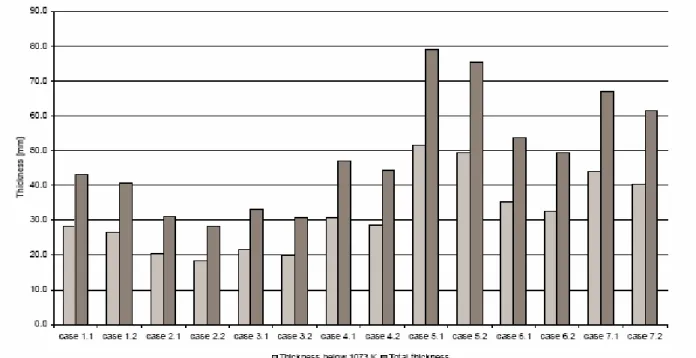
Table 7 is based on source term estimations as, for example, the release of caesium iodide to the environment which is shown in figure 7. This figure gives the fraction of the total CsI inventory for eleven assumed accident sequences (from table 7). For each sequence there are two columns (min and max releases) showing the results of a sensitivity/uncertainty analysis (Lajtha G., 2005). Cases #5 and #9 of table 7, respectively late confinement rupture (without spray) and late rupture with spray are not included in figure 7 since it has been found that late leak and late rupture yield to a very similar atmospheric release (which is reasonable). The estimation of the fission product release and transport (from fuel to environment) has been calculated with the MAAP code. Table
8 shows the corresponding categorization (of the thirteen “release categories” of table 7) versus the importance of the source term (release timing and intensity): HPMEs sequences are potentially those sequences able to generate the largest radioactive release.
Release category Frequency 1/year 1 High pressure RPV rupture <1E-8
2 By-pass <1E-8
3 Early confinement rupture 3.65E-6 4 Early enhanced confinement leakage <1E-8 5 Late confinement rupture <1E-8 6 Late enhanced confinement leakage 1.49E-5 7 Early confinement rupture with spray 1.01E-6 8 Early enhanced confinement leakage with spray <1E-8 9 Late confinement rupture with spray <1E-8 10 Late enhanced confinement leakage with spray 4.95E-8
11 Intact confinement 0
12 Intact confinement with spray 8.51E-6
13 Partial core damage 6.65E-6
Open confinement, shutdown
14 Drop of heavy loads 4.32E-6
15 Loss-of fuel 3.14E-6
Table 7: Results of a level 2-PSA for a VVER-440\213 (Paks NPP)
C sI R elease R ate into the E nvironm ent
1.00E-09 1.00E-08 1.00E-07 1.00E-06 1.00E-05 1.00E-04 1.00E-03 1.00E-02 1.00E-01 1.00E+00 H PM E Bypass Early rupture
Early Leak Early rupture,
spray
Late leak Intact Early leak, spray
Late leak, spray
Intact, spray Partly degraded
core
Release Rate
Consequence Category Cs release (A) [TBq] Release categories Frequency [1/year] I A > 1E+5 1 6.83E-8
II 1E+5 > A > 1E+4 2,3 3.88E-6 III 1E+4 > A > 1E+3 7 1.01E-6 IV 1E+3 > A > 1E+2 4,5,6,10,11 1.50E-5 V 1E+2 > A 8,9,12,13 1.52E-5
Table 8: Health consequences versus release categories for a VVER-440\213 (Paks NPP)
A level 2 PSA can be used to show the impact of a specific accident management measure. In fact after modelling a hypothetical SAM measure, the distribution of the “release category” frequencies could be significantly modified. For example for the Paks NPP (Lajtha G. and Téchy Z., 2004) the frequency of the most severe sequences belonging to the “consequence category I” (table 8) could become “not significant” by implementing a strategy of external cooling of the vessel or by further separation (air-tightness) of the cavity; the frequency of the “consequence category II” representing early confinement failure could be reduced to one third of the present value by installing hydrogen recombiners; through hydrogen management also the frequency of “category III” can be reduced to one fourth of the value of table 8; flooding the reactor cavity slows down basemat ablation and could bring to a halt the vessel melt-through with a significant reduction of the frequency of categories IV and V.
This methodology for the verification of a SAM strategy will be discussed in the following paragraph 3.2.
2.2 VVER-440 severe accident sequences
The management of severe accidents has received strong attention in these last years. In particular after implementation of the “Symptom-Oriented Emergency Procedures” (EOPs), the entry point to the “severe accident” management had been concretely defined as “core conditions for which the temperature of the coolant at the core-exit reaches 550 C”. Note that this is the value assumed at Paks NPP, whilst Kozloduy NPP experts have assumed/estimated a temperature limit of 650 C for the VVER-440 (units 3&4).
Once typical conditions for a severe accident are reached (the above “entry point”), the accident progression is described in terms of an initial “in-vessel phase” and a consequent “ex-vessel phase”. Therefore the management of a severe accident first requires actions aiming at halting the vessel melt-through, even if a massive damage of the core cannot be avoided. In this case, a long-term cooling of the corium relocated in the bottom-head of the vessel must be assured within an intact reactor vessel. Alternatively, when the plant geometry allows for such a measure (see par. 2.2.2) an ex-vessel cooling system must be put in place in order to cool down the relocated corium through the vessel walls.
VVER reactors have large water inventories (see Appendix 1) which provide for a longer grace-period before core damage. However, core cooling conditions are slightly poorer than in PWRs of similar size and blockages and failures of core structures are more probable (because of shrouds on fuel and control rods assemblies as well as followers and structures below the core). Therefore, also because of the stronger interaction between core materials (stainless steel) and cladding
(Zr1%Nb alloy), core degradation occurs with a time-scale very similar to the one of PWRs of equivalent size.
The shrouds of VVER-440 provide for an additional Zr surface able to react with steam and to produce hydrogen. The follower part of the control rods assembly, under the core, can interact with steam even in dry-core conditions. These features enhance oxidation conditions and are the cause of a higher hydrogen generation (than in PWRs). Furthermore, the fuel assemblies’ shrouds may hamper the radial spreading of molten materials whilst the melting of the absorber part of the control rods assemblies can create large channels for a downward-directed flow of melts.
Hydrogen accumulated in the confinement building, during the in-vessel phase, becomes a major challenge especially when the ex-vessel phase is reached. And this because of two possible accident mechanisms: 1) further production of hydrogen during potential “Direct Containment Heating” (DCH) occurring at high pressure scenarios (HPMEs) – the corium debris could be finely dispersed by the carrier steam and much further oxidised; and 2) steady generation of hydrogen during the resulting interaction of corium with the reactor cavity basemat (MCCI).
2.2.1 Initiating SA sequences and SA phenomenology
The accident sequences discussed in this paragraph are those giving the largest contribution to the Core Damage Frequency (CDF). These dominant sequences are essentially Pressurised Thermal Shocks (PTS), primary and secondary side LOCA and Station Black-Out (SBO) with subsequent unavailability of ECCSs (see for example paragraph 2.1.2 and figure 88).
When assuming unavailability of emergency cooling, the above-mentioned accidents lead to a vessel melt-through even if hydroaccumulators are available (for 440/213 and VVER-1000). LOCA accidents, if not halted before the vessel melt-through, always lead to a low-pressure (vessel melt-through) scenario. Therefore DCH does not occur, but MCCI is maximised since the whole amount of corium debris will fall into the reactor cavity. SBO sequences might have a HPME or a LPME depending on PORVs’ behaviour (pressuriser’s power operated relief valves).
2.2.1.1 Small Break LOCA: a small-break LOCA sequence (32 inches-equivalent diameter) for
VVER-440/V230 reactors (Sartmadjiev S., 2004) is here studied by means of the MELCOR-1.8.4 code.
ECCS is assumed to be available only during the initial direct injection (pumps of one train of the HPIS are available; HPIS starts operation at pressure below 105 bar and is assumed to fail when switched to the recirculation mode). CSS is available (one train), but it is stopped at the beginning of core degradation (operators’ action). Hydrogen recombiners (PARs) are available. Also the FVS (Filtered Venting System) coupled to the so-called HIERARCH system (see Appendix 1) is available and it is assumed to start 3000 seconds after core heatup. The main target is to avoid important pressurization of the confinement and to mitigate all possible (confinement) leaks. The FVS/HIERARCH has shown the capability to maintain the content of hydrogen under deflagration limits (also during the ex-vessel phase) by means of injection of steam in the SG box (the volume where SGs are located). The FVS could also be used during CSS operation in order to limit the sub-cooling of the confinement (leading to a sub-atmospheric pressure).
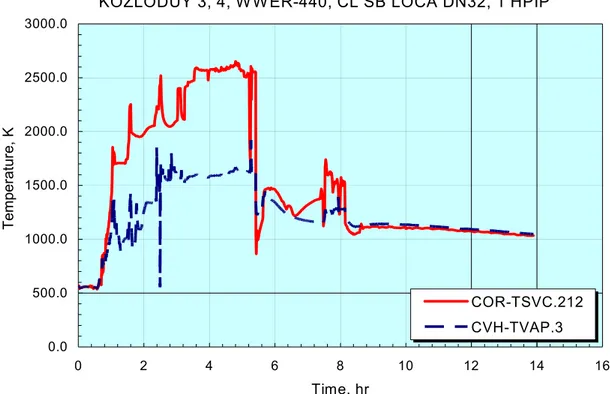
Figure 8 shows the coolant injection flow by HPIS (1 train) which is assumed to end at about 2200 seconds (0.6 hr). Figure 9 gives the trend of primary (and secondary) pressure during the LOCA (the coolant level inside the vessel is shown in figure 10). At about 5.5 hr from the onset of the accident a major collapse of corium occurs (which is the cause of a pressure peak).
Figure 11 gives the fuel temperature (assumed to melt and relocate at about 2500 K) whilst figures 12 and 13 give the coolant temperature at several locations in the upper plenum and at the core exit.
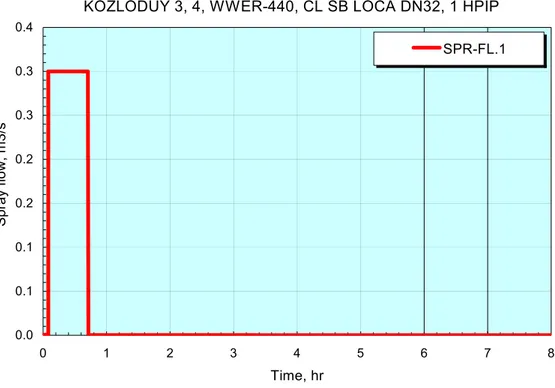
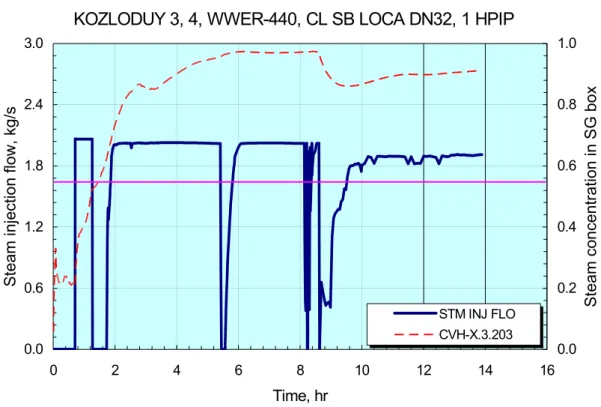
Figure 14 shows the CSS operation which ends, by operators’ action, after 3000 seconds in order to reduce the risk of hydrogen combustion. This risk is caused by the fact that in the initial CSS direct injection the cold droplet are condensing steam and reducing the steam concentration to the benefit of the hydrogen concentration (which increasing may reach the deflagration limit). Therefore, instead of CSS, the HIERARCH system is operated (figure 15) in a way that the increase of confinement (SG box) pressure by steam injection is compensated by extraction of gas by the FVS (figure 16). In other words, the steam injection flow rate is pressure-controlled and the maximum injection flow rate is limited to 2 kg/s (blue trend in figure 17).
Figure 17 shows that the FVS/HIERARCH system is slightly less effective in reducing the confinement pressure than the CSS, but more effective in managing the risk of hydrogen combustion: figure 18 shows the increase of steam concentration able to inert the confinement atmosphere.
Figures 19 and 20 show the total hydrogen balance (removed versus generated) in the confinement building, whilst figure 21 gives the relative concentration of steam, oxygen and hydrogen.
Figure 22 and 23 give the fractional release (to the total inventory) of iodine and caesium. Figure 24 shows the iodine release to the environment because of the confinement leakage and the uptake in the FVS (as well as the iodine uptake in the JVC).
Since there is no coolant injection in the primary system, the vessel bottom head fails at about 8.5 hr and hydrogen concentration increases significantly (figures 19 and 20). SAM actions should start as soon as core heat-up starts (after about 1 hr from the onset of the accident –see figure 12), but the plant response is quite slow and this gives more time for operators’ actions.
In conclusion MELCOR predictions confirm that operation of the FVS/HIERARCH leads to a successful SAM strategy through an inert atmosphere and mitigation of confinement leakages. This strategy is accomplished switching off the CSS as soon as core heat-up starts. Also the source term is strongly reduced by the retention efficiency of the FVS, which is estimated to be 10000 for aerosols and 500 for iodine (vendor’s data). During the initial phase of the accident the release of FPs through the JVC is rather significant, but after the start of the FVS the release is mainly through it. The direct release through the confinement leaks is (more than) one order of magnitude lower (figure 24).
Figure 25 shows that the dose at a distance of 30 km from the plant (estimated by the MACCS code assuming atmospheric stability, no precipitation and a wind speed of 0.5 m/s) is 0.034 rem for the body and 0.285 rem for the thyroid (Cs-137 accounts for about 5.54 TBq whilst I-131 accounts for about 5850 TBq during the first 14 hours after the onset of the accident).
KOZLODUY 3, 4, W W ER-440, CL SB LOCA DN32, 1 HPIP 0.0 5.0 10.0 15.0 20.0 25.0 30.0 35.0 40.0 0.0 0.5 1.0 1.5 2.0 Time, hr H P IS fl ow , k g/s CFVALU.140
Figure 8: HPIS injection flow
KOZLODUY 3, 4, W W ER-440, CL SB LOCA DN32, 1 HPIP
0.0E+00 2.0E+06 4.0E+06 6.0E+06 8.0E+06 1.0E+07 1.2E+07 1.4E+07 0 2 4 6 8 10 12 14 16 Time, hr Pr es su re , Pa CVH-P.40 CVH-P.7 CORE RELOCATION
KOZLODUY 3, 4, WWER-440, CL SB LOCA DN32, 1 HPIP 0.0 2.0 4.0 6.0 8.0 10.0 12.0 14.0 0 2 4 6 8 10 12 14 16 Time, hr R P V lev el, m RPV level
Figure 10: Coolant level in the reactor vessel
KOZLODUY 3, 4, W W ER-440, CL SB LOCA DN32, 1 HPIP
0.0 500.0 1000.0 1500.0 2000.0 2500.0 3000.0 0 1 2 3 4 5 6 7 8 Time, hr Tem perat ur e, K COR-TFU.207 COR-TFU.208 COR-TFU.209 COR-TFU.210
KOZLODUY 3, 4, W W ER-440, CL SB LOCA DN32, 1 HPIP 0.0 500.0 1000.0 1500.0 2000.0 2500.0 3000.0 0 2 4 6 8 10 12 14 16 Time, hr T emperatur e, K COR-TSVC.212 CVH-TVAP.3
Figure 12: Temperature at the core exit and in the upper plenum
KOZLODUY 5, 6 - WWER-1000/V-320, total loss of heat sink, 1 CAV
0.0 500.0 1000.0 1500.0 2000.0 2500.0 3000.0 3500.0 4000.0 4500.0 0 10 20 30 40 50 60 70 Time, hr Te mp er at ur e, K COR-TSVC.210 CVH-TVAP.110 CVH-TVAP.115
KOZLODUY 3, 4, WWER-440, CL SB LOCA DN32, 1 HPIP 0.0 0.1 0.1 0.2 0.2 0.3 0.3 0.4 0 1 2 3 4 5 6 7 8 Time, hr S pra y fl ow , m3/s SPR-FL.1
Figure 14: CSS volumetric flow
PRESSURE CONTROLLED OPERATION STEAM INJCTION AND FVS EXTRACTION
0.0 1.0 2.0 3.0 4.0 5.0 6.0 0.80 0.85 0.90 0.95 1.00 1.05 1.10 1.15 1.20
SG box pressure, bar
FVS volumetric flow, m3/s 0.0 0.2 0.4 0.6 0.8 1.0 1.2 Steam inje ctio n flo w , kg/s FVS vol.flow Steam injection
KOZLODUY 3, 4, WWER-440, CL SB LOCA DN32, 1 HPIP 0.0 1.0 2.0 3.0 4.0 5.0 6.0 0 2 4 6 8 10 12 14 16 Time, hr F V S v ol um f lo w , m 3/s FVS volum.flow
Figure 16: FVS volumetric flow
Figure 17: Containment pressure vs. steam injection rate
KOZLODUY 3, 4, WWER-440, CL SB LOCA DN32, 1 HPIP
0.0 0.5 1.0 1.5 2.0 2.5 0 2 4 6 8 10 12 14 16 Time, hr
Steam injection flow, kg/s
8.0E+04 9.0E+04 1.0E+05 1.1E+05 1.2E+05 1.3E+05 Pressur e, P a STM INJ FLO CVH-P.203
KOZLODUY 3, 4, WWER-440, CL SB LOCA DN32, 1 HPIP 0.0 0.6 1.2 1.8 2.4 3.0 0 2 4 6 8 10 12 14 16 Time, hr Stea m inje ction flow, kg /s 0.0 0.2 0.4 0.6 0.8 1.0 Ste am co ncen tratio n in SG box STM INJ FLO CVH-X.3.203
Figure 18: Steam concentration in SG box vs. steam injection rate
Figure 19: H2 balance – generation and removal
KOZLODUY 3, 4, WWER-440, CL SB LOCA DN32, 1 HPIP
0.0 100.0 200.0 300.0 400.0 500.0 600.0 0 2 4 6 8 10 12 14 16 Time, hr H 2 mass , kg CAV-MEX.H2.1 CFVALU.761 COR-DMH2-TOT FL-I-MFLOW.4.620 ex-vessel in-vessel extracted by FVS recombined
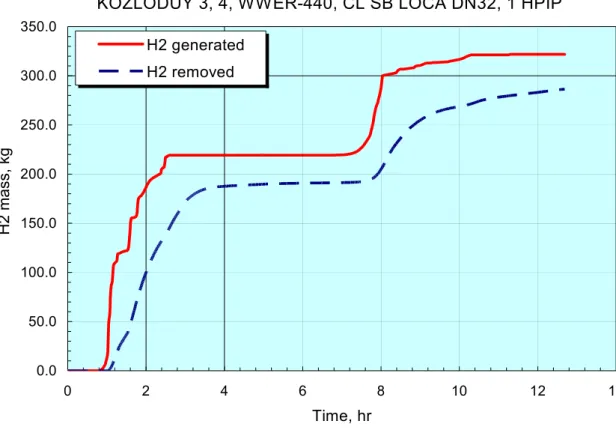
KOZLODUY 3, 4, WWER-440, CL SB LOCA DN32, 1 HPIP 0.0 100.0 200.0 300.0 400.0 500.0 600.0 700.0 800.0 0 2 4 6 8 10 12 14 16 Time, hr H2 mass, kg H2 generated H2 removed
Figure 20: H2 balance – generated and removed mass
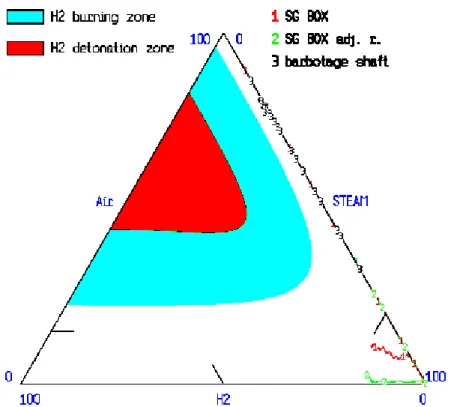
Figure 21: Steam (volumetric) concentration of steam (red), O2 (green) and H2 (blue) in SG box
KOZLODUY 3, 4, WWER-440, CL SB LOCA DN32, 1 HPIP
0.0 0.2 0.4 0.6 0.8 1.0 0 2 4 6 8 10 12 14 16 Time, hr Volum et ric concent ration in SG box CVH-X.3.203 CVH-X.4.203 CVH-X.5.203
Figure 22: Source term – Iodine – fraction of the core inventory
Figure 23: Source term – Caesium – fraction of the core inventory
KOZLODUY 3, 4, WWER-440, CL SB LOCA DN32
0.0E+00 5.0E-06 1.0E-05 1.5E-05 2.0E-05 2.5E-05 0 2 4 6 8 10 12 14 16 Time, hr Fr ac tion CS
KOZLODUY 3, 4, W W ER-440, CL SB LOCA DN32
0.0E+00 5.0E-04 1.0E-03 1.5E-03 2.0E-03 0 2 4 6 8 10 12 14 16 Time, hr Fractio n I
Figure 24: Iodine source term (fraction of total inventory) by different paths
Figure 25: Dose evaluation – MACCS code
KOZLODUY 3, 4, WWER-440, SB LOCA DN32, LOSS OF ECCS, MACCS
1.0E-04 1.0E-03 1.0E-02 1.0E-01 1.0E+00 1.0E+01 0 10 20 30 40 50 60 Distance, km Dose, Sv effective absorbed by thyroid Beyond 30 km:
- effective dose - 0.034 REM - thyroid - 0.285 REM
KOZLODUY 3, 4, WWER-440, CL SB LOCA DN32
0.0E+00 5.0E-04 1.0E-03 1.5E-03 2.0E-03 2.5E-03 3.0E-03 0 2 4 6 8 10 12 14 16 Time, hr Fr act ion leak to envir. FVS JVC
A second sub-scenario of this sequence (DN32 SB-LOCA) has been simulated in order to show the effect of a temporary recovery of the HPIS (between 9150 and 15350 seconds, figure 26).
This calculation shows that part of the fuel reaches melting temperatures and it relocates (e.g. at location # 209 and 210 in figure 27), but the majority of the core does not undergo through a major degradation. Therefore such a coolant injection is definitely beneficial for VVER-440, with limited confinement capabilities, if performed before around 4-5 hours from the onset of the accident (compare figure 11 to figure 27).
The quenching of the core fuel by the second HPIS coolant injection has the effect to stop hydrogen generation for some time (figure 28). However, once coolant level starts decreasing again (figure 30), the total hydrogen mass released during the in-vessel phase of the accident is even larger of the one previously calculated (320 kg against 300 kg -compare figure 19 and 30). Note that, thanks to the temporary recovery of the coolant, the vessel melt-through is considerably postponed (after about 14 hr instead of 8.5 hr).
Significant mitigation of the hydrogen risk is achieved by the FVS (operating at higher extraction flow rate) and the PAR systems (figure 31). Confinement steam concentration, pressure and composition versus steam injection by the HIERARCH system are shown in figures 33 to 35). Note that the FVS extraction rate has been increased to about 4 kg/s (figure 36).
Figure 26: HPIS flow rate
KOZLODUY 3, 4, WWER-440, CL SB LOCA DN32, 1 HPIP
0.0 5.0 10.0 15.0 20.0 25.0 30.0 35.0 40.0 0 2 4 6 8 10 12 14 Time, hr H P IS fl ow , k g/s CFVALU.140
Figure 27: fuel temperature
Figure 28: H2 generation vs. HPIS injection
KOZLODUY 3, 4, WWER-440, CL SB LOCA DN32, 1 HPIP
0.0 50.0 100.0 150.0 200.0 250.0 300.0 350.0 400.0 0 2 4 6 8 10 12 14 Time, hr H2 mass ge nerat ed, kg 0.0 5.0 10.0 15.0 20.0 25.0 30.0 35.0 40.0
HPIS flow rate,
kg/s
COR-DMH2-TOT CFVALU.140 KOZLODUY 3, 4, WWER-440, CL SB LOCA DN32, 1 HPIP
0.0 500.0 1000.0 1500.0 2000.0 2500.0 3000.0 0 5 10 15 20 Time, hr Tem per at ur e, K COR-TFU.207 COR-TFU.208 COR-TFU.209 COR-TFU.210
Figure 29: H2 generation vs. fuel temperature
Figure 30: H2 generation vs. coolant level in reactor vessel
KOZLODUY 3, 4, WWER-440, CL SB LOCA DN32, 1 HPIP
0.0 2.5 5.0 7.5 10.0 12.5 15.0 0 2 4 6 8 10 12 14 Time, hr RP V level, m 0.0 60.0 120.0 180.0 240.0 300.0 360.0 H2 g ene ration, kg RPV LEV COR-DMH2-TOT
KOZLODUY 3, 4, WWER-440, CL SB LOCA DN32, 1 HPIP
0.0 500.0 1000.0 1500.0 2000.0 2500.0 3000.0 3500.0 0 2 4 6 8 10 12 14 Time, hr Fuel te mpe rature , K 0.0 50.0 100.0 150.0 200.0 250.0 300.0 350.0 H2 g ene ration, kg COR-TFU.208 COR-DMH2-TOT
Figure 31: H2 balance – generation and removal
Figure 32: H2 balance – generated and removed mass KOZLODUY 3, 4, WWER-440, CL SB LOCA DN32, 1 HPIP
0.0 50.0 100.0 150.0 200.0 250.0 300.0 350.0 0 2 4 6 8 10 12 14 Time, hr H2 mass , kg H2 generated H2 removed
KOZLODUY 3, 4, WWER-440, CL SB LOCA DN32, 1 HPIP
0.0 50.0 100.0 150.0 200.0 250.0 300.0 350.0 0 2 4 6 8 10 12 14 Time, hr H2 mass , kg CFVALU.761 COR-DMH2-TOT FL-I-MFLOW.4.620 H2 generated H2 extracted by FVS H2 recombined
Figure 33: Steam concentration vs. steam injection flow rate
Figure 34: Pressure vs. steam injection flow rate
KOZLODUY 3, 4, WWER-440, CL SB LOCA DN32, 1 HPIP
0.0 0.5 1.0 1.5 2.0 2.5 0 2 4 6 8 10 12 14 Time, hr Steam in jectio n flow, kg/s 8.0E+04 9.0E+04 1.0E+05 1.1E+05 1.2E+05 1.3E+05 Pres sure, P a STM INJ FLO CVH-P.203 core relocation to LP
KOZLODUY 3, 4, WWER-440, CL SB LOCA DN32, 1 HPIP
0.0 0.6 1.2 1.8 2.4 3.0 0 2 4 6 8 10 12 14 Time, hr Steam in jectio n flow, kg/s 0.0 0.2 0.4 0.6 0.8 1.0 Stea m concen tr ation in SG b ox STM INJ FLO CVH-X.3.203
Figure 35: Steam (red line), O2 (green line) and H2 (blue line) concentrations in SG box
Figure 36: FVS volumetric flow rate
KOZLODUY 3, 4, W W ER-440, CL SB LOCA DN32, 1 HPIP
0.0 1.0 2.0 3.0 4.0 5.0 6.0 0 2 4 6 8 10 12 14 Time, hr F V S vol um fl ow , m3 /s FVS volum.flow
KOZLODUY 3, 4, WWER-440, CL SB LOCA DN32, 1 HPIP
0.0 0.1 0.2 0.3 0.4 0.5 0.6 0.7 0.8 0.9 1.0 0 2 4 6 8 10 12 14 Time, hr Vo lumet ric concentr ation in S G box CVH-X.3.203 CVH-X.4.203 CVH-X.5.203
Different assumptions on the partial availability of emergency coolant have been tested in order to assess the influence on the timing of the vessel failure and to estimate the load to the confinement building. For example:
2.2.1.1.1 When only 25% of HPIS capacity is available –It has been demonstrated (Sartmadjiev S., 2004) that through opening/closing (throttling) of the HPIS it is possible to cool down the core and essentially to avoid the vessel melt-through (HPIS has been assumed to inject coolant: 1) before relocation of the fuel at 6000 s; 2) just after the start of fuel relocation at 12100 s and 3) when the fuel is relocated in the bottom-head lower plenum at 18000 s).
At each injection of coolant there is a subsequent increase of the primary pressure, but HPIS are still able to inject water into the primary system.
Hydrogen generation is affected by the coolant injection only during the early phases of the accident when still large amount of Zr is not oxidized. However, again, only the timing is affected and not the total in-vessel H2 mass generation.
The quenching of the core takes about 1-3 hours. The more degraded the core is and respectively, the more heated up the materials inside RPV are, the longer is the quenching time. However, after a few hours the materials inside the vessel would be quenched and this would allow the operator to increase the injection flow in order to manage the accident.
Earlier start of coolant injection leads to a more efficient cool-down of RPV. When core is relocated in the lower plenum the cool-down is not very efficient: the analysis has shown that there is cooling of the particulate debris, but the cool-down is very slow and therefore late injection may results in bottom-head failure.
2.2.1.1.2 When only LPIS is available –if HPIS is unavailable, but it still possible to use the LPIS, the primary system needs to be depressurized well below the shutoff head pressure of LPIS pumps (7 bar). This strategy might not be able to avoid a RPV failure, but it could be useful also after it. The water that enters RPV will spill out to the reactor cavity through the hole in the bottom of RPV. Water injection in the cavity would have a positive effect because of the cooldown of the corium, the scrubbing of the FP aerosols that are released as a result of the MCCI and because of the confinement atmosphere inerting effect (see paragraph 5.2 for a quantitative assessment of this ex-vessel SA management).
In case of late injection of LPIS water to the RPV it is possible to have a relatively high-primary pressure at the time of BH failure (because of the fuel-coolant interaction). To avoid this situation, with associated fuel dispersal and DCH, a strategy for depressurization of the primary system prior to initiation of the water injection should be carried out. The analyses have shown that these two actions must be performed sequentially (initial depressurization prior to injection of water to RPV) in order to avoid or minimize a possible primary system pressurization and thus reducing the DCH risk (and possible worst radiological consequences to the environment while applying this strategy).
PORVs’ (i.e. SEBIM valves in KNPP 3&4) operation is sufficient to depressurize the primary system also in case of small break LOCA. To allow a fast depressurization it is possible to open also the 2 existing pressurizer’s SVs (SEMPELL valves in KNPP 3&4). The capacity of the 3 valves (PORVs + 2 SVs) is sufficient to depressurize the primary system to a pressure low enough to exclude DCH.
2.1.1.2 Station Black-Out scenario: This sequence has a relatively slow accident progression
which could allow for a procedure aiming at re-establishing the heat removal capability (even in case of a long-lasting station black-out) by means of portable pumps and coolant tanks for example by intervention of fire brigades (Muellner N. et alii., 2004). If external intervention is not possible, the accident will develop in a high pressure-melt ejection scenario.
Initially the decay heat is removed (from core to SGs) thanks to natural recirculation. The large water inventories in both, primary and secondary sides of VVER-440 reactors help in delaying core degradation, however, the continuous reduction of water inventory in the horizontal SGs (because of the need to dump steam to the atmosphere) and further reduction of the heat extracted from the core will result in an increase of primary coolant temperature and pressure in the primary system.
A VVER-440/213 reactor has been modelled with the ASTECv1.1 code in the frame of the SARNET project of the 6th Framework Programme (Barnak, M., Matejovic P., 2005). Relocation of control rods and failure of core plates is assumed to occur at 1730 K (melting point of stainless steel) whilst clad failure is modelled at 2500 K (clad thickness is < 300 µm). Fuel rod relocation occurs at 2800 K. The results of the ASTEC code calculations are summarised in table 9.
Parameter ASTECv1.1
Water level in SG < 0.2 m at time [hr] 4.7-5.3 PRZ PORVs valve activated at time [hr] 7.18
Tclad > 550 °C at time [hr] 9.08 Cladding failure at time [hr] 9.93 First slump of corium to LP [hr] 10.00
Time of vessel rupture [hr] 11.49 Total mass of melt in reactor [t] 8.41 H2 mass produced during the in-vessel phase [kg] 194.3
End of computation ~vessel failure [hr] 11.49
Table 9: ASTEC predictions for a SBO sequence (Barnak, M., Matejovic P., 2005)
ASTEC results are summarised in figures 37 to 45. Some of these figures show a comparison of three ASTEC sub-calculations in which different options for the core degradation model have been used (for example the molten corium mass has been modelled with the “magma” option in case 3 which however seems still not reliable -calculation has crashed).
The results show that if power is not recovered by any means some time before 8-9 hours, attempts to cool down the core after this time would only further increase the primary pressure and accelerate the BH vessel melt-through causing a worse HPME with a DCH of a sufficient extent to destroy the confinement building (figure 39 shows that confinement pressure increases remarkably even before the vessel failure). Figure 41 shows that hydrogen concentration in the SG boxes strongly increases when reaching the timing of the vessel failure. After this time (here not calculated), if actions of H2 recombination or venting are not implemented, deflagration conditions (figure 45) are reached.
Figure 37: Fuel and vessel temperatures
Figure 39: Primary pressure
Figure 41: Hydrogen molar concentrations in confinement
Figure 43: Total hydrogen production