EXPERIMENTAL STUDY
FOR HI
XCONCENTRATION
BY ELECTRO-ELECTRODIALYSIS (EED)
CELLS IN THE WATER SPLITTING
SULFUR-IODINE THERMOCHEMICAL CYCLE
G. CAPUTO, A. GIACONIA, S. SAU, C. FELICI
Energy Technology Department Heat and Thermodynamic Solar Division Solar Technologies Engineering Laboratory Casaccia Research Centre, Rome
A. POZIO
Energy Technology Department
Energy Efficient Production, Conversion and Use Division
Chemicaland Thermo-Fluid Dynamic Energy Process Development Laboratory Casaccia Research Centre, Rome
RT/2016/10/ENEA
ITALIAN NATIONAL AGENCY FOR NEW TECHNOLOGIES, ENERGY AND SUSTAINABLE ECONOMIC DEVELOPMENT
G. CAPUTO, A. GIACONIA, S. SAU, C. FELICI
Energy Technology Department Heat and Thermodynamic Solar Division Solar Technologies Engineering Laboratory Casaccia Research Centre, Rome
EXPERIMENTAL STUDY
FOR HI
X
CONCENTRATION
BY ELECTRO-ELECTRODIALYSIS (EED)
CELLS IN THE WATER SPLITTING
SULFUR-IODINE THERMOCHEMICAL CYCLE
A. POZIOEnergy Technology Department
Energy Efficient Production, Conversion and Use Division Chemical and Thermo-Fluid Dynamic Energy Process Development Laboratory Casaccia Research Centre, Rome
RT/2016/10/ENEA
ITALIAN NATIONAL AGENCY FOR NEW TECHNOLOGIES, ENERGY AND SUSTAINABLE ECONOMIC DEVELOPMENT
I rapporti tecnici sono scaricabili in formato pdf dal sito web ENEA alla pagina http://www.enea.it/it/produzione-scientifica/rapporti-tecnici
I contenuti tecnico-scientifici dei rapporti tecnici dell’ENEA rispecchiano l’opinione degli autori e non necessariamente quella dell’Agenzia
The technical and scientific contents of these reports express the opinion of the authors but not necessarily the opinion of ENEA.
EXPERIMENTAL STUDY FOR HIXCONCENTRATION BY ELECTRO-ELECTRODIALYSIS (EED)
CELLS IN THE WATER SPLITTING SULFUR-IODINE THERMOCHEMICAL CYCLE G. Caputo, A. Giaconia, S. Sau, C. Felici, A. Pozio
Riassunto
L'efficienza del processo di concentrazione/separazione dell’HI da una soluzione HIx, (miscela di HI/H2O/I2) rappresenta un fattore cruciale del processo di scissione dell'acqua per la produzione di idrogeno nel ciclo termochimico zolfo-iodio. In questo lavoro è stata condotto uno studio
sperimentale sulla concentrazione catodica dell’HI in una soluzione HIx utilizzando una cella di elettrodialisi (RED) alla pressione di 1 atm, a tre temperature diverse (25, 55 e 85 ° C) e con una densità di corrente pari 0.10 A cm-2. I risultati hanno mostrato che un aumento della concentrazione
di HI può essere ottenuto in determinate condizioni. Il numero di trasporto apparente (t+) in tutti gli esperimenti era prossimo ad 1, mentre il coefficiente di elettro-osmosi (ß) era compreso
nell’intervallo 1.08-1.16. I test hanno mostrato un aumento dello iodio rilevabile ma lento nel comparto anodico e dell’acido iodidrico in quello catodico.
Parole chiave: Reazione di Bunsen, Ciclo Zolfo-Iodio, elettrodialisi, scissione termica dell’acqua Abstract
The efficiency of HI concentration/separation from a HIx solution, (mixture of HI/H2O/I2) represents a crucial factor in the sulfur-iodine thermochemical water splitting process for hydrogen production. In this paper, an experimental study on HI cathodic concentration in HIx solution using stacked electro-electrodialysis (EED) cells was carried out under the conditions of 1 atm and at three different temperature (25, 55 and 85 °C) and using a current density of 0.10 A/cm2. Results showed that an increase in HI can be obtained under certain conditions. The apparent transport number (t+) in all the experiments was very close to 1, and the electro-osmosis coefficient (ß) changed in a range of 1.08-1.16. The tests showed a detectable, though slow, increase in both the anodic iodine and cathodic hydriodic acid concentrations.
1. Introduction 2. Experimental
2.1 Chemicals
2.2. Experimental set-up for EED 2.3 Concentration by EED
2.4 Transport properties of the membrane and energy consumption 3. Results and discussion
3.1 Concentration by EED
3.2 Durability of the membrane and of the electrodes in the HIx solution 3.3 Comparison between Bunsen-like mixture and mixture II 3.4 Energy consumption 4. Conclusions References 7 9 9 9 11 12 13 13 15 16 18 18 20 INDEX
7 1 - Introduction
Hydrogen is an attractive fuel for the future both for its ability to perform as an efficient energy carrier and its chance to be produced from renewable sources. One of the large scale most promising processes for hydrogen production is represented by the Sulfur-Iodine thermochemical cycle, first proposed by the General Atomics [1], which consists of different steps, leading to water thermal decomposition in its former components, hydrogen and oxygen (Fig. 1):
Fig. 1- Scheme of the General Atomics sulfur–iodine thermochemical water-splitting cycle [1]. In particular, the cycle can be schematized with three different chemical reactions, each one
representative of a section in Fig. 1:
• I2 + SO2 + 2 H2O → H2SO4 + 2 HI Bunsen Section (1) • 2 H2SO4 → 2 SO2 + 2 H2O + O2 Sulfuric Section (2) • 2 HI → I2 + H2 HIx Section (3)
8
liquid phase with the adsorption of sulfur dioxide; the reaction proceeds spontaneously in the 20-120°C temperature range [2].
The reaction products are composed by two immiscible liquid-phase systems: a lighter one containing mostly sulfuric acid (H2SO4) and the heavier one presenting a mixture containing HIx
species, that is, chemical complexes of HI and I2 in aqueous solution.
A correct separation among these two phases is needed in order to obtain a substantial efficiency from the S-I cycle, for this reason, it is necessary to use an excess of both water and iodine in the Bunsen reactor.
The decomposition of sulfuric acid (eq. 2) is a endothermic reaction generally carried out by a two-stage catalytic reactor (H2SO4 is easily decomposed in H2O e SO3 at 400-450°C and then SO3 is
further catalytically decomposed in SO2 and O2 at 850°C).
The section containing a mixture of iodine and iodides (HIx section), represents the most critical
point of the cycle, regarding both energy consumption and global efficiency.
In fact, hydrogen iodide (HI), must be separated from the HIx solution (HI/H2O/I2 mixture), exiting
the Bunsen reaction, before being decomposed for hydrogen generation (3). A simple option would consist of a distillation process followed by HI thermal decomposition, but, due to the presence of an azeotropic composition in the HI/H2O system (at about 57% w/w), distillation requires high
pressures and, consequently, a large thermal burden. Additionally, the low equilibrium conversion of HI decomposition (about 20% at suitable reaction temperatures) imposes a large HI recirculation rate, which results in a further increase of thermal burden and a decrease of the whole thermal efficiency. In order to overcome these problems, General Atomics studied an extractive distillation process using phosphoric acid [1-3]; alternatively, a reactive distillation configuration under pressurized conditions was also investigated [4-6]. More recently, the use of electro-electrodialysis [7-12], pervaporation processes with cation exchange membranes [13] and membrane distillation [14] was proposed to concentrate HI aqueous solutions. In all cases, iodine and water excess are removed from the main stream and recycled to Bunsen reactor.
9
The HI/I2/H2O ternary mixture is an exceedingly complex system for the presence of different
equilibrium of phases. The H2O/I2 liquid-liquid subsystem has an highly immiscible behavior with a
strong tendency of the iodine to crystallize (iodine melting point is 113.6°C). The HI/H2O
subsystem, composed by strong electrolytes, shows an azeotrope at 57% in weight of HI. The decomposition reaction of HI is limited by the chemical equilibrium, and the conversion rate, at 500°C, reaches only the 22.4%. As reported, in order to obtain a proper separation of phases, an excess of iodine and water is required for the Bunsen section, and, consequently, a large amount of both these species, namely, 8 moles of I2 and 14 moles of H2O, is present in the HIx phase for each
mole of H2 produced, leading to a significant value of energy demand. The electrodialysis process
here described aims to reduce this thermal burden.
In this work an experimental campaign was carried out to obtain sensible data about this process, in order to show advantages and limitations of this technique.
2 - Experimental 2.1 - Chemicals
The solutions used in the experimental tests were prepared using HI, 57% in weight, distilled and stabilized (Acros Organics) and iodine (Clean Consult International).
2.2 - Experimental set-up for EED
The experimental campaign was carried out using an electrodyalisis cell mod. ED-64-002 (PCA Polymerchemie Altmeier Gmbh – Germany), whose original electrodes were replaced with home-made rhodium coated titanium electrodes.
Titanium plates (Titania, Italy) with an area of 112 cm2,were used to produce twoelectrodes similar to the ED-64-002 original ones. The electrodes were cleaned by an ultrasonic bath in ethyl alcohol. After 3 minutes of pickling in a HF (Carlo Erba)/HNO3 (Carlo Erba) solution, in a volumetric ratio
of 1:3, and diluted in deionised water until to 100 mL, each titanium electrode was oxidized using a two-electrode cell (the counter-electrode was a platinum gauge), containing a H2SO4 1 M solution
10
generated by a potentiostat/galvanostat (Ecochemie). The oxidation current was applied to the titanium electrode until a voltage of 100 V was reached and an uniform and dense grey TiO2 layer
was deposited onto the surface. After this anodization treatment, the electrodes were washed in water and carefully dried.
The rhodium coating took place in the same above configuration, by multiple pulse galvanostatic electrodeposition. The electrodeposition bath was Rhodium Sulphate (Rh 5 g L-1) in H2SO4 1 M at
25°C. A pulse current density of -2 mA cm–2 was applied for 0.25 sec followed by a pause of 0.5 sec. Three thousands pulse were applied in order to obtain a total charge equivalent to a rhodium loading of 0.53 mg cm-2The final Ti/TiO2/Rh electrodes' superficial area was 7.5 x 7.5 cm2.
Nafion 117 (Du Pont's) cation-exchange membrane with an active surface of 64 cm2 (8 cm x 8 cm) was used as electrolyte.
Electrodialysis measurements were performed using an Autolab Pgstat30 potentiostat (Ecochemie) interfaced with a current booster BSTR20A, necessary to work with electric currents up to 20 A, and employing a GPES 4.7 control software. Impedance measurements were performed at open circuit voltage (OCV) with an AC signal of 10 mV between 10000-1 Hz using the Autolab Frequency Response Analyser module.
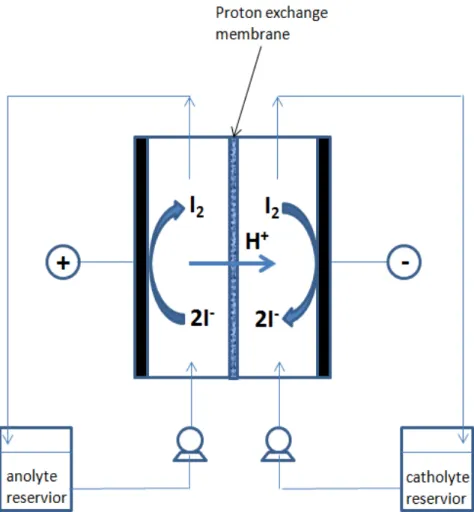
The mixtures subjected to electrodialysis, were contained into two reservoirs, each having a volume of 300 mL, packed in a warming jacket (Fig. 2). Mixture's circulation were assured by two Watson Marlow peristaltic pumps; circulation rate was controlled by changing the pump spinning rate (50 mL min-1).
11
Fig. 2 - Schematic diagram of the electrodialysis cell. 2.3 - Concentration by EED
Experimental tests were performed at constant voltage. At the beginning of each test, 300 mL of Hydrioidic mixture were loaded in each reservoir..
Two kinds of iodidric mixture were employed; a former-one called “simil-Bunsen mixture” (HI 3M, I2 3.2 M), which composition is very similar to the one obtained from a real the Bunsen reactor, and
a latter-one called “mixture II” (HI ≈4.5 M, I2 0.8 M) containing only one fraction of the HI and
iodine present in the simil-Bunsen mixture.
Mixture II was used to overcome problems of bad circulation due to the presence of crystallized I2.
Each test lasted 4 hours and, each hour, samples of both anolyte and catholyte were taken for analysis.
12
solutions of thiosulfate for iodine determination and sodium hydroxide for HI quantification.
Regarding the measurement error, given the high precision provided by the automatic titration technique, the significant detected imprecision can be due to sampling and sample handling problems, especially considering the iodine's volatility. The relative error on the molar values can be roughly estimated around 3% for HI and not less than 12% for iodine determination.
2.4 - Transport properties of the membrane and energy consumption
The membrane characteristics were studied by the following two parameters: the apparent transport number of proton (t+) and the apparent coefficient of electro-osmosis (β).
The apparent transport number shows the ion amount passing through the membrane due to a given driving force.
The electro-osmosis coefficient indicates the water quantity passing through the membrane by means of the solvated ions.
The changes in the measured amounts of respective species, HI and H2O, were used to calculate the
apparent transport number of proton (t+) and the apparent electro-osmosis coefficient (β), in the
catholyte part. The transport properties were calculated by the following equations, derived from mass balance calculations in the catholyte section, taking into account the changes due to electrode reaction:
(4) (5)
Here ΔM, t, i and F indicates, respectively: the molar variation of HI and H2O amounts in the
catholyte section, the EED process time (s, corresponding to a total of 4 hours in the reported data), the electric current (in Ampere) and the Faraday constant.
Since to obtain the values of t+ and ß, the weight changes, due to the EED process, of anolyte and
13
collecting the anolyte and catholyte solutions, the obtained t+ and ß are average values
representative of the all period of the EED experiment considered.
The electric power consumption of the EED cell depends on the potential drop across the cell (V), the current applied (i) and the current efficiency or the apparent transport number of proton in the membrane (t+) as shown in Eqn. (6):
+ =
t iV
Eeed (6)
The molarity variations of HI in the catholyte section and I2 in the anolyte one were reported, in
order to obtain trends easy to be compared.
3 - Results and discussion 3.1- Concentration by EED
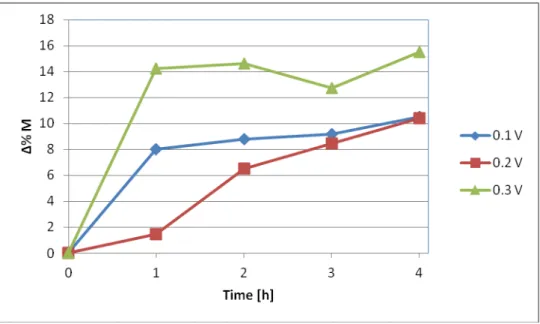
Electrodialysis tests were performed varying the electric voltage applied to cell and mixtures temperature. In the following figures are reported the results obtained with the “mixture II” composition, that is, with relatively low iodine concentration. In Fig. 3 is shown the trend of HI percentage increase respect to the initial molarity versus time, applying three different voltage values at 25 °C, in Fig. 4 temperature was varied, maintain the voltage at 0.1 V.
Fig. 3 – Cathode HI percentage increase respect to the initial molarity vs time for different cell voltage (T=25 °C).
14
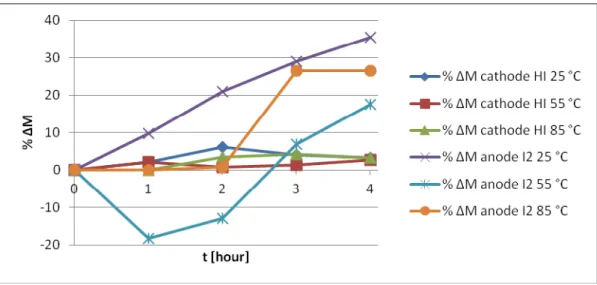
Fig. 4 – Cathode HI and anode I2 molarity percentage variations vs time for different
electrodialysis cell temperature and 0.1 V.
From fig. 3, the expected proportionality between the applied driving force and the separation rate measured by the change in HI molarity, become significant at 0.3 V. The apparent different behaviour in the first two hours of the tests at 0.1 and 0.2 V, is presumably due to the experimental error. A clearer way to appreciate the voltage effect on the separation process is to consider the apparent proton transport number, as shown below.
Concerning temperature, no detectable effects, considering the experimental error, were present for HI cathodic and iodine anodic concentrations (fig. 4).
The obtained experimental data were used to calculate the apparent transport number of proton (t+)
15
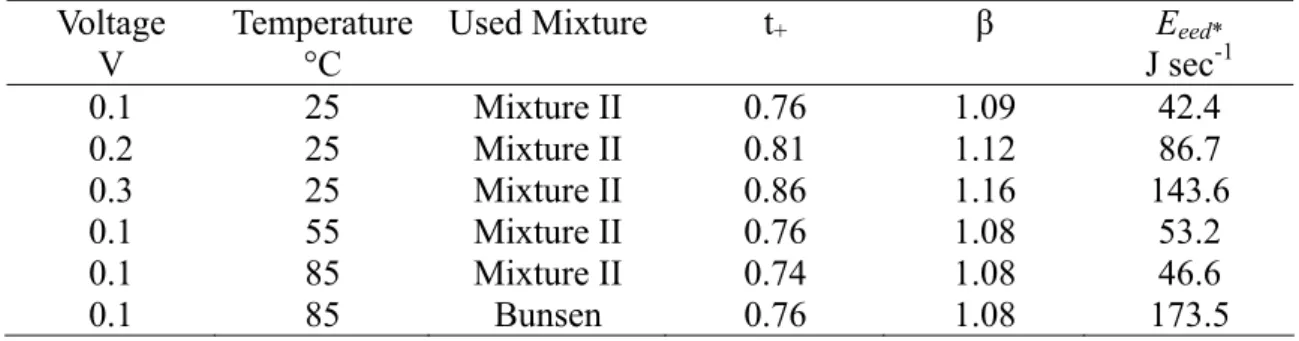
Table 1 – Transport number (t+), electrosmosis coefficient (β) and specific energy demand
(Eeed) as a function of different electrodyalisis parameter.
Voltage V
Temperature °C
Used Mixture t+ β Eeed*
J sec-1 0.1 25 Mixture II 0.76 1.09 42.4 0.2 25 Mixture II 0.81 1.12 86.7 0.3 25 Mixture II 0.86 1.16 143.6 0.1 55 Mixture II 0.76 1.08 53.2 0.1 85 Mixture II 0.74 1.08 46.6 0.1 85 Bunsen 0.76 1.08 173.5 *= normalized with t+
The water contained in each sample was obtained from the difference among the sample's overall weight and the HI and I2 quantities obtained by means of titration.
For this reason, the calculated water amounts can be affected from a substantial experimental error; anyway, considering that the β parameter can be independently calculated both using cathodic and anodic concentrations, it was possible to cross check the two obtained values, and accept only the electro-osmosis coefficients resulting equal to each other.
The apparent transport number increased with the applied voltage from 0.76 to 0.81 and 0.86 (Table 1), it also virtually didn't change with temperature, remaining constant at a value around 0.75.
Regarding the electro-osmosis coefficient at 25°C (Table 1), β increases from 1.09 mol F-1 (at 0.1 V ) to 1.16 mol /F-1 (at 0.3 V ). At 0.1 V and in the temperature range 25–85°C, it is possible to observe that the increasing of temperature influenced marginally β, which maintained a value of about 1.08 mol F-1; the impact over the system performance was almost null and, as already reported, the trend of concentration was steady at every temperature level for both HI and the iodine.
3.2 - Durability of the membrane and of the electrodes in the HIx solution
The impedance of the cell was measured before and after each test in order to verify the corrosion of electrodes and/or the membrane degradation through the iodides mixture. The ohmic resistance
16
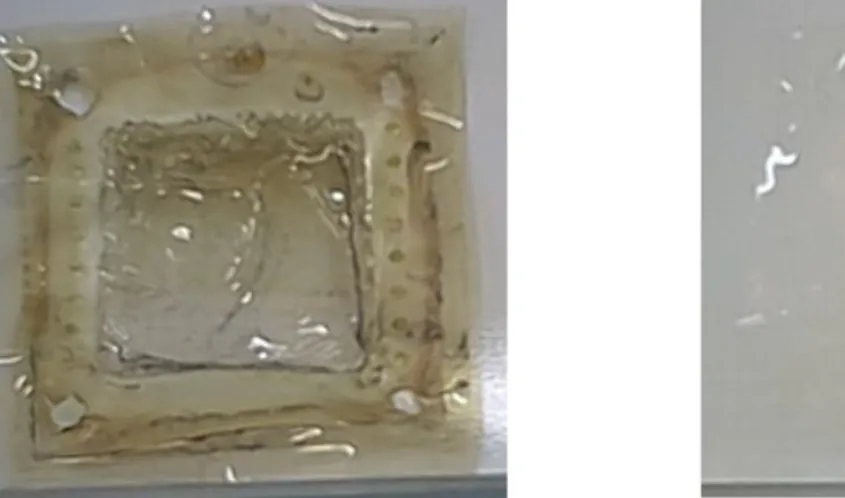
of the cell was constant (4.5 ohm cm2), so evidencing the stability of the components. In addition, the examination of the titanium-rhodium electrodes and of the membrane (Fig. 5) after the tests campaign showed the resilient behavior of both elements against the iodide mixture.
Fig 5 - The Nafion membrane just removed from the cell (left), the membrane after a washing in H2O2 2 wt% solution (right).
3.3 - Comparison between Bunsen-like mixture and mixture II
As previously said, the Bunsen-like mixture at low temperature, showed some circulation problems during the tests. Consequently, an experiment was carried out with the Bunsen mixture at 85°C and 0.1 V (Fig. 6).
Fig. 6 – Cathode HI and anode I2 percentage increase respect to the initial molarity vs time for
17
Because of the sampling difficulty of a solution presenting high I2 contents at 85 °C, and
considering a measurement error of 3%, the increase of cathodic HI can be only qualitatively verified. In any case, it appears that, after 4 hours time, about the same final HI concentration increase is reached both with the Bunsen and the II mixture.
Comparing in table 1 the results with the ones for the “mixture II” composition, it can be noticed that, considering the experimental error, the separation parameters are practically the same respect to the ones obtained with the “mixture II”. The apparent transport number of proton was almost constant varying from the 0.74 (Bunsen-like test) to the 0.76 value (mixture II test).
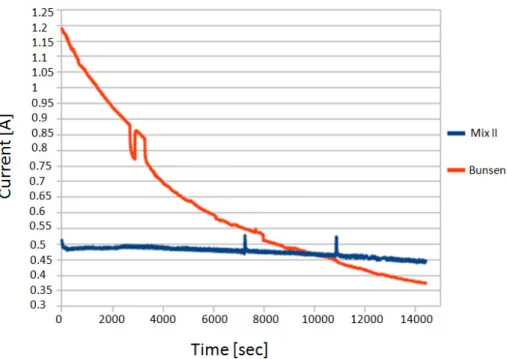
As expected, a real difference between the two tests is represented by the flow of the electric current in the cell (Fig. 7). The tests with mixture II, furnished a trend of the electric current constant independently from operative conditions. In contrast, the tests with the Bunsen-like mixture, showed a sharp decrease of the electric current in the time.
18 3.4 - Energy consumption
An energy consumption estimation (Eeed) has been calculated starting from applied voltage,
electricity and concentration data taken from the various tests (Table 1). The electric current was integrated to calculate the charge developed in the cell. To be able to perform effective comparisons, the energy consumption value has been related with the variation of HI in each test. Results, showed that the energy consumption increased with the growth of applied voltage, although we observed a simultaneous increase of the separation rate.
Working at higher temperatures, it wasn’t detected any increasing in the separation rate. So, temperature cannot be considered as a parameters to optimize EED efficiency. Tests performed with the Bunsen-like mixture showed a bigger energy consumption than the correspondent ones with mixture II.
Considering that, within the same time interval, the HI increase at the cathode is basically the same both in the Bunsen and the II mixture, the higher energy consumption could be due to problems in the membrane separation capacity in presence of high iodine concentration that cause partial reactions at the electrodes.
4 - Conclusions
1 - The electric current, in tests performed with mixture II, decreases linearly with the time; the electric current variation is enhanced in tests with Bunsen-like mixture.
2 - The apparent transport number of proton shows a linear dependence with the electrodes applied voltage, regardless of the used mixture.
3 - The mixture temperature has little effects on the separation degree. Only the apparent electro-osmosis coefficient varies slightly, this is probably due to the increased thermal agitation of the molecules in the mixture.
4 - The titanium-rhodium electrodes presented a good chemical resistence during tests. The electrodes' surface and the membrane, were shielded very well against the corrosive action of the
19
solution and, the ohmic resistance of the cell was constant during all of experimental campaign. 5 - Energy consumption increases with increasing voltage applied to the cell, as well as separation rate. Energy consumption at higher temperatures, and at constant voltage doesn’t increase significantly, showing once more how temperature is not a sensitive parameter for the separation. The tests carried out with the Bunsen-like mixture show a bigger energy consumption with respect the correspondent tests performed with mixture II.
6 – Experimental results showed that it is possible to concentrate HI at the cathode also starting from a Bunsen like mixture; as a consequence, it is in principle possible to directly concentrate and separate the hydriodic acid from iodine using the EED system downstream of the lower phase of the sulphur-iodine Bunsen section, still having a high energy consumption. Alternatively, it can be possible to use the EED technique to concentrate at low voltages (and with a relatively low energy consumption) a solution where most of the iodine excess has been previously removed by a pre-distillation process.
7 - These tests are been realized on a batch configuration but the results can help to implement the electro-dialysis in a continuous operation.
20 References
[1] JH Norman, GE Besenbruch, DR O’Keefe, “Thermochemical water-splitting for hydrogen production”, GRI-80/0105, 1981.
[2] M. Sakurai, H. Nakajima, K. Onuki, S. Shimizu, “Investigation of 2 liquid phase separation characteristics on the iodine–sulfur thermochemical hydrogen production process”, Int J Hydrogen Energy, vol. 25, pp. 605–611, 2000.
[3] D. O’Keefe, C. Allen, G. Besenbruch, L. Brown, J. Norman, R. Sharp et al., “Preliminary results from bench-scale testing of a sulfur–iodine thermochemical water-splitting cycle”, Int J Hydrogen Energy, vol. 7, pp. 381–392, 1982.
[4] H. Engels, K.F. Knoche, M. Roth, “Direct dissociation of hydrogen iodide an alternative to the general atomic proposal”, Int J Hydrogen Energy, vol. 12, pp. 675–678, 1987.
[5] M. Roth, K.F. Knoche, “Thermochemical water-splitting through direct HI-decomposition from H2O–HI–I2 solution”, Int J Hydrogen Energy, vol. 14, pp. 545–549, 1989.
[6] LC Brown, GE Besenbruch, RD Lentsch, KR Schultz, JF Funk, PS Pickard et al., “High efficiency generation of hydrogen fuels using nuclear power”, General Atomics Project 30047, June 2003.
[7] K. Onuki, G.J. Hwang, E. Arifal, S. Shimizu, “Electro-electrodialysis of hydroidic acid in the presence of iodine at elevated temperature”, J Membr Sci., vol. 192, pp. 193–199, 2001.
[8] G.J. Hwang, K. Onuki, M. Nomura, S. Kasahara, J.W. Kim, “Improvement of the thermochemical water-splitting IS (iodine–sulfur) process by electro-electrodialysis”, J Membr Sci. vol. 220, pp. 129–136, 2003.
[9] S. Kasahara, S. Kubo, K. Onuki, M. Nomura, “Thermal efficiency evaluation of HI synthesis/concentration procedures in the thermochemical water splitting IS process”, Int J Hydrogen Energy, vol. 29, pp. 579–587, 2004.
[10] H. Guo, S. Kasahara, N. Tanaka, K. Onuki, ”Energy requirement of HI separation from HI–I2–
H2O mixture using electro-electrodialysis and distillation”, Int J Hydrogen Energy, vol. 37, pp.
13971–13982, 2012.
[11] S. Chen, R. Wang, P. Zhang, L. Wang, J. Xu, Y. Ke, “HIx concentration by
electro-electrodialysis using stacked cells for thermochemical water-splitting IS process”, Int J Hydrogen Energy, vol. 38, pp. 3146-3153, 2013.
[12] K. Kang, C. Kim, W. Cho, S. Jeong, C. Park, K. Bae, “Demonstration of the HI decomposition section embedded with electrodialysis stack in the sulfur–iodine thermochemical cycle for hydrogen production”, Nuclear Engineering and Design, vol. 256, pp. 67-74, 2013.
21
[13] C.J. Orme, M.G. Jones, F.F. Stewart, “Pervaporation of water from aqueous HI using Nafion-117 membranes for the sulfur–iodine thermochemical water splitting process”, J Membr Sci, vol. 252, pp. 245–252, 2005.
[14] G. Caputo, C. Felici, P. Tarquini, A. Giaconia, S. Sau, “Membrane distillation of HI/H2O and H2SO4/H2O mixtures for the sulfur–iodine thermochemical process”, Int J Hydrogen
Edito dall’ENEA
Servizio Promozione e Comunicazione Lungotevere Thaon di Revel, 76 - 00196 Roma
www.enea.it
Pervenuto il 4.4.2016
Stampato presso il Laboratorio Tecnografico ENEA - C.R. Frascati Finito di stampare nel mese di aprile 2016
![Fig. 1- Scheme of the General Atomics sulfur–iodine thermochemical water-splitting cycle [1]](https://thumb-eu.123doks.com/thumbv2/123dokorg/5618673.68467/8.892.279.613.416.778/scheme-general-atomics-sulfur-iodine-thermochemical-water-splitting.webp)