ALMA MATER STUDIORUM - UNIVERSITÀ DI BOLOGNA
SCHOOL OF ENGINEERING AND ARCHITECTURE
DEPARTMENT OF INFORMATION ENGINEERING
AND COMPUTER SCIENCE
THESIS IN
DATA MINING
Big Data for
the Real-Time Analysis of the Cherenkov
Telescope Array Observatory
Author:
Supervisors:
Giancarlo ZOLLINO
Prof. Claudio SARTORI
Eng. Andrea BULGARELLI
March 14, 2019
Session III
Abstract [ITA]
Lo scopo di questo lavoro di tesi è quello di progettare e sviluppare un framework che supporti l'analisi in tempo reale nel contesto del Cherenkov Telescope Array (CTA). CTA è un consorzio internazionale che comprende 1420 membri provenienti da oltre 200 istituti da 31 Nazioni. CTA punta ad essere il più grande e più sensibile osservatorio ground-based di raggi gamma di prossima generazione in grado di gestire un'elevata quantità di dati e un'alta velocità di trasmissione, compresa tra i 0,5 e i 10 GB/s, con una rate di acquisizione nominale di 6 kHz. A tale riguardo, è stata sviluppata la RTAlib in grado di fornire un'API semplice e ad alte prestazioni per archiviare o fare caching dei dati generati durante la fase di ricostruzione e analisi. Per far fronte alle elevate velocità di trasmissione di CTA, la RTAlib sfrutta il multiprocesso, il multi-threading, le transazioni ed un accesso trasparente a MySQL o Redis per far fronte a diversi casi d’uso. Tutte queste funzionalità sono state testate ottenendo risultati entro i requisiti richiesti. In particolare, con la libreria sviluppata si riesce a fare caching di dati con Redis, con processi scrittori e lettori che lavorano in parallelo, ad una rate di 8 kHz in scrittura e 30 kHz in lettura.
Il team in cui ho lavorato ha basato sui principi dell'approccio Scrum e DevOps il proprio processo di sviluppo del software, in particolare dalle unit test fino alla continuous integration, utilizzando tools ad accesso pubblico su GitHub oppure tramite Jenkins. Grazie a questo approccio si è puntato ad avere una elevata qualità del codice fin dall’inizio del progetto, e questo è risultato uno degli approcci più importanti per ottenere i risultati raggiunti.
Abstract [ENG]
The aim of this work is to design and develop a framework that supports the Real-Time Analysis of the Cherenkov Telescope Array (CTA). CTA is an international consortium that includes 1420 members from more than 200 institutes in 31 countries. CTA aims to be the biggest next-generation and most sensitive ground-based gamma-ray observatory capable to deal a high amount of data and high data rate, between 0,5 and 10 GB/s, with a nominal acquisition rate of 6 kHz. In this regard, the RTAlib has been developed to provide a simple but powerful high-performance API to store or to caching the data that is generated during the reconstruction and analysis phase. In order to cope with the high data rates of the CTA reconstruction and analysis chain, the RTAlib exploits multiprocess, multithreading, database transactions and a transparent access to MySQL or Redis. All these functionalities have been tested providing results that satisfy the project requirements. In particular, with the developed library it is possible to make data caching with Redis, with writers and readers processes working in parallel achieving a writing rate of 8 kHz and a reading rate of 30 kHz.
The team in which I worked for this project, based its strategy and software development process on the principles of the Scrum and DevOps, especially from unit tests to continuous integration, using public access tools interacting with GitHub or through Jenkins.
Thanks to this approach, the aim was to have a high quality of the code from the beginning of the project, and this was one of the most important approaches to obtain the results achieved.
Contents
1. Introduction 9 1.1. Technological introduction 9 1.2. Science introduction 13 2. Technology 19 2.1. Languages 19 2.1.1. C and C++ 19 2.1.2. Python 20 2.1.3. SQL 20 2.2. Database 21 2.2.1. MySQL 22 2.2.2. Redis 25 2.3. Profiling 26 2.3.1. Valgrind 263. RTA System Software Engineering 27
3.1. Agile&Scrum 27 3.2. GitHub 30 3.3. Waffle 31 3.4. Containers 33 3.4.1. Docker 34 3.4.2. Singularity 35
3.5. Continuous Testing and Integration 36
3.5.1. Unit testing 37
3.5.2. Code quality metrics 38
3.5.3. Issue tracking system 38
3.5.4. Testing metrics 38
3.6. From Continuous Integration to Continuous Delivery 39
3.6.1. Infrastructure as code 39
3.7. RTA software development implementation 40
3.7.1. Working environment 40
3.7.2. Development workflow 41
3.7.3. RTA Continuous Integration 43
3.7.3.1. Remote CI with CircleCI 43
3.7.3.2. Local CI with Jenkins 46
3.7.3.2.1. The pipeline 46
4. RTAlib 49
4.1. CTA On-Site Analysis 49
4.2. Real-Time Analysis 50
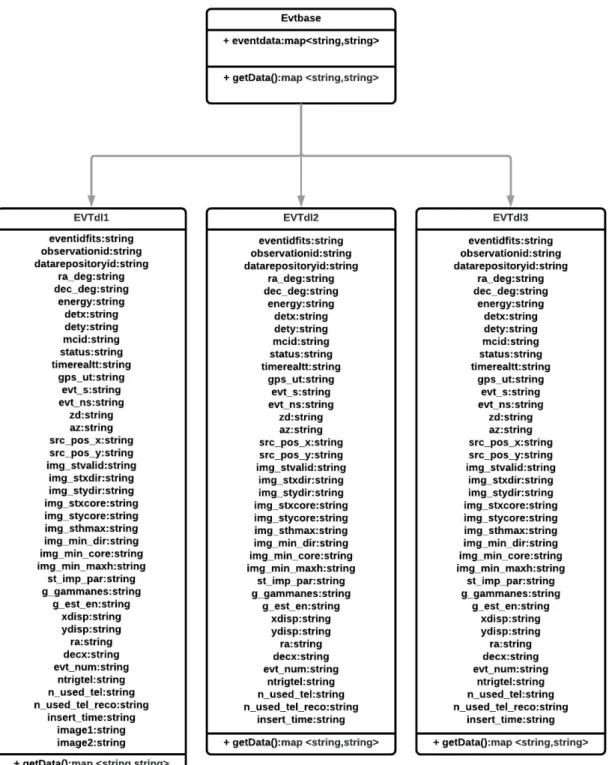
4.3. Data Flow And Data Definition 51
4.4. RTAlib 53
4.4.1. Software Requirements 53
4.4.2. Implementation 54
4.4.3. Physical and logical data models 55
4.4.4. The database connectors 57
4.4.5. The core class 57
4.4.5.1. MySQL connector class 59
4.4.5.2. Redis connector class 59
4.4.6. Redis publisher class 59
4.4.7. Configurations 60 4.4.7.1. Streaming mode 61 4.4.7.2. Batch mode 61 4.4.7.3. Single thread 62 4.4.7.4. Multithreading 62 4.4.8. Unit testing 62 4.4.9. DTR 62 5. Performance 64 5.1. Test Environments 64
5.2. Task and criteria 65
5.3. Features to be tested 66
5.4. Implementation of the performance tests suite 67
5.4.1. WriteOnly Test 67
5.4.2. Write&Read Test 69
5.5. Scalability 71
5.6. Performance tests results 72
5.6.1. DL2 performances WriteOnly one-shot with one process 72
5.6.1.1. MySQL Memory 72
5.6.1.2. Redis 73
5.6.1.2.1. Batch size: 1 73
5.6.1.2.2. Batch size: 100 73
5.6.1.2.3. Batch size: 1000 74
5.6.1.3. MySQL MyISAM Permanent Storage 74
5.6.1.4.1. Batch size: 1 74
5.6.1.4.2. Batch size: 100 75
5.6.1.4.3. Batch size: 1000 75
5.6.2. DL2 performances WriteOnly long-run with one process 78 5.6.3. DL2 performance WriteOnly with multiprocess and multithreading test 79
5.6.4. DL2 performance Write&Read tests 80
5.6.5. DL1 Performances 83 6. Conclusion 85 6.1. Brief 85 6.2. Results 86 6.3. Future development 88 7. Appendix 90
7.1. Jenkins installation commands 90
7.2. Setting up a new project in Jenkins 90
7.3. Jenkinsfile and the build process 91
7.3.1. The Singularity recipe 92
7.4. Commands to clone and to compile the code 94
7.5. Commands to run the tests 97
7.5.1. Unit test 98
7.5.2. Performance test 98
7.5.2.1. WriteOnly 98
7.5.2.2. Write&Read 99
1. Introduction
1.1. Technological introduction
In the last ten years three topics took our attention: Artificial Intelligence, IoT or Internet of Things, and Big Data. These are topics closely linked to each other. We could identify in these three keywords the production chain of a new consumer product: Information.
Let's start with the word Big Data, which in its extreme simplification indicates the massive amount of data available on the Internet today. It is sufficient to take a look at the report issued by CISCO in November 2018 to realise how much the data circulating on the internet have experienced massive growth in the last twenty years. In fact, in 1992 global Internet networks carried approximately 100 GB of traffic per day. Ten years later, in 2002, global Internet traffic increased to 100 Gigabytes per second (GB/second). In 2017, global Internet traffic reached more than 45,000 GB/second. Cisco Visual Networking Index expected that annual global IP traffic would reach 4.8 ZettaByte ( 10^12 GB ) per year by 2022.[1]
This dizzying increase in the number of devices connected to the Internet is partially due to a greater possibility of Internet access worldwide, partially because more and more objects will connect to the Internet.
We talk in this context of the Internet of Things, which consist of various devices and sensors that have an Internet interface able to connect to the network and send data. Therefore there is always a higher number of devices that generate an enormous amount of data requiring ad hoc techniques that allow them to be analysed and managed.
One of these techniques is the artificial intelligence, a discipline able to develop algorithms to acquire experience and knowledge that can consolidate and select data automatically, within this vast amount of data.
Big Data expression has now become a value proposition within every productive sector. As for Italy, according to the Big Data Analytics & Business Intelligence Observatory of the Management School of the Polytechnic of Milan, the turnover reached a total value of 1.393 billion euros, up 26% compared to 2017. Again according to Milan Polytechnic University
Report, in 2018 there has been a significant increase in large organisations that have adopted a mature Data Science governance model, from 17% to 31%, inserting Data Scientists, Data Engineers and Data Analysts to lead the company towards optimal Big Data and Real-Time analysis management.[2]
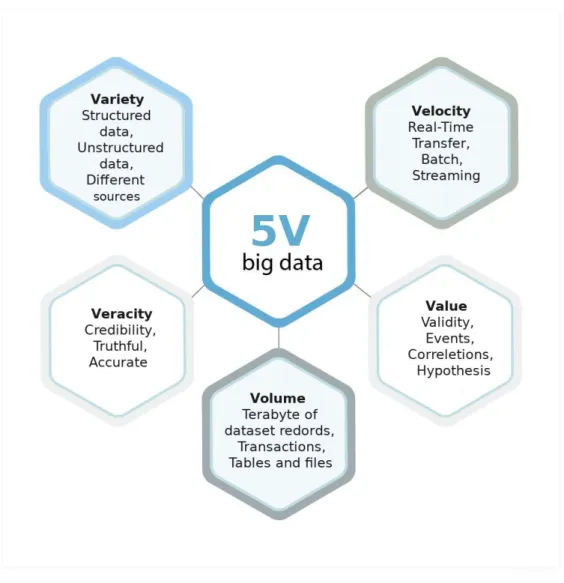
However, Big Data is not just a question of volume. The first definition of Big Data was provided in February 2001 in an article written by Douglas Laney, of Meta Group, [3] which highlighted the need to manage the growing data produced by e-commerce platforms following a three-dimensional approach: Volume, Velocity and Variety. [4] Over time the Big Data definition has changed to add other features until 5 V or even 8V describe it.
Below are reported the 5 V considered most qualifying:
1. Volume: data quantity transmitted on Internet is continuously growing. Some examples are uninterrupted social networks data flow, the ever-increasing purchases number on online market, in addition to traditional data released and managed today in a digital way.
2. Velocity: this is a property required to Big Data analysis algorithms that want to extract information within data as quickly as possible.
3. Variety: Today various kinds of data are available on the Internet, in addition to the textual and structured data of traditional websites. Network is mainly flooded with various non-structured contents typical of social networks like Facebook, which boasts over 4,5 billion posts published every day.
4. Veracity: given the variability of the sources and given the importance that these data is playing, is essential that these data are cleaned up to be considered truthful and accurate.
5. Value: it is undoubtedly the characteristic that is attracting more investment in this field. The value of Big Data lies in the information that allows large companies to react quickly to changes in the market if not even anticipate them and to the world of research to open new horizons.
Figure 1.1: Big Data 5V
Big Data is used in very numerous fields, from economic, elaborating accurate and precise market analysis for business strategies, to the medical for genomic medicine to scientific field more generally.[5]
In the scientific field Big Data finds a propulsive drive, to create a virtuous circle that on the one side pushes to the existing technologies optimisation and on the other one pushes towards what Jim Gray, father of the Google Earth project, called "The Four Paradigms of Science". Inside Four Paradigms, data represent the starter point from which algorithms mine enormous databases looking for relationships and correlations. It requires a new set of skills that help scientists to discover new laws.[6]
In most fields the Value of the information is strictly connected with the concept of Velocity, i.e. the information has value if is processed immediately during the data acquisition. For this reason, Real-Time Analysis is now becoming a reality more widespread. All big companies are equipping themselves with systems for this type of analysis; some directly produce the programs they will use (IBM, Microsoft and CISCO to mention some of the most important), others use open source platforms that are free and available to everyone (e.g. Spark, Storm and Flink).
Real-time data is often not kept or stored but is passed along to the end user as quickly as it gathered. It is important to note that real-time data does not mean that the data gets to the end user instantly. There may be any number of bottlenecks related to the data collection infrastructure, the bandwidth between various parties, or for someone else reason. Real-time data does not promise data within a certain number of microseconds. It just means that the data is not designed to be kept back from its eventual use after it collected. In general, this type of data is described as immediately available data: just generated or just collected.[7] The analysis in real time is not entirely new, think about the data analysis for weather forecasting or to data analysis for the financial trading, fraud detection at points of sale, traffic or infrastructure monitoring systems. In recent years, also the research world has identified the context of real-time analysis as one of the challenges that has to be faced in the following years.[8]
Some of the aspects identified in this first part of the introduction concerning Big Data and Real-Time analysis represent some of the crucial challenges within my thesis work in collaboration with the Cherenkov Telescope Array Observatory ( CTAO ).
1.2. Science introduction
This thesis was carried out in collaboration with INAF-OAS researchers and in collaboration with the CTA Consortium, an international partnership that is dealing with the design and construction of the CTAO.
The Astrophysics and Space Science Observatory (OAS) of Bologna is part of the Italian National Institute for Astrophysics (INAF) , and was born on 1 January 2018 from the merger of two INAF institutes in Bologna: Bologna Astronomical Observatory and the Institute of Space Astrophysics and Cosmic Physics.
The National Institute of Astrophysics (INAF) is the leading Italian Research Institute for the study of the Universe. It promotes, carries out and coordinates, also within the framework of European Union programs and international organisations, research activities in the fields of astronomy and astrophysics, both in collaboration with universities and international public and private institutes. It designs and develops innovative technologies and cutting-edge instrumentation for the study and exploration of the Cosmos. Promotes scientific and Astronomy culture spread thanks to projects of teaching in the School and in the Society. The CTA Consortium includes 1420 members from more than 200 institutes in 31 countries. Italy actively participates in the CTA through INAF, INFN ( Istituto Nazionale di Fisica Nucleare ) and some universities.
Since 2016 Bologna hosts the CTA headquarters.
CTA will address a wide range of significant questions in and beyond astrophysics, which can be grouped into three broad themes:
1. Understanding the Origin and Role of Relativistic Cosmic Particles; 2. Probing Extreme Environments (environments of extreme energy density);
3. Exploring Frontiers in Physics ( dark matter, quantum gravitational effect, axion-like particles).
CTA aims to answer to these questions using Imaging Atmospheric Cherenkov Telescopes (IACTs)[9]. When gamma rays reach the earth’s atmosphere, they interact with it, producing
cascades of subatomic particles. These cascades are also known as air or particle showers. Nothing can travel faster than the speed of light in a vacuum, but light travels 0.03 % slower in the air. Thus, these ultra-high energy particles can move faster than light in the sky, creating a blue flash of “Cherenkov light” (discovered by Russian physicist Pavel Cherenkov in 1934). These blue flashes are observed with IACTs.
Figure 1.2: IACT, Imaging Atmospheric Cherenkov Technique
The CTA observatory will consist of more than 100 IACT telescopes located at two sites. In the Northern hemisphere, the CTA will be hosted in La Palma in the ‘Roque de Los Muchachos Observatory’, while in the southern hemisphere the CTA will be hosted in Paranal, Chile.
Figure 1.3: CTA Offices and locations
Three classes of telescope types are required to cover the full CTA energy range (20 GeV to 300 TeV):
1. Small-Size Telescope (SST): telescopes with an energetic range from few TeV to 330 TeV, there will be installed 70 elements of this telescopes;
2. Medium-Sized Telescopes (MST): telescopes with an energetic range from 100 GeV to 10 TeV, there will be installed 40 elements of this telescopes;
3. Large-Sized Telescopes (LST): telescopes with an energetic range from 20 GeV to 200 GeV, there will be installed 8 elements of this telescopes.
CTA will have also a Real-Time Analysis system, that must be capable of generating science alert during observations or provide real-time feedbacks to external triggered ToO events 1 with a latency of 30 s starting from the last acquired event that contributes to the alert. The Real-Time Analysis differential sensitivity should be as close as possible to the one of the final offline analysis pipeline but not worse than a factor of 3: despite those caveats, an unprecedented sensitivity for short term exposures is achieved. The search for transient phenomena must be performed on multiple timescales (i.e. using different integration time
windows) from seconds to hours, both within an a-priori defined source region, and elsewhere in the FoV . A Real-Time Analysis pipeline specific to each sub-array configuration is2 foreseen to run in parallel. The availability of the Real-Time analysis during observations must be greater than 98%. The Real-Time Analysis enables CTA to provide real-time feedback to external received alerts, and to maximize the science return on time-variable and transient phenomena by issuing alerts of unexpected events from astrophysical sources.[10]
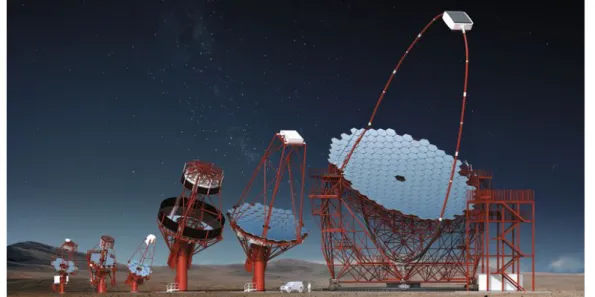
Figure 1.4: From Left: Three different SST prototype designs, the two MST prototype designs and the LST prototype design.
To understand how the gamma-ray will be acquired by CTA and analysed by the Real-Time Analysis system, it’s important to know the electromagnetic spectrum structure to understand what we are talking about. Light is made up of waves of alternating electric and magnetic fields that can be measured by frequency (number of waves that pass by a point in one second) or wavelength (the distance from the peak of one wave to the next). The larger the frequency, the smaller the wavelength. The spectrum ranges from the very lowest frequencies of radio waves and microwaves; to the mid-range frequencies found in infrared, optical (visible) and ultraviolet light; to the very highest frequencies of X-rays and gamma rays. The frequency range of gamma rays is so vast that it doesn’t even have a definite upper limit. The gamma rays CTA will detect are about 10 trillion times more energetic than visible light.[11]
Figure 1.5: The Electromagnetic Spectrum
Gamma-ray are produced by the most violent and energetic phenomena of the Universe. Between them, just to provide an example, we can cite the Gamma-Ray Bursts (GRB), the most high energy astrophysics phenomena observed so far. For decades, almost nothing was known about gamma-ray bursts: its origins and distribution, spatial and statistical, were unknown. The gamma-ray bursts themselves showed a great variety: they could last from a fraction of a second to several minutes, they present a great range of spectra, which did not resemble anything that was then known. Now the big picture is much more clear, 14 January 2019 it’s been observed the first Cherenkov light produced by a gamma-ray burst. GRB 190114C, this is the name of the observed event, it has been seen from MAGIC, the biggest gamma-ray telescope ( until CTA will start to work ), located in La Palma in the 'Roque de Los Muchachos Observatory’. This discovery opens new frontiers in the exploration of the gamma-ray sky, and makes the Real-time Analysis systems even more important, because we can follow the evolution of transient phenomena in real time only using these systems. This thesis work, as better explained in Chapter 4, is placed in the “On Site” area of CTA and
2. Technology
In this chapter languages and tools used during software development are introduced.
2.1. Languages
The central core of the library developed during this project is written in C and C++ language. It also has been used a Python version of the same library. To manage structured data the SQL language has been used.
2.1.1. C and C++
C is a compiled general-purpose high-level programming language. It was developed in 1972 in Bell laboratories by Dennis M. Ritchie to develop UNIX operating system. In 1978 Brian Kernighan and Dennis Ritchie published a text that has become a legend: "The C Programming Language". After the K & R version of the C language there followed a large number of variations and dialects able to program in C or pseudo C any microprocessor system. In 1988 become a standardised language by ANSI.
Despite C is a high-level language, it provides methods and artefact to handle low-level activity and this makes C a very fast programming language.[12]
Today C is used to write the most popular Linux Operating System features, different RDBMS ( MySQL is written by C and C++) and different language interpreter too. ( see Python ).
C++ was born in 1979 as a merger of two languages, Simula67 and C used by Bjarne Stroustrup during his PhD thesis. Simula67 was the first simulation language that includes some object-oriented paradigm.
Shortly after that, it was born the first “C with Classes” version that in 1983 became “C++”. C++ as C language is a compiled general-purpose high-level language, and today it’s used to write very different kind of software, from operating system to computer vision software, from gaming to high-performance data management system. From 1983 to today different C++ versions have been released, each of them added some features to differentiate C++ from
C. The first step introduced inheritance, virtual function and function overloading and much more.
During this thesis C++11 standard has been used.
2.1.2. Python
Python is an interpreted general-purpose high-level language. Python has been designed by Guido Van Rossum in the late 1980s, its first release was in February 1991 and supported different programming paradigm, functional, imperative, procedural and object-oriented. It’s used for very different kind of purpose, from web development to simple gaming, from mathematical software to data management.
Python provides worst performance compared with C++ or other optimised compiled language, nevertheless thanks to its simple syntax it represents an excellent choice for creating a prototype. Furthermore, in Python it's possible to simply add compiled source code as C++ to use more performant code where necessary.
In this thesis work, it has been used 3.6.8 Python version.
2.1.3. SQL
SQL ( Structured Query Language ) is a standard language used to create, store and manage a relational database.
It has been created in IBM laboratory in 1974 by Donald Chamberlin, and become ANSI standard in 1986.
SQL is a declarative language that can be divided into four language subsection:
● Data Definition Language (DDL): to create, delete and modify the database object (e.g CREATE, DROP, ALTER etc);
● Data Manipulation Language (DML): to insert, modify and delete data into the database (INSERT, UPDATE, TRUNCATE etc);
● Data Control Language (DCL) to manage users and access control (GRANT, REVOKE etc);
● Query language (QL): to read tables and extract information from them (SELECT, FROM, WHERE etc);
2.2. Database
The term Database indicates a set of data collected in a digital form, that is frequently written, read and updated, organised so that it can be easily accessed. All operations executed on a database are managed from a " software system that enables users to define, create, maintain and control access to the database".[13]
This software is called DataBase Management System (DBMS).
From their inception, Databases, have evolved following different model design but today two are the main model widely used: relational and post-relational or NoSql.
The relational model uses mainly SQL language, a declarative language that improves programmer productivity and database performances.
This model was designed by Edgar F. Codd, an IBM programmer, in 1970. He wrote a paper, "A Relational Model of Data for Large Shared Data Banks", in which proposed a new way to organise and store data. In this model, data are grouped in tables. Each table represents a generic object as a collection of attributes, each of them is stored in a column. Each row within the tables, also called record or tuple, represent an object instance.
Every instance has identified by a primary key, an object attribute that can be used to refer to a particular row. Two or more tables can be linked one to each other using the respective primary key, forming the relationship.
The NoSql database becomes increasingly popular in the first 2000s when cloud computing and ever more performance web services appeared on the Internet.
NoSQL, which stands for "not only SQL," is an alternative to traditional relational databases when we are working with a very large amount of data managed on a distributed system. NoSql database differs from the relational database for any difference:
● Database structure; ● Scalability;
The relational database requires to design the internal structure, made up of tables and relationships. This initial conceptual work conditions the execution of every operation on the DB, from the insertion of data to the query. The rigid structure of the contents is absent in the NoSQL databases; the informations are stored in a completely different way and not necessarily structured objects, such as documents stored in collections.
Centralised nature of Relational Database make it vertical scalability, that means to increase its performance is necessary to increase the amount of RAM, SSD or CPU. In contrast, NoSQL databases are horizontally scalable, which means that they can handle more traffic by merely adding more servers to the database.[14]
The very significant difference between the two models regards Data consistency. In fact, in the relational database, DBMS require atomically this features every time data change, while in NoSQL model this property is left to application logic.
In this thesis work, it has been used both models to respond to the project requirements.
2.2.1. MySQL
MySQL is the world's most popular open source Relational DataBase Management System. Originally this RDBMS was developed from MySQL AB, a Swedish company, that then has been purchased from Oracle company.
MySQL provides besides Server-side software Client API for the main programming language. In this project work it has been used Version 14.14 Distribution 5.7.24 for the server-side software and C++ X DevAPI 8.0 for the software client-side.
MySQL offers different table engines, which have some distinctive features. Following we can see all tables engine:
● MyISAM
● InnoDB (transactional engine) ● Memory (before Heap)
● Merge
● NDB, o ClusterDB ( > 5.0) ● CSV ( > 5.1)
● Archive ( > 5.0)
● BLACKHOLE ( > 5.0)
During this project, I have used three engines: MyISAM, InnoDB and Memory.
● InnoDB: represent the default storage engine in MySQL 5.7. InnoDB is a transaction-safe (ACID compliant) storage engine for MySQL that has commit, rollback, and crash-recovery capabilities to protect user data. InnoDB row-level locking and Oracle-style consistent nonlocking reads increase multi-user concurrency and performance. InnoDB stores user data in clustered indexes to reduce I/O for common queries based on primary keys. To maintain data integrity, InnoDB also supports FOREIGN KEY referential-integrity constraints. ● MyISAM: These tables have a small footprint. Table-level locking limits the performance in read/write workloads, so it is often used in read-only or read-mostly workloads in Web and data warehousing configurations.
● Memory: Stores all data in RAM, for fast access in environments that require quick lookups of non-critical data. This engine was formerly known as the HEAP engine. Its use cases are decreasing; InnoDB with its buffer pool memory area provides a general-purpose and durable way to keep most or all data in memory, and NDBCLUSTER provides fast key-value lookups for huge distributed data sets.[15]
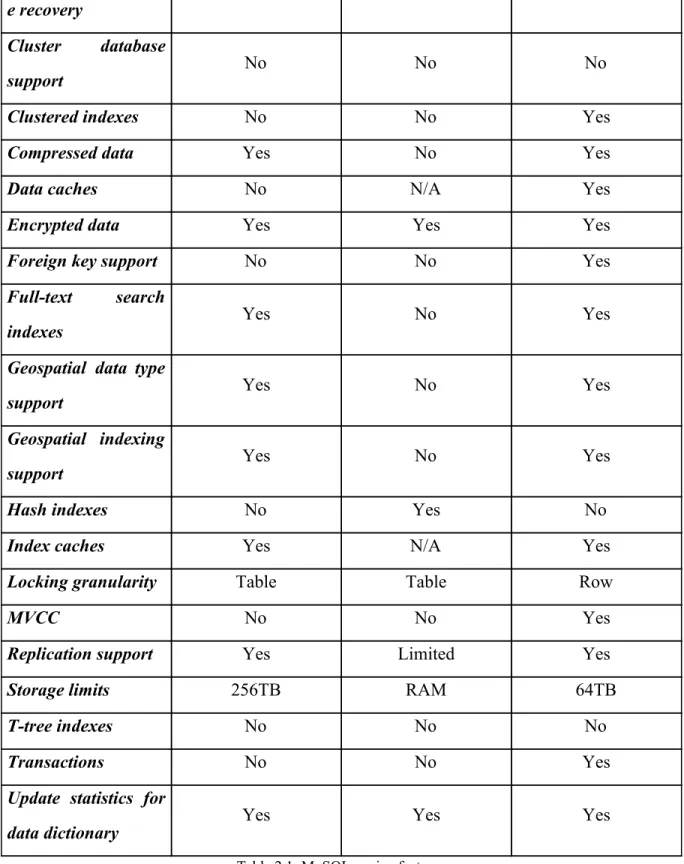
In the following table, we can see the main engine features:
Feature MyISAM Memory InnoDB
B-tree indexes Yes Yes Yes
e recovery
Cluster database
support No No No
Clustered indexes No No Yes
Compressed data Yes No Yes
Data caches No N/A Yes
Encrypted data Yes Yes Yes
Foreign key support No No Yes
Full-text search
indexes Yes No Yes
Geospatial data type
support Yes No Yes
Geospatial indexing
support Yes No Yes
Hash indexes No Yes No
Index caches Yes N/A Yes
Locking granularity Table Table Row
MVCC No No Yes
Replication support Yes Limited Yes
Storage limits 256TB RAM 64TB
T-tree indexes No No No
Transactions No No Yes
Update statistics for
data dictionary Yes Yes Yes
2.2.2. Redis
Redis is an open source key-value DBMS, developed by programmer Salvatore Sanfilippo programmer, and released for the first time in 2009.
It works with in-memory adaptive data structure used as databases, cache and message broker. Redis data type include:
● String: textual or binary safe blobs with a maximum length of 512 MB ; ● List: linked list of string;
● Set: unordered list of string ;
● Sorted Set: list of string ordered by a value; ● Hash: a data structure to store a key-value list;
● Bitmap: is not an actual data type, but a set of bit-oriented operations defined on the String type;
● HyperLogLog: a probabilistic data structure used in order to count unique things (technically this is referred to estimating the cardinality of a set).
Thanks to its high write and read performance due to massive RAM using, Redis becomes a popular choice for caching, storing, messaging, streaming and real-time analysis system. Redis works in central memory, however it provide two persistence mechanism:
● RDB: execute point-in-time snapshot of the dataset in a fixed interval; ● AOF: logs every write operation received by the server;
Besides, Redis supports Replication configuration that allows creating a dataset copy instance. It used a master-slave architecture, where master offers the dataset and slave asynchronously create a copy of them. It is possible to use this configuration also in a cluster configuration. This strategy makes Redis fault tolerant and allows better workload balance. To improve write and read performances it possible to create a master Redis instance for write operations and one or more Redis slave to perform reading.
Redis implements the Publish/Subscribe messaging paradigm where senders (publishers) are not programmed to send their messages to specific receivers (subscribers). Rather, published messages are characterised into channels, without knowledge of what (if any) subscribers there may be. Subscribers express interest in one or more channels, and only receive messages that are of interest, without knowledge of what (if any) publishers there are. This decoupling
of publishers and subscribers allows for greater scalability and more dynamic network topology.[16]
Redis provides a fast memory datastore ideal for real-time streaming; it is ideal to work with Apache Kafka and Amazon Kinesis for real-time analysis, social media e customising IoT.[17]
Redis provides server and client API software too. In this project it has been used Redis server v. 3.2.12 and C hiredis Client API.
2.3. Profiling
To analyse code quality and performance may be necessary to execute profiling software. In this thesis work has been utilised Valgrind software.
2.3.1. Valgrind
The Valgrind tool suite provides some debugging and profiling tools that help to make a program faster and more correct. The most popular of these tools is called Memcheck. It can detect many memory-related errors that are common in C and C++ programs, and that can lead to crashes and unpredictable behaviour.[18]
To use Valgrind tool has been necessary to rebuild the software and all its dependencies in debug mode.
3. RTA System Software Engineering
In this chapter, the software development and DevOps processes adopted during the thesis work are presented.
In the following paragraphs, the technologies behind the software development process that has been used to implement the software of this thesis work (the RTAlib), are listed, along with their description.
Furthermore, the theory of Continuous Integration and Continuous delivery is explained. Finally, the Continuous Integration processes adopted for the RTAlib are described: the first approach uses the online CI service CircleCI, the second is implemented with a local Jenkins CI server and the usage of a Singularity container to wrap the RTAlib software dependencies.
3.1. Agile&Scrum
The software development process implemented for this thesis work is based on the Agile approach. The Agile development process began to spread in the early 2000s, based on the "Manifesto for Agile Software Development". In 2001, seventeen leading thinkers of the software engineering and development research field, wrote this document in which they proposed a lightweight set of values and principles against heavyweight software development process such as the waterfall one.
The goal of the Agile approach is to reduce software development costs and time by increasing code quality and customers satisfaction. The Agile development process aims to achieve these goals pointing up four key aspects:
● Individuals and Interactions over processes and tools; ● Working Software over comprehensive documentation; ● Customer Collaboration over contract negotiation; ● Responding to Change over following a plan;
The Agile methodologies allow to continuously review the software specifications, adjusting them during the development process, through an iterative and incremental framework. They
also plan a strong exchange of information and opinions between the developers and the client. On the basis of these principles, every organization can develop its own implementation and habitual practices to improve outcomes.
Among the several Agile models available the Scrum model was used.
Scrum is a framework within which people can address complex adaptive problems, while productively and creatively delivering products of the highest possible value.
Scrum is:
● Lightweight
● Simple to understand ● Difficult to master
Scrum is a framework within which every team can employ various processes and techniques. The Scrum framework consists of Scrum Teams and their associated roles, events, artifacts, and rules. Rules bind together the team roles, events, and artifacts, governing the relationships and interaction between them.
Scrum is founded on empirical process control theory or empiricism. Empiricism asserts that knowledge comes from experience and making decisions based on what is known. Scrum employs an iterative, incremental approach to optimise predictability and control risk. Three pillars uphold every implementation of empirical process control: transparency, inspection, and adaptation.[19]
● Transparency: requires that all significant project aspect be defined by a common standard easily understandable by everyone.
● Inspection: Scrum users must frequently inspect Scrum artifacts and progress toward
a Sprint Goal to detect undesirable variances.
● Adaption: if an inspection notices one or more aspects of a process deviates outside acceptable limits an adjustment must be made as soon as possible to minimize further deviation.
The Scrum team is composed of the Product Owner, Development Team, and a Scrum Master.
work of the Development Team. The Product Owner’s decisions are visible in the content and ordering of the Product Backlog.
The development team is composed of a limited number of developers, possibly between 4 and 9 members, and they are responsible for the incremental software development.
The Scrum Master helps everyone to understand which interactions are helpful to maximize the knowledge share and value created by the Scrum Team.
The Scrum artifacts are something that provide to the team the key informations about the software development status: among the artifacts there are the Product Backlog, the Sprint Backlog and the Increment.
The Product Backlog is the single source of product requirements and for any changes to be made to the product. The Product Owner is responsible for the Product Backlog, and it must to keep it updated to the latest version. The two others type of artifacts will be discussed later in this paragraph.
The heart of the Scrum process is the Sprint, a time-box during which a working, useable, and potentially releasable product Increment is created. The Sprint Backlog is the set of Product Backlog items selected for the Sprint and it is a forecast by the Development Team about what functionality will be in the next Increment. The Increment is the sum of all the Product Backlog items completed during a Sprint.[19] The process of selecting the Product Backlog items for the Sprint Backlog is called Sprint planning and it is performed by the team.
Another key element of the Scrum approach is the Daily Scrum meeting, it is a meeting of the team members, during which the Development Team plans work for the next 24 hours. This optimises team collaboration and performance by inspecting the work since the last Daily Scrum and forecasting upcoming Sprint work.
Figure 3.1: Agile Scrum representation
3.2. GitHub
Before starting to talk about GitHub is necessary to explain what a Version Control System (VCS) is.
VCSs are software tools used principally from the software development team to manage their project and keep track of all changes made on them.
In the beginning, the code developed by the members of the development team had been stored and executed locally by each developer. The moment when multiple team members started to collaborate to the same software project, brought to a Centralised Version Control System (CVCSs).
Thanks to it, it was possible to store the work of each developer on a centralised server. This allow a developer that wants to collaborate to the project, to clone the source code locally.
This system allows everyone to know who does what but it presents a severe downside: the centralised server represents a single point of failure. If the central hard disk was corrupted or destroyed all work may be lost forever.
To deal this issue, it has been developed a Decentralised Control Version System (DCVS). In DCVS when a user clones the project in a local machine pulls up the code with its full history so that if any server dies any user can restore the project on the server system.
GitHub is a web-based DCVS, founded on Git project, born in 2008.
On 3 April 2005, Linus Torvalds and the Linux community began to develop this free and open source system to collaborate in a decentralised way to develop the Operating System kernel.
The new system provides: ● Speed
● Simple design
● Strong support for non-linear development (thousands of parallel branches) ● Fully distributed
● Able to handle large projects like the Linux kernel efficiently (speed and data size)[20] On 16 June 2005, it has been published the Linux kernel version 2.6.12, the first one managed with Git.
3.3. Waffle
Waffle is a online Scrum board: it visually depicts the iterations progress using cards to represent task items and columns to represent each stage of the process.
Waffle is built on top of the GitHub API and it allows to plan, organises and tracks in a graphical and interactive fashion the work of team.
Figure 3.2: Waffle Scrum Board
This software is mainly characterized by three features:
● Real-time Sync with GitHub: Waffle is synced with GitHub repositories, so the changes made to branches and commits is reflected to the position of the cards in the boards. As it is possible to view in Fig. 3.2 Waffle provide a more friendly visual interface. In Waffle board is possible to view which are task currently in progress, which are completed and which are the next tasks to be developed.
● Automatic Tracking and Powerful Metrics: during the design stage in Waffle board, each programmer plans the next task to work on, defining priority and estimated time. Based on these parameters Waffle can automatically update the milestone burndown graph and throughput graph. These graphs help teams to know its productivity and team capabilities in general.
● On-premise deployment, integrations and more: It also provided an on-premise version called Waffle Takeout. Other features include connecting multiple repositories in a single view, customizable workflows, and filtering via labels, issue text, milestone, or owner.
Figure 3.3 shows an extracted Burndown of a Scrum Sprint.
Waffle was launched in 2013 by a team led by Andrew Homeyer, a software engineer and intrapreneur at Rally Software in Boulder, CO, USA. Rally was acquired by CA Technologies
in May 2015. At present, Andrew is continuing to lead the enterprise lean startup company.[21]
Figure 3.3: RTAlib Burndown graph of a Sprint
3.4. Containers
A container is a software package that contains applications and all the needed dependencies. Furthermore, it does not require any installation and so make its environment isolated from the guest operating system.
These software units are particularly suitable in software development because its easy portability allows to create, develop and testing software always in the same environment. Containers share the guesting operating system kernel, in contrast to virtualisation technique which executes different operating system on the same hardware shared by a hypervisor mediator.[22]
A virtual machine has to virtualise all operating system, application and hardware too and this makes it heavy and slow. Furthermore, containers have a small size because add only necessary project source and for this containers require fewer resources and make them faster than a virtual machine.
Figure 3.4: Virtual Machine architecture vs Container architecture
3.4.1. Docker
Docker was born in 2008 as an open source technology that allows creating a modular and incremental lightweight virtual machine.
Docker is mainly used in DevOps context to provide to developers an environment that can be used in production phase allowing them to focus on writing code without worrying about the system that it will ultimately be running on.
Each Docker image file consists of multiple layers, which together make up a single image. Docker reuses these layers to speed up the process of creating containers. The changes are shared between the images, further improving speed, size and efficiency. Version control is part of the stratification process. This multilayer structure allows to extract and modify a single component, and besides, it is so possible to execute the rollback if the new container version is not satisfied as the previous one.[23]
Docker image is launched and managed from a user software execute in the user space: Docker Container. This approach has much less overhead between the host kernel and the application, improving performance respect than virtualisation environment.
Figure 3.5: Docker architecture
3.4.2. Singularity
Singularity developed by Gregory M. Kurtzer in April 2016 as an open source High-Performance Computing solution to satisfy researcher need for “mobility of compute”. Singularity differentiates from Docker for two main reasons:
● namespace usage; ● root privilege;
In contrast to Docker, Singularity uses less microservice as possible to use the smallest number of namespaces necessary to achieve its primary design goals. This gives Singularity a lighter footprint, greater performances potential and easier integration than container platforms that are designed for full isolation.
The Singularity security paradigm is different from the Docker’s one. Singularity it was developed for HPC type shared-infrastructures where every user is considered untrusted. In order to let untrusted users running untrusted containers the users can run the containers as
themselves: the root privileges are only required for the container building process that could be done in another environment (and not in the shared one).
In this thesis work, it has been used the version 2.6 of Singularity.
Figure 3.6: Singularity Container
3.5. Continuous Testing and Integration
Continuous Integration (CI) is a widely established development practice in software development process, in which members of a team integrate and merge development work frequently, for example multiple times per day. CI enables software companies to have shorter and frequent release cycle, improve software quality, and increase their teams‘ productivity. This practice includes automated software building and testing.[24]
It is essential in this context to have an automatic framework for the testing and the quality check of the code that is updated frequently and shared by several collaborators.
Continuous Testing (CT) is a software testing phase in which the individual software units are tested and if the tests are successfully passed, software units are combined together with the
others and tested as a group. If the software fails the test phase, a notification is sent to the developers who are will have to solve the problem. In addition to the testing phase, the integration of tools for the evaluation of the code quality is often included in the continuous integration.
For this thesis work, two state-of-the-art software tools for continuous integration have been used: CircleCI and Jenkins.
CircleCI is a web-based continuous integration platform that can be integrated with GitHub repository. If a developer interacts with the GitHub API (for example to open a pull request), the CircleCI system is automatically triggered and a .yml recipe is executed. The recipe uses a docker container to run the code and test it: if the software pass the test then it can be released.
Jenkins is a self-contained, open source automation server which can be used to automate all sorts of tasks related to building, testing, and delivering or deploying software. It’s executed inside a “local” web server and in a similar way to CircleCI executes a Jenkins file to perform software testing. It requires a more complex previous configuration than CircleCI. It has a very large community of developers and a huge set of plugins that can be added to the default installation to increase the functionalities of Jenkins or to improve the existing ones. The plugin used for this thesis work are: the Blue Ocean plugin and the GitHub Integration plugin. The first allows a user to create a testing pipeline in a visual fashion, automatically creatin g the Jenkins file from the graphic scheme the user made. The second plugin allows Jenkins to trigger build processes after interactions as pull requests are made with the GitHub servers. To perform CT and the overall CI containers are needed. Issues are tracked by an Issue Tracking system. Graphical User Interface tools can be used to check metris of code quality and suggestion to improve them. Unit testing metrics are also provided (e.g. code coverage).
3.5.1. Unit testing
Unit testing is a software development process aimed to test the "units": the smallest piece of code that can be logically isolated in a system.
To perform the unit testing of C++ code it has been used a framework developed by the Google Testing Technology team. Among the googletest features, it is possible to found a rich set of assertions, user-defined assertions, death tests, fatal and non-fatal failures, value-parameterized tests, type-parameterized tests and XML test report generation.
3.5.2. Code quality metrics
It is difficult to give a general definition of code quality. Most developers agree that high quality code uses coding conventions, is readable and well documented, avoids duplication, provides an error management system, includes a tests environment, and provides security best practices. In this context particular attention is given to following aspect:
● Maintainability: represent a qualitative measurement of how easy it is to make changes in the code.
● Duplication code: indicates the part of code repeated in the software.
● Testing suite: Unit and Performance test provides an indicator of software functionality and requirement satisfaction.
3.5.3. Issue tracking system
Issue Tracking Software (ITS) is a software that manages and maintains lists of issues, as needed by an organization or developer team. Issue tracking systems are used in development work tracking to create, update, and resolve reported software issues. An issue tracking system is similar to a "bugtracker", and is considered one of the "hallmarks of a good software team".
3.5.4. Testing metrics
There are several test metrics that allow a software development team to evaluate its test quality strategy. During my thesis work particular attention is given to code coverage. Code
coverage represent a percentage indicator that measures the amount of code evaluated during the tests.
3.6. From Continuous Integration to Continuous Delivery
Continuous Integration (CI) aims to improve the Scrum development methodology providing a frequent integration of all developer working copies into a shared repository, where also code quality is checked. In this context, Continuous Testing is just a step added to the CI. The CI has success if code quality and tests runned during the continuous test have success. Another step is the Continuous Delivery.
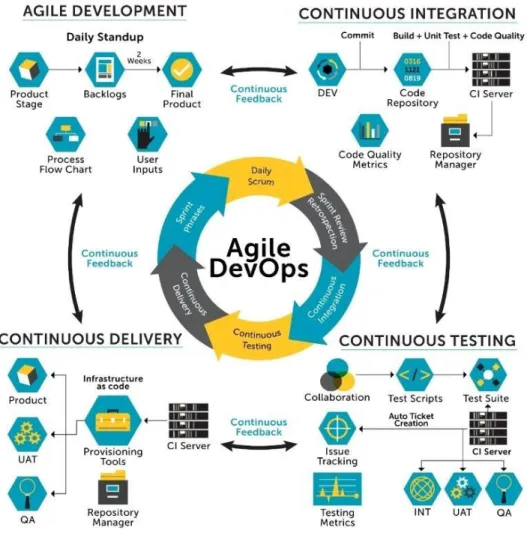
Continuous Delivery aims to ensure that the code is always in a deployed state, and that all code checked in to main branch of shared repository can be safely deployed into production. The points presented in this paragraph represent some of the crucial points of the DevOps process. DevOps (Development and Operations) is a software development process that aims on collaboration and integration between developers and information technology operations. Figure 3.7 show a brief scheme of DevOps process.
3.6.1. Infrastructure as code
Infrastructure as code (IaC) is the process of managing and provisioning data centers through machine-readable definition files, rather than physical hardware configuration or interactive configuration tools. The infrastructure could comprise both physical equipment, virtual machine or containers in definition files. The definition files may be in a version control system. It can use either scripts or declarative definitions, rather than manual processes, but the term is more often used to promote declarative approaches.
Figure 3.7: Agile DevOps representation
3.7. RTA software development implementation
The team in which I worked for this thesis, based its strategy and software development process on the principles of the Scrum and DevOps approaches previously described.
3.7.1. Working environment
A Linux CentOs user account has been given to each team developer allowing the developers to remotely log in to the INAF servers using the ssh protocol. The Git version-control system
has been used. The developed projects have been stored in remote repositories on the GitHub web platform.
3.7.2. Development workflow
The RTA Scrum team is composed by a Scrum Master/ Product Owner and four developers. The client is represented by INAF and the CTA Consortium.
The Scrum planning phase has been managed through daily meetings of 30 minutes or 1 hour and weekly sprints. During the daily meeting held on Skype, each team member described the work done until that time, the problems he encountered and what task he would carry out next. If the daily meeting was the first meeting of the week, new tasks to be performed in the next weekly sprint, were identified by the Scrum Master.
A Scrum board has been used to organize and assign the tasks to the team members: a Scrum boards visually depict the iterations progress using cards to represent task items and columns to represent each stage of the process. Cards are moved from left to right to show Sprint progress and to help coordinate team performing the work.
The Waffle platform has been used as Scrum board implementation. The “RTAlib” board has been created composed by the following stages: “Inbox”, “In Progress”, “Review”, “Done”. The RTAlib Waffle board has been linked with the RTAlib GitHub repository: this has allowed the automatic generation of a GitHub issue upon the creation of a new card. The card is therefore linked to the issue and they share the status: they are assigned to teams members and labeled with tags, milestones and manpower value expressed in story points (i.e. hours). The connection between Waffle and GitHub is reflected also into the process of starting the development of new cards/tasks: the beginning of a new task involves the generation of a new card that is hung on the “Inbox” column of the Scrum board and an unique identifier is automatically created and assigned to the card; then, a development branch must be opened and its name must contains an hashtag followed by the card ID. This connection allows the GitHub issue to be tracked down by the Waffle platform: the card is automatically moved into the “In Progress” column by Waffle itself. Once the development iteration is complete, the code is pushed into the remote repository and a pull request must be opened: if the name of
the pull request contains the string “closes #<card-id>”, the card is automatically moved into the “Review” column.
Pull requests let team members to tell others about changes that will be merged into the master branch. Furthermore, the pull request can be used to trigger automatic code reviews: the code review highlights possible problems in terms of code quality and performance leaks. Once the problems have been solved, the code can be merged with the mainline of development by the Scrum master. In this step, conflicts between the new and old code can be arise and they must be resolved in order to merge successfully the pull request code into the master branch.
3.7.3. RTA Continuous Integration
Two technologies for continuous integration have been explored and implemented. In both solutions an integration with the GitHub servers has been setted up and therefore the automatic triggering of the unit testing process and the estimation of the corresponding code coverage.
The first solution uses the CircleCI platform and also exploits the code quality features provided by the Code Climate and Codacy tools.
The second solution implements a custom local continuous integration server with the Jenkins platform.
In both solutions the same unit test suite that was developed for this thesis work has been used. In particular the googletest framework to test C++ project and the unittest framework to test the Python version of the project. In Chapter 7 the unit testing for the C++ project is described.
3.7.3.1. Remote CI with CircleCI
In order to set up a continuous integration process with CircleCI, the first thing to do is to create a YAML file that describes how the testing environment must be setted up and which tests must be performed. The YAML file must be placed in the root folder of the project into an hidden folder called .circleci. The YAML file is a recipe that instructs the CircleCI server telling what steps must be performed in order to setting up a test environment. The CircleCI platform uses Docker containers to guarantee reproducibility and portability. In particular, in the first section of the YAML file, the name of a Docker image must be specified. For convenience, CircleCI maintains several Docker images. These images are typically extensions of official Docker images and include tools especially useful for CI/CD. For this purpose the circleci/python:3.6.6 Docker image has been used. Two other Docker containers have been applied as further layers on top of the first layer. Again, two images maintained by the CircleCI community have been used: circleci/mysql:5.7.23-ram and circleci/redis:4.0.10-stretch. The resulting environment contains the Python 3.6.6 interpreter and a MySQL and Redis database servers.
The next step in order to successfully deploy a CircleCI continuous integration process, is to define one or more workflows: a workflow is composed by Jobs that, in turn, are collections of Steps. All of the steps in the job are executed in a single unit which is executed within the Docker container. The jobs belonging to the same workflow can run in sequence or in parallel.
The “circleci_rtalib_test” workflow has been created running two jobs in parallel: the “CxxRTAlibTest”and “PyRTAlibTest” jobs.
Within the job, the first thing to do is to define the working directory, in which all commands, later defined, will be executed.
working_directory: ~/rtalib-circleci
Subsequently, it is necessary to define the Job implementation in terms of Steps: a collection of command to execute delimited by a key-value pair. The keywords are provided by CircleCI to personalize the workflow execution:
● checkout: checkout project source code from the working directory; ● run: it allows to specify a bash command to execute;
● save_cache: it allows to generates and stores a cache of files such as dependencies or source code to reuse later; it requires a key to identify those files;
● restore_cache: it restores a previously saved cache based on a key; ● deploy: a special step for deploying artifacts;
● store_artifacts: step to store artifacts as logs or binaries files;
The first commands of the Step are used to create some directories in which the software dependencies will be installed.
mkdir ~/rtalib-circleci/External_Libraries_Building_Area
mkdir ~/rtalib-circleci/CxxRTAlib_External_Dependencies_Installed
mkdir ~/rtalib-circleci/test_artifacts;
touch ~/rtalib-circleci/test_artifacts/python_unittest_results.txt; touch ~/rtalib-circleci/test_artifacts/cxx_unittest_results.txt; touch ~/rtalib-circleci/test_artifacts/
/python_codecoverage_results.txt;
Subsequently, the Steps to install the external dependencies are executed. Installing the numerous external library dependencies during every building process is very expensive. For this reason, the caching feature offered by CircleCI is used.
The “run” keyword is used to execute the bash commands to compile and install the packages inside the CircleCI server. Once the installation phase is completed, the "save_cache" keyword is used to associate a key to the installed packages.
This key will be used in subsequent builds by the "restore_cache" which will check if the key corresponds to a previously installed and working process in the cache. If it does not correspond, the installation commands are executed again.
Following the installed packages are listed:
● MySQL client
● MySQL C++ connector ● MySQL Python connector ● pipenv package
● hiredis client connector ● cmake software;
● Boost library;
● cfitsio NASA C library; ● googletest framework;
In Appendix 7.2 the commands to compile and install the packages are reported.
Now it’s possible to compile the C++ version of library developed for this thesis work, and to execute the unit test.
The unit tests generate a xml log report that can be sent to the CodeClimate service using the CodeClimate test-report tool: the informations about the code quality, the results of the unit tests and the unit test coverage percentage of the developed code will be reported on the CodeClimate custom web page of the project. The test logs can be also stored in CircleCi through the artifact_store keyword.
3.7.3.2. Local CI with Jenkins
Jenkins can be installed through native system packages, Docker, or even run standalone by any machine with a Java Runtime Environment (JRE) installed. The latter solution has been chosen. The Jenkins source code has been downloaded and installed through yum, with the commands reported in Appendix 7.1. A new Jenkins project can be setted up and configured through the Jenkins GUI. The project creation process and its configuration are showed in Appendix 7.2 .
3.7.3.2.1. The pipeline
Jenkins is, fundamentally, an automation engine which supports a number of automation patterns. Pipeline adds a powerful set of automation tools onto Jenkins, supporting use cases that span from simple continuous integration to comprehensive CD pipelines. The definition of a Jenkins Pipeline is written into a text file (called a Jenkinsfile) which in turn can be committed to a project’s source control repository. This is the foundation of "Pipeline-as-code"; treating the CI/CD pipeline a part of the application to be versioned and reviewed like any other code.
Jenkinsfile example: pipeline { agent any stages { stage('Build') { steps { // }
} stage('Test') { steps { // } } stage('Deploy') { steps { // } } } }
The example shows the structure of a CD Jenkins pipeline: stages are used to define processes that are made by multiple steps.
The Blue Ocean plugin has been installed. Blue Ocean is a project that rethinks the user experience of Jenkins, modelling and presenting the process of software integration and delivery with a new UI that aims to improve clarity, reduce clutter and navigational depth to make the user experience very concise.[25] It also gives the possibility to create Jenkins pipelines in a graphical and interactive way. The Blue Ocean UI has been used to create the continuous integration pipeline for the software developed for this thesis work. In the Appendix 7.3 the Jenkinsfile and the build process configuration is described.
The Jenkins pipeline developed for this thesis work, uses a Singularity image. In the next paragraph, the purpose of the Singularity image will be described.
3.7.3.2.2. The Singularity image
There are three main reasons that led to the development of a Singularity container: the first reason is to have a reproducible environment in which the software developed for this thesis work could be tested. The second is that the container environment it can be the same environment for the production phase of the software. The third reason, is about Continuous Delivery: if the unit testing (that are executed automatically thanks to the Continuous Integration pipeline) executes successfully inside the container, the container can be delivered and used in production. In addition, the container keeps all the required dependencies of the software, decreasing the time requirement of a Jenkins build process (no need to reinstall the dependencies every time).
The process to develop a Singularity container is composed by several steps: the first step is to create a Singularity Recipe. Then, the recipe must be built in order to create a Singularity Image. Finally the Singularity image can be used as a container in four different ways: executing a simple command inside the container, executing a shell inside the container, running the container or executing the container as a stand-alone container instance.
In the Appendix 7.3.1 the process with which the Singularity image has been obtained is described.
4. RTAlib
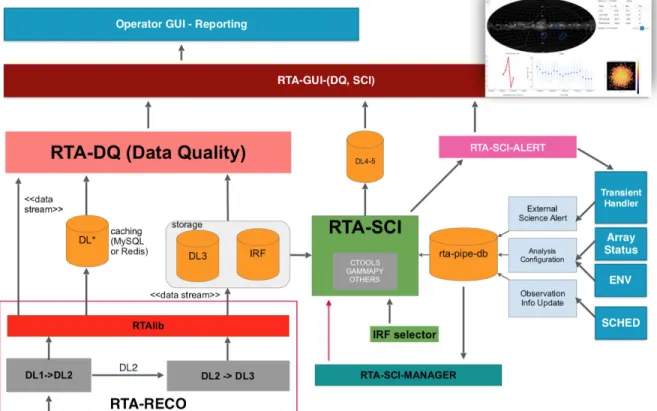
The aim of this chapter is to describe the problematics behind the CTA data handling and how the RTAlib software framework developed for this thesis can enable the Real-Time Data Analysis in the “On-Site” area of CTA.
Figure 4.1: CTA Data Flow
4.1. CTA On-Site Analysis
The CTA On-Site Analysis is an hardware and software system for the analysis of scientific data of the Cherenkov events and for the performance/data quality monitoring of the telescopes cameras that will be performed on the same site of the telescopes.
CTA is expected to generate a large data rate, due to the large number of telescopes, the amount of pixels in each telescope camera and the fact that several time samples are recorded in each pixel of the triggered telescopes. Depending on (i) the array layout, (ii) the data reduction scheme adopted, and (iii) the trigger criteria, the data rate estimate vary from 0.5 to 8 GiB/s.