HIGH SPEED RAIL DEMAND:
EMPIRICAL AND MODELLING EVIDENCES FROM ITALY Ennio CASCETTA
Department of Transportation Engineering, “Federico II” University of Naples Pierluigi COPPOLA
Department of Enterprise Engineering, “Tor Vergata” University of Rome
1 INTRODUCTION
High Speed Rail (HSR) represents the future of medium-haul intercity transport provided that a number of projects have been developing all over the world, despite the financial and economic crisis. In Europe, in order to achieve the strategic objectives of social inclusion, cohesion and accessibility, the European Commission launched in 1998 a program to define the standards to develop an integrated and interoperable HSR network. Indeed, the European HSR has largely expanded in the last decades: following the LGV (Ligne à Grande Vitesse) in 1998 connecting Paris and Lyon (420 Km), HSR services are nowadays diffused in Spain (Renfe), Germany (ICE), Benelux (Thalys) and Italy (TAV) for a total of about 6.500 kilometers; new projects are under discussion or are in progress in Sweden, UK, Portugal, Russia and Turkey. On the other hand, in the Far-East, the pioneer Tokaido-Shinkansen HSR line (launched in 1964 for the Tokyo Olympic Games, between Tokyo and Osaka) has nowadays been joined by 5 new HSR lines for a total network extension of about 2300 Km for 353 million of annual passengers. As of 2011, China is the country with the more extended routes in service including more than 3.500 km of rail lines at 300 km/h operating speed, and the network is expected to largely expand in the next years.
Different typologies of HSR management models, depending on the use (exclusive or mixed) of the HSR infrastructure can be distinguished. The Japanese case, for instance, is an example of exclusive HSR infrastructure with single operator: the High Speed Railways is entirely separated from the rest of the railways network and the High Speed trains run only on such infrastructure. On the other side, we find the French operation model, in which the HS trains can use both HSR and non-HSR (duly potentiated) infrastructures. From the operations perspective, there are cases with a single operator in charge of the infrastructure and of the operations, as in Japan, where each of the 6 Shinkansen lines (infrastructure and service) is managed by a different private operator, or as in Spain and France where there is a single national operator in charge of the infrastructure and the service; and cases in which there is a distinct owner of the infrastructure and a different service operator, as it is in Germany, in Italy, and in Benelux for the Thalys, whose trains run on the HS infrastructure of different National Railways (Netherland, Belgium, France). From 2012, In Italy there will be the first case of competition among HSR operators on the same infrastructure and the same market, when the new private HSR operator “Nuovo Trasporto Viaggiatori” (NTV) will start operations competing with the incumbent Trenitalia. The Italian case study presents also an additional peculiarity
regarding the network configuration. In facts, while most of the HSR projects have been conceived to connect pairs of cities in the distance range of 500-700 Km (e.g. Tokyo-Osaka, Paris-Lyon, Madrid-Barcelona,…) creating a competing modal alternative versus the air transport, in Italy, due to the structure of the Nation, the HSR connects a sequence of medium and large metropolitan areas at distances in the range of 100-250 Km, becoming a sort of “national-metro” line. As a result the Italian HSR not only does compete with air transport but also, and mostly, with the auto. Such structural differences in the Italian national transportation market, together with the ongoing economic crisis with no antecedents in the globalization era, create the conditions for a unique case study to investigate the behavior of long-distance passengers and to test travel demand forecasting methodologies. The paper is organized as follows. In section 2 the Italian HSR project is presented starting from the characteristics of the current network and its recent developments. In section 3 empirical evidences of the evolution of the inter-province travel demand in the study area (in-scope demand) are discussed in terms of overall travel demand growth, modal shares and travelers’ characteristics, before and after the new HSR line operations. The latter is based on an extensive survey campaign consisting of on-board counts and on RP-SP interviews gathered during between the years 2008 and 2011. In section 4 a modeling framework developed to forecast travel demand in future scenario of analysis is presented; furthermore, in section 5, some applications of such model simulating several scenarios including services lines, fares and timetables will be discussed. Finally, conclusions and further research areas are reported in section 6.
2 THE ITALIAN HSR PROJECT
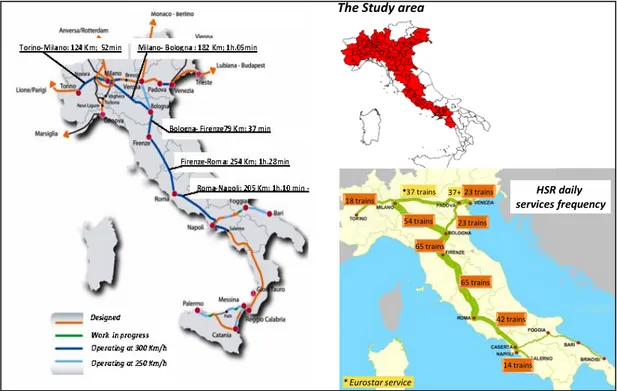
In Italy, the first HSR service was launched in 1992 between Firenze and Roma with the so called “direttissima”, allowing trains to run at 230 Km/h and covering the 254 Km between Roma and Firenze in about 2 hours. The project of the “direttissima”, however, dated back to 1970. As a matter of fact, the new-generation HSR (i.e. with trains running at 300 Km/h maximum speed) was launched in December 2005 between Roma and Napoli (205 Km) and Milano and Bologna (182 Km). The project had a second step onward in December 2009 when the Milano-Torino (125 Km) and the Bologna-Firenze (79 Km) lines were completed, as well as the urban penetration in the cities of Roma and Napoli. As a matter of fact, from 2010 the backbone of the Italian HSR network is fully operative (see fig 1).
The Study area 23 trains 23 trains *37 trains 18 trains 54 trains 65 trains 65 trains 42 trains 14 trains HSR daily services frequency * Eurostar service 37+
Figure 1: the Italian High Speed Rail network
Today the service includes several city pairs at distances in between 100-250 Km, e.g. Roma-Napoli (205 Km in 1 hour and 10 minutes), Milano-Torino (125 Km in 54 minutes) and Roma-Milano with a direct service covering 515 Kilometers in 3 hours (Table 1). The HSR service frequency on the HSR network ranges from 1 train/h to 4-5 train/h in the peak period on the sections between Roma, Firenze and Bologna (Figure 1).
Table 1: distances and travel times by Rail before and after the HSR on selected OD Pair. distance (Km) Travel times before HSR Travel times after HSR Decrease of travel times Torino-Milano 125 1h-33' 54' -42% Torino-Roma 640 6h-30' 4h-30' -31% Milano-Roma 515 4h-30' 3h -33% Milano-Napoli 720 6h-30‘ 4h-55' -31% Milano-Bologna 182 1h-40' 65' -35% Bologna-Firenze 79 59' 37' -37% Roma-Napoli 205 1h-45' 1h-10' -33%
The Italian HSR project is still under development. The travel times station-to-station, which have already been reduced of about 30-40% (Table 1), are expected to be further reduced with the completion of the new underground bypass-stations in Bologna and Firenze that will allow to speeding up the service in such dense urban areas. Moreover, Trenitalia has announced the launch of new-generation HS trains running at 360 Km/h as of 2015, which would reduce the travel time from Roma to Milano down to 2 hours and 40 min; and several extensions of the current network are in progress, such as
the Milano-Venice and the Torino -Lyon, or are being discussed (e.g. the Napoli-Bari and the Milano-Genoa sections).
Finally, starting from 2012 the new HSR operator “Nuovo Trasporto Viaggiatori” (NTV) will be operative on the national HSR network, competing with the incumbent Trenitalia, giving rise to the first case in the World of competition among HSR operators on the same line (i.e. multiple operators on a single infrastructure). NTV’s fleet will include the Alstom AGV trains with a capacity of 460 seats per train against the ETR 500 and the ETR 600 Trenitalia rolling stock, respectively of 600 and 430 seats per train. In terms of runs and train-Km, NTV is expected to cover about one third of the Italian HSR market: 35.000 train-Km/day vs. 78.000 train-Km/day by Trenitalia (Table 2).
Table 2: comparison between service planned by NTV and Trenitalia (new and incumbent HSR Operator)
#runs/day TrainKm/day SeatKm/day (mil.) Avg. Distance per train Avg. TrainCapacity Trenitalia (year 2011) 105 78.162 43,9 744 561 NTV (Base scenario) 51 35.238 15,9 691 460 3 EMPIRICAL EVIDENCES
Since 2008 a vast campaign of surveys has been carried on monitoring the evolution of the national demand of passenger transport, compared to the modification of HSR services supplied, in terms of total trips, modal split between auto and train services (i.e. Intercity, Eurostar, HSR), individual trip frequency, travelers daily routine and life-styles. The surveys consisted of: a) on-board counts on the HSR and Intercity trains, carried on in May and October 2009, May and October 2010, and in May 2011; b) RP/SP interviews carried on in May 2009 and October 2010. The counts were used to update the existing outdated OD matrices of Eurostar and Intercity trips, and to estimate the current inter-province OD flows on Intercity and HSR (the latter having, in the last year, gradually replaced the Eurostar service). Together with the source data available of the national highway traffic (AISCAT 2009,2010) and of the domestic air passenger demand (ENAC 2009,2010), the total demand in the study area (Figure 1), and the relative modal shares have been estimated for year 2009 and year 2010.
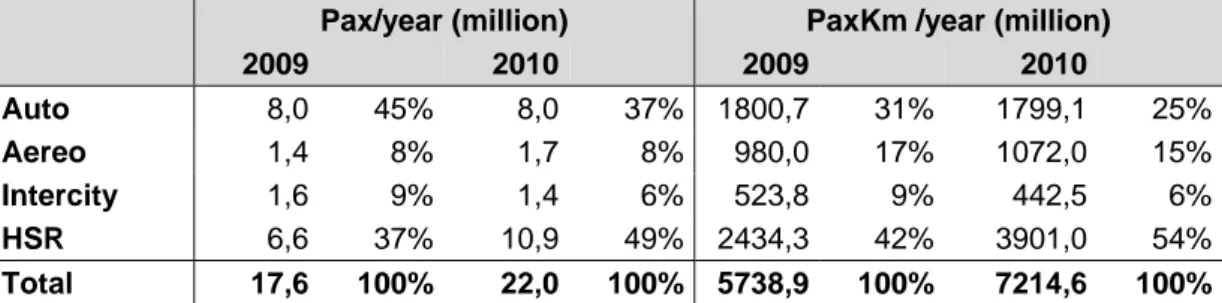
Between the main cities connected by the new HSR lines (i.e. the cities of Napoli, Roma, Firenze, Bologna, Milano and Torino ), it can be observed (Table 3), both in terms of Passenger and Pass-Km’s per year, there was a substantial reduction of the share of trips in auto (i.e. Passengers from 45% to 37%, Pass-Km from 31% to 25%) and an increase of HSR modal share (i.e. Passengers from 37% to 49%; Pass-Km from 42% to 54%); air transport basically has maintained its market shares; Intercity showed a slight decrease from 9% to 6%.
Table 3: modal split of trip between the main provinces served by HSR, in the years 2009 and 2010.
Pax/year (million) PaxKm /year (million)
2009 2010 2009 2010 Auto 8,0 45% 8,0 37% 1800,7 31% 1799,1 25% Aereo 1,4 8% 1,7 8% 980,0 17% 1072,0 15% Intercity 1,6 9% 1,4 6% 523,8 9% 442,5 6% HSR 6,6 37% 10,9 49% 2434,3 42% 3901,0 54% Total 17,6 100% 22,0 100% 5738,9 100% 7214,6 100%
The percentage variation of the HSR modal shares of Passengers (+32%)and Pass-Km’s (+29%) compared to the reductions of the HSR travel times, ranging from 30%-40% (see Table 1) allow us to estimate an observed HSR demand direct elasticity with respect to travel time ranging from -0,81 to -1,1 in terms of Passengers and from -0,71 to -1,0 in terms of Pass-Km’s. Looking more in depth at single OD pairs, we observed the variations of HSR demand vary significantly with the OD distance: for example between Firenze and Bologna (79 Km) after the introduction of the HSR services (which reduced the travel time by 37%) there was an increase of demand of 91% corresponding to an elasticity of -2,5; between Milano and Napoli (720 Km) after the introduction of the HSR services (which reduced the travel time by 31%) there was an increase of demand of 41% corresponding to an elasticity of -1,3. The elasticity’s reported here are very substantial; they are comparable with the elasticity’s reported in the literature by studies of the type presented here (see, for instance, Yao and Morikawa, 2005; Park and Ha, 2006; Roman et al., 2007). On the average, if we consider the overall increase of demand volume from 2009 to 2010 (i.e. including both demand growth, induced and diverted components) between the above cities (i.e considering the percentage variation of the HSR total volumes), we estimate an increase of HSR passengers from 6,6 million to 10,9 million (+65%) and of HSR Pass-Km’s from 2,4 billion to 3,9 billion (+63%). Such percentages give rise to an overall elasticity value ranging from -1,6 to -2,1 in terms of passengers and from -1,5 to -2 in terms of Pass-Km’s (Table 4).
Table 4: observed HSR demand direct elasticity’s with respect to travel times.
HSR modal shares HSR total volumes
Pax -1,1 ÷ -0,81 -2,2 ÷ -1,6
PaxKm -1,0 ÷ -0,71 -2,0 ÷ -1,5
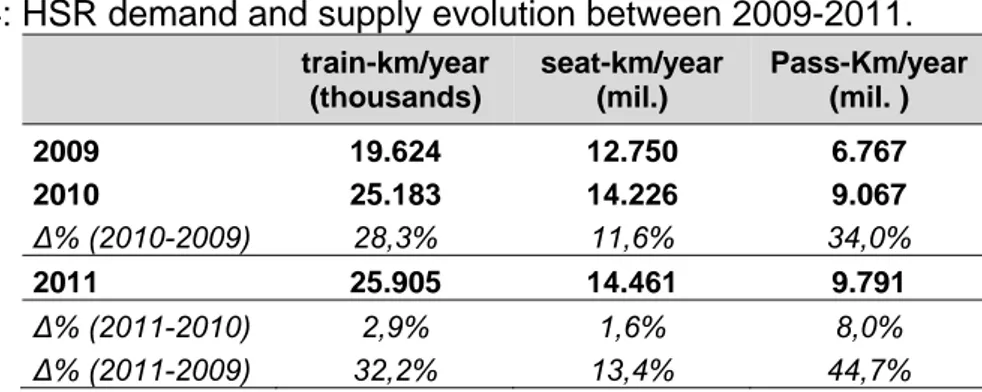
In the whole study area, the increase of HSR demand between 2009 and 2010 was about 34%, from 6,7 billion to 9,1 billion of passenger-km (Table 5). The increase of demand in percentage is much higher than the increase of supply both in terms of seat-Km (+11,6%) and in terms of train-Km (+28,3%). Moreover, such increase of demand seems not to run down in 2011, where an additional 8% of HSR passenger-Km can be observed against an almost invariant supply of train-Km (+2,9%) and seat-Km (-1,6%).
Table 4: HSR demand and supply evolution between 2009-2011. train-km/year (thousands) seat-km/year (mil.) Pass-Km/year (mil. ) 2009 19.624 12.750 6.767 2010 25.183 14.226 9.067 ∆% (2010-2009) 28,3% 11,6% 34,0% 2011 25.905 14.461 9.791 ∆% (2011-2010) 2,9% 1,6% 8,0% ∆% (2011-2009) 32,2% 13,4% 44,7%
The increase of passenger-Km partly due to increased modal share, partly due to the partial recovering of the national economy after the financial crisis of 2008-2009, and partly due to the additional demand induced by the HSR. In facts, a variation in the generalized travel cost on HSR services can induce (Table 6): a) a shift between alternative railways services (intercity vs. HSR), and from alternative modes of transport (air, auto) to HSR (i.e. diverted demand); b) a change in the destination of the trip, and/or in the trip frequency (i.e. induced demand).
The induced demand, in turn, may depend either “directly” on the generalized travel cost, i.e. the trip become more frequent because traveling with HSR is faster, cheaper and/or more comfortable, or “indirectly” due to a modification of the travelers’ lifestyle, e.g. travelers start commuting (i.e. making more frequent trips) due to the relocation of the residence or of the workplace, and partly due to changes in land use, e.g. the number of residents, jobs and activities.
Table 6: taxonomy of the impacts on HSR demand.
DIVERTED DEMAND
from other modes e.g. shift from air/auto to HSR
endogenous factors
from other rail
services e.g. shift from Intercity to HSR
INDUCED DEMAND
direct e.g. increase of trip frequency,
change of trip destination
indirect
e.g. increase of mobility due to change in life-styles and
land use exogenous
factors DEMAND
GROWTH
e.g. increase of mobility due to economic growth
To investigate more in depth the above phenomena, particularly those related to the induced demand, a retrospect survey has been designed and a modeling architecture simulating in a disaggregate manner the above components of the HSR demand are under development. Preliminary results of the retrospect survey have been gathered on the Roma-Napoli segment (Cascetta et al., 2011). Here the travel time has, firstly, been reduced from 1 hour and 45 minutes by the Eurostar service, at a fare of 22 and 31 euro per (one-way) trip respectively for 1st and 2nd class, before the opening of HSR,
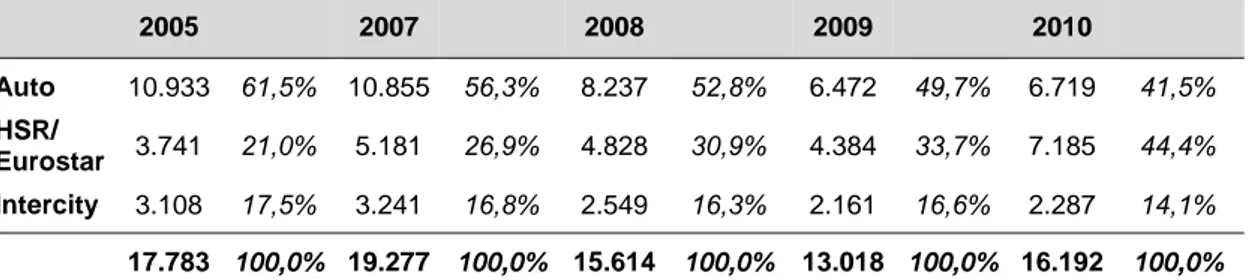
to 1 hour and 25 minutes, at a fare of 33 and 43 euro per (one-way) trip respectively for 1st and 2nd class, after the opening of the December 2005 (i.e. the whole line except of the urban penetration in Roma and Napoli). Secondly, it has been further reduced to 1 hour and 10 minutes, at a fare of 45 and 57 euro per (one-way) trip respectively for 1st and 2nd class, after the completion of the urban penetrations in Roma and Napoli. Against these changes in the level of service the modal share on HSR demand has constantly increased during the year 2005-2010 despite the decline in total (all modes) demand observed in the years 2008 and 2009, due to the global economic crisis (Table 7).
Table 7: demand evolution on the Roma-Napoli segment (average-day estimates) 2005 2007 2008 2009 2010 Auto 10.933 61,5% 10.855 56,3% 8.237 52,8% 6.472 49,7% 6.719 41,5% HSR/ Eurostar 3.741 21,0% 5.181 26,9% 4.828 30,9% 4.384 33,7% 7.185 44,4% Intercity 3.108 17,5% 3.241 16,8% 2.549 16,3% 2.161 16,6% 2.287 14,1% 17.783 100,0% 19.277 100,0% 15.614 100,0% 13.018 100,0% 16.192 100,0%
The retrospect survey, carried in 2008 among travelers using different trains services (i.e. HSR, Eurostar and Intercity) and drivers on the highway between Napoli and Roma, after one year of operations of HS trains allowed the estimation of the components of the generated demand. Considering the average working day, it has been estimated a 53,7 % of HSR travelers that did not change trip frequency and mode/service (i.e. travelers who travelled Eurostar, now moved on the HSR), the remaining 46,3% consisting of: travelers (12,5%) who did not make any trip before HSR (i.e. new demand “indirectly/exogenously” induced by change in lifestyle; travelers (15,4%) who have increased their trip frequency; travelers (6,9%) who diverted from other modes; and travelers (11,5%) who diverted from other services, mainly from intercity trains (Tab.8).
Table 8: HSR demand segmentation on the Roma-Napoli section (2008).
Working day Saturday Sunday passenger not having changed
frequency and mode 53,7% 40,1% 42,1%
passenger having changed frequency
and mode 46,3% 59,8% 57,9%
new demand 12,5% 13,6% 8,8%
increasing frequency 15,4% 12,7% 15,6%
diversion to HSR from other modes 6,9% 11,6% 14,0%
diversion to HSR from other Rail
services 11,5% 21,9% 19,5%
Furthermore, it has been observed most of the HSR induced trips were due to business trips (percentages ranging from 38,7% in Sundays to 57,4% in
working days) while education related trips (percentages ranging from 3,4% in Sundays to 6,2% in working days) and other purposes trips (percentages ranging from 52,5% in Sundays to 30,2% in working days) showed lower fractions. Moreover, a significant percentage of HSR induced demand was related to commuting (percentage ranging around 6%) corresponding to people that moved the residence in the first year of operations (mainly from Roma to Napoli) starting to commute every day (Table 9).
Table 9: segmentation of the induced demand on the Roma-Napoli section by trip purpose (2008).
Working day Saturday Sunday
Business 57,4% 68,5% 38,7%
Commuting
(i.e. residential re-location) 6,2% 0,0% 5,4%
Education related purposes 6,2% 8,7% 3,4%
Other purposes trips 30,2% 22,8% 52,5%
100,0% 100,0% 100,0%
4 THE DEMAND FORECASTING MODELING ARCHITECTURE
To forecast the Origin-Destination (OD) passenger volumes by HSR services, a methodology based on integrated demand and supply models, estimated and validated by RP-SP surveys and traffic counts, has been developed (Figure 2).
The OD matrices by railways services (Intercity and HSR) and by auto and air transport are updated based respectively on the traffic counts and source data using a GLS estimator (Cascetta, 2009). The “National demand growth” model projects the base year total OD volumes to future years, according to assumed macroeconomics trends (e.g. GDP growth, oil price).
The schedule-based mode choice model estimates the market share of different inter-province transportation modes, including alternative rail services, such as Intercity, High-Speed, 1st and 2nd class, and individual trains (i.e. runs) characterized by different timetables. Within the proposed modeling forecasting framework the run-based model is applied at a first level to the current supply scenario in order to reproduce the current mode-service share by the fine tuning of the mode/service Alternative Specific Constants (ASC) (i.e. model calibration); at a second step the model, fed by the level of service attributes computed by the supply model, forecast the OD modal share in the future scenario.
The induced demand model (see Ben-Akiva et al., 2010), estimates the additional HSR demand generated by changes in destination and trip-frequency due to the improvement of HSR generalized travel cost.
Finally, the OD flow on the HSR services are assigned to individual trains allowing the forecasting of occupancies on each train and each station-to-station link.
Demand growth model Future supply scenarios Schedule-based mode choice model (by purpose and user class)
Current OD matrices (corrected by traffic counts) OD matrices (all modes) by time slice OD modal shares Induced demand model Future OD matrices (NTV E TRENITALIA) Current sypply
scenario Schedule-based mode choice
model (Estimation) Model calibration RP-SP Surveys Traffic Counts and source data Desired Departure Time (DDT) demand distribution Supply Models (diachronic network) Flows on individual trains
Figure 2: the HSR demand forecasting methodology 4.1 Supply models
The overall modeling framework is currently based on a zoning system consisting of 220 zones (Figure 3).The study area includes all the Italian regions with the exception of the islands of Sicily and Sardinia. The “external” regions of Abruzzo, Molise and Umbria (on the Adriatic corridor) and the regions of Trentino-Alto Adige and Valle d’Aosta (in the North) are each represented by one zone. All the other Italian provinces have been split into two zones: one zone for the main city of the province and one zone for the rest of the province. Moreover, the main Italian cities have been further divided into several zones: Roma into 13 zones; Napoli into 8 zones; Torino into 6 and Milano into 10 zones.
A system of transportation network and service supply models has been developed to estimate the OD level of service by road, air, and rail. The supply models includes: a) a road network consisting of a graph with 1900 nodes and 7000 links representing 35000 Km of the national roads; b) a rail network consisting of a graph with 2600 nodes and 5500 links representing 14500 Km of railways (60% with single track, 40% with double track).
In the current transport scenario, the simulated services supply system includes 500 daily domestic flights between major Italian airports plus the following railway services: 111 High-Speed trains; 232 intercity trains; 4.466 interregional and regional trains (the latter here represented to simulate the access-egress to HSR services). The resulting diachronic network includes about 126.500 nodes and 330.000 links.
2600 nodes 5500 links (representing 14500 Km) 1900 nodes 7000 links (representing 35000 Km) Railways graph Road graph
Figure 3: the adopted zoning system of Italy and the road and railways infrastructures networks
4.2 The demand growth model
The study here presented, started in 2008, in the middle of the severe phase of the current financial and economic crisis. The expectations on the Economy decline had no antecedent in the globalization era, so in order to estimate the impacts on the total (all modes) demand volumes, instead of using the usual elasticity’s from previous studies on HSR, a specific demand growth model was developed to capture a correct response to the downturn of the National Economy. This is here reported in details as it has been the base for the applications presented in the next section 5.
The demand growth model is a linear regression model relating the demand volumes to general economic factors with a specific focus on past observed recession and stagnation period: the evolution of demand (d) depends on the Gross Domestic Product (GDP) and the oil price percentage variation between two successive years:
[ ]
[
]
[
]
[
]
[
]
otherwise 01 , 0 GDP 0 1 price _ Oil price _ Oil GDP GDP GDP GDP ) 1 ( d d 1 t t 1 t t 1 t t t 1 t t t 1 t t < Δ ⎩ ⎨ ⎧ = Δ ⋅ + Δ ⋅ ⋅ + Δ ⋅ − ⋅ + = Δ − − − − − + − δ γ δ β δ β αThe model was calibrated using time series (1980-2007) data of GDP, expressed in constant 2000 Euro, provided by ISTAT, Italian Institute of Statistics, and the yearly average oil price, also expressed in 2000 Euro, provided by Italian Ministry of Economic Development.
The model is used to derive elasticity’s of demand with respect to GDP growth for periods of increasing economy and for periods of economic stagnation. Different assumptions have been made to identify the threshold between those periods. Starting from 0% (the threshold which typically identifies periods of economic recession), we have found out that a 1% threshold is the most appropriate value in reproducing the traffic estimates and in terms of goodness of fit. In facts, the multiplier of the GDP evolution has two values: a lower value "beta -" if the growth is below 1% and a higher value "beta +" if the GDP growth greater than 1%. The resulted elasticity’s on GDP and oil price is consistent with those used in Spain and France although not differentiated according to the GDP variation sign (Cabanne, 2003).
Table 9: estimated parameters of the demand growth model.
Parameter value t_ratio P>z alpha 0,001 0,851 0,443 beta + 1,186 4,568 0 beta - 0,611 1,554 0,098 gamma% -0,157 -2,517 0,011 rho_2 0,65 #obs 28
By applying the model to years 2008, 2009 2010 using respectively the GDP delta% values of -0,9%, -4,6%, -0,50%, the model predicts a reduction of travel demand comparable to those observed by AISCAT, i.e. the association of national Highways (Table 10).
Table 10: observed vs. (back-casting) estimated travel demand growth in Italy.
GDP % variations
Total (all modes) Demand variation %
Model estimates Observed values *
2008 -0,90% -0,50% -0,50%
2009 -4,60% -2,76% -2,40%
2010 -0,50% -0,26% -0,20%
*Source: AISCAT
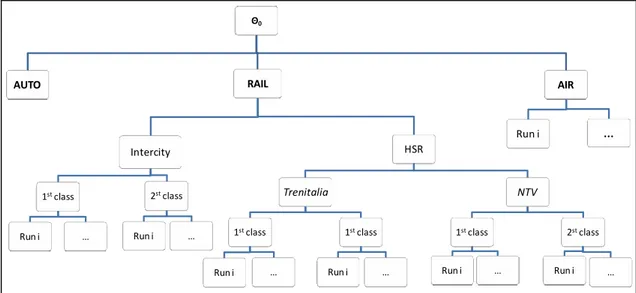
4.3 The schedule-based mode-service choice and assignment model The mode- service choice model is a schedule-based mode-service choice model aiming at simulating the competition between transportation modes and HSR operators (i.e. Trenitalia and NTV) based not only on travel times and cost but also on the actual departure time of the trains and flights (i.e. timetables).
The model is set as a Nested-Logit models (see Ben-Akiva and Lerman, 1985) with a nesting structure to capture higher degrees of substitutions
among specific subsets of modal alternatives, particularly the HSR alternatives provided on the same route by different operators, i.e. NTV vs. Trenitalia (Fig.4). To Authors’ knowledge this is the first application of an integrated mode-service-run choice model to intercity travel demand at the national scale. Θ0 AUTO RAIL Intercity 1stclass Run i … 2stclass Run i … HSR Trenitalia 1stclass Run i … 1stclass Run i … NTV 1stclass … Run i 2stclass Run i … AIR … Run i
Figure 4: the nesting structure of the schedule-based mode/service choice model.
Travelers are assumed to have the following 8 mode/service alternatives: • Auto
• Air
• Intercity Trenitalia 1st class • Intercity Trenitalia 2nd class • High Speed Trenitalia 1st class • High Speed Trenitalia 2nd class • High Speed NTV 1st class • High Speed NTV 2nd class
For Air and Rail (intercity + HSR), the alternatives runs available are distinguished by departure time. The choice set of the runs was obtained by comparing different choice-set generation rules, and computing the coverage ratio observing the runs actually chosen by the travelers in the RP survey. Travelers are supposed to select the first non –dominated runs “early” and the first non-dominated run “late” with respect to the Desired Departure Time (DDT). The DDT distribution among travelers has been estimated using an RP survey carried out in October 2010 through the maximum Likelihood method, for two difference distance class, i.e. less and greater than 400 Km, and two travel purposes, i.e. Business and Other purposes (Figure 5).
Figure 5: the estimated Desired Departure Time (DDT) distribution by distance class and travel purpose.
The models were estimated for two trip purposes (i.e. “Business” and “Other”) through Maximum Likelihood method, using SP survey in order to capture preferences for new on-board services such as free internet, and, mostly, the new NTV operator not yet in the market. The estimation was based on disaggregate data gathered in a RP-SP survey carried out during October 2010. The following attributes of the systematic utility of the alternatives resulted to be statistically significant:
- Level of service attributes: • Travel time
• Travel cost, by 4 categories of travelers (travel alone vs. party, reimbursed vs. not reimbursed)
• Access/egress time, for Air and Rail • Schedule delay w.r.t. DDT
- Socio-economic attributes:
• Professional condition (high vs. low) • Degree (yes vs. no)
• Travel frequency
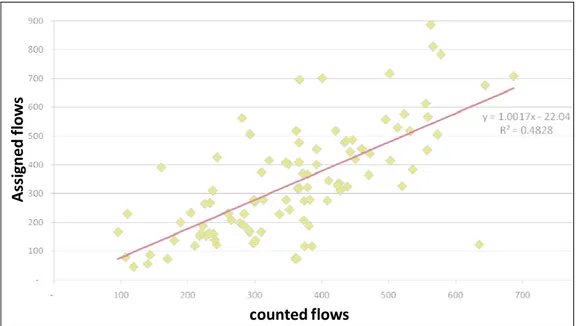
A stochastic assignment model with no capacity constrains was adopted to load the diachronic network and estimate the flow on individual trains. In Figure 6 a scatter diagram of the assigned flows on-board on each HS trains and links predicted by the model and counted in the working day of October 2010 is reported.
counted flows A ssi gn e d fl o w s
Figure 6: scatter diagram of predicted vs. counted on-board trains (October 2010).
The rho squared is 0,48 which is comparable to the rho squared (i.e. 0,52) of the regression plotted out using the counted flows in May and October 2010; in other term the error of the model is within the day-to-day variability of the observed train flows on the HS links.
October (counted flows)
Ma y (c ou nted fl o w s)
Figure 7: scatter diagram of counted flows on May and October 2010.
5 APPLICATIONS
The model has been applied to predict the impacts on national passenger volumes of the new HSR services and operators as of 2012 (i.e. incoming of the new operator NTV) and subsequent years. Different hypothetical scenarios have been tested under different macroeconomic assumptions and
marketing strategies of the HSR competitors on the long distance (i.e. NTV vs. Trenitalia).
It should be stressed that reference and alternative scenarios reported in the following are hypothetical and do not represent commercial choices made by both NTV and Trenitalia operators.
5.1 Reference scenario
Assuming the 2010 as base-year, GDP growth up to 2015 was estimated using the current forecasting of the Italian Ministry of Economic Development. Using the demand growth model, the cumulated demand growth accordingly estimated is equal to +8,2%.
The reference scenario (year 2012) with the NTV service fully operative shows an increase of passenger-Km per year of 9,2% w.r.t. 2010 with a split between NTV and Trenitalia respectively of 33.4 % and 66,6%. Given an overall demand growth in 2012 of 3,3%, a net increase of demand due to the additional HSR services of NTV of a significant 5,9 % (i.e. about half a billion of Pass-Km) can be estimated, representing the sum of the induced and diverted demand at year 2012 cause by the increase of HSR frequencies. In the reference scenario it was assumed that the NTV service network reproduced the structure of Trenitalia services (Figure 8).
5.2 Policies tested
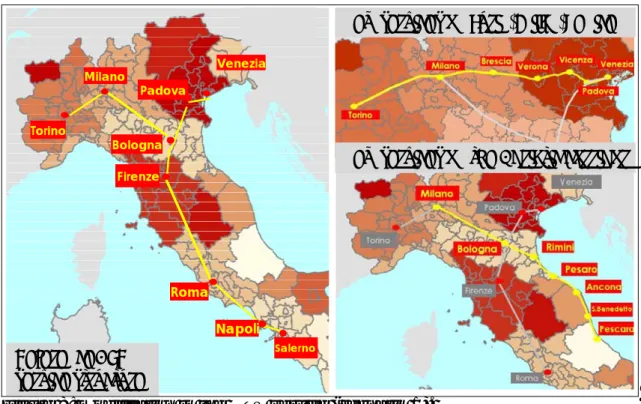
The applications here presented regard some potential strategic and operational policies of the new operator NTV, such as :
• modification of the service structure, i.e. reduce the service on the Torino -Milano-Salerno HSR line and add new HSR services on the Adriatic corridor (MI-BO-PE)1 and Torino -Milano-Venice corridor running on mixed HSR and conventional-rail sections (scenario 1)
• Variation of the fares (scenario 2)
• Optimizing the timetables to increase passenger flows (scenario 3)
In the scenario 1, the results show that it is possible with the same quantity of train-Km reduce the rolling stock fleet by 1 unit and increase the passenger-km’s of 3%.
In scenario 2, two hypothesis have been tested starting from a reference case in which the first class fare were the same and the second class fare of NTV were 8% less than Trenitalia: Case 1) Trenitalia reduces the HSR fares of 20%; Case 2) both the HSR operators reduce the fares by 20% w.r.t. reference case.
1
To test such scenario a modification of the initial zoning system was needed: the region Marche and Abruzzo were split respectively into 10 and 6 new zones.
Venezia Bologna Firenze Padova Milano Torino Roma Napoli Salerno new services on the Adriatic corridor new services on Turin‐Milan‐Venice Reference HSR service structure
Figure 8: modification to the NTV service (scenario 1).
In the first case, Trenitalia market share increase from 66,3% to 71,5% and conversely NTV market share reduces from 33,4% to 28,5%; the HSR overall demand increases by +5,4%. In the second case, the overall HSR demand increases by 7,3% while the HSR market shares remains almost the same as in the reference case. This allows us to estimate some direct and cross (HSR demand) arc-elasticity to the fares. In particular it can be estimated a direct elasticity of total HSR demand w.r.t. fares of -0,37 and a HSR operators cross-elasticity of +0,74 (i.e. a fare reduction of by one operator induce a decrease of traffic on the competing operator). Higher value of cross operators elasticity’s than modal elasticity’s are to be expected given the correlation structure of the perceived utility according to the nested structure of Figure 4.
Finally, the third application (Scenario 3) was conceived to show how and to what extent modifications of the timetable to better fit the curve of the travelers desired departure time (DDT), can improve the patronage. An example is reported in Figure 9, where the traffic flow diagram on a specific no stop train from Milano to Roma is reported in two different cases of departure time from “Milano P. Garibaldi” station: at 6.45 am and at 7.15 am. It can be observed (Figure 9) that in this case shifting onwards the departure time of the train of 30 min, increases the on-board traffic of a substantial amount.
Figure 9: passengers on board a specific train under different departure time hypothesis.
6 CONCLUSIONS AND FURTHER RESEARCH AREAS
The empirical evidences from the Italian HSR market, presented in this paper, show an outstanding increase of passenger-Km between 2009 and 2011 (+45%) on the Italian HSR network. This is partly due to increased HSR modal share, partly due to the recovering of the national economy after the financial crisis of 2008-2009, and partly due to the additional demand induced by the HSR. Compared to the variation of travel time (ranging from 30% to 40% depending on the OD), direct elasticity’s values of HSR demand w.r.t. travel time, significantly greater than 1 (in absolute value) were observed. Such values are very substantial, but are comparable with those reported in the literature. Moreover, an inverse relationship of the elasticity values with the distance has been observed, i.e. the lower the OD distance the higher the elasticity’s of HSR demand, suggesting for non-linear effects of induced demand which need to be verified more in depth and possibly quantified. Further investigations will focus on the week-end mobility and on the foreigners (occasional) demand flows.
On the other hand, the modeling framework here developed, based on mixed RP-SP interviews gathered in between 2009 and 2011 to forecast the national passenger demand, presents a nesting structure to capture higher degrees of substitutions among specific subsets of modal alternatives, particularly the HSR alternatives provided on the same route by different operators, i.e. NTV vs. Trenitalia. The estimated (by the model) direct elasticity’s of HSR demand with respect to HSR fares is -0,37; a value of +0,74 of cross elasticity’s w.r.t. among competing HSR operator have been estimated.
The OD flows on the HSR services have been assigned to individual trains allowing the forecasting of occupancies on each train and each station-to-station link. The error of the model has resulted to be within the day-to-day range of variability of the flows. The area of improvement of the current
modeling framework is in more disaggregate models of induced demand and in a finer level of simulation of the urban accessibility, introducing a more disaggregate access/egress mode choice modeling.
Bibliography
AISCAT (2009, 2010) Notiziario trimestrale a cura dell’Associazione Italiana Società Concessionarie Autostrade e Trafori. Roma, Italy.
Ben Akiva M. and Lerman S. (1985) Discrete Choice Analysis MIT Press. Ben-Akiva M., Cascetta E., Coppola P., Papola A., and Velardi V. (2010) “High speed rail demand forecasting in a competitive market: the Italian case study” Proceedings of the World Conference of Transportation Research (WCTR), Lisbon, Portugal
Cascetta E. (2009) Transportation Systems Analysis : Models and Applications. Second Edition. SPRINGER.
Cascetta E., Papola A. Pagliara F, and Marzano V. (2011) “Analysis of mobility impacts of the high speed Roma–Napoli rail link using within-day dynamic mode-service choice models” Journal of Transport Geography, Volume 19, Issue 4, pp. 635-643
Cabanne I. (2003) “A long-term model for long distance travel in France” Proceedings of European Transport Conference (ETC), Strasbourg, France. ENAC (2009,2010) Dati di traffico degli scali italiani a cura della Direzione Sviluppo Aeroporti. Roma, Italy
Hsu C., and Chung W. (1997) A model for market share distribution between high-speed and conventional rail services in a transportation corridor” The Annals of Regional Science; 31(2), pp. 121-153.
Froidh O. (2008) “Perspectives for a future high-speed train in the Swedish domestic travel market” Journal of Transport Geography, Volume 16, Issue 4, pp 268-277.
Park Y., and Ha H-K. (2006) “Analysis of the impact of high-speed railroad service on air transport demand” Transportation Research E, Volume 42, Issue 2, pp. 95-104
Roman C., Espino R., and Martin C. (2007) “Competition of high-speed train with air transport: The case of Madrid–Barcelona” Journal of Air Transport Management, Volume 13, pp. 277–284
Thill J.C., and Kim T.M. (2005) “Trip making, induced travel demand, and accessibility” Journal of Geographical Systems, Volume 7, Number 2, pp. 229-248,
Yao E., and Morikawa T. (2005) “A study of an integrated intercity travel demand model” Transportation Research A, Volume 39, Issue 4, pp. 367-381.