UNIVERSITÀ DEGLI STUDI DI CATANIA
International PhD in Chemical Science
XXIX ciclo
Cunsolo Alessandra
PORPHYRIN DERIVATIVES AS VERSATILE
PROTEASOME MODULATORS
PhD Thesis
Tutor : Prof. R. Purrello
Co-Tutor : Dr. A.M. Santoro
PhD Coordinator : Prof. S.
Sortino
"Learn from yesterday, live for today, hope for
tomorrow. The important thing is not to stop
questioning"
1
Preface
The focus of this research has been the proteasome, with a particular emphasis on its interaction with porphyrins.
It is known that cationic porphyrins behave as proteasome inhibitors and their potency depends on the number of positive charges. During this PhD study, carried out in close collaboration with other Italian and foreign research groups, we have worked towards a deeper understanding of the molecular mechanisms responsible for the interactions between proteasome and the tetra cationic porphyrin H2T4. Moreover, other porphyrin, porphyrinoid derivatives and bio-inspired molecules have been studied for their potential roles in modulating proteasome function. Surprisingly, the tetra anionic porphyrin H2TPPS has an unexpected activator quality on 20S proteasome in both cell based assays and purified 20S CP.
From these studies emerge a new scenario where these macrocyclic molecules, thanks to their inhibitory action on the proteasome, are becoming increasingly rich multi-target molecules for oncological applications.
This research has also uncovered novel porphyrin molecules capable of activating the proteasome suggesting that they are capable of not just inhibition but “proteasomal modulation” and, if correctly designed, they are able to interact with the electrostatic access code of proteasome’s core particle allowing for biological activities.
Table of Contents
Chapter 1 - Introduction ... 1
Chapter 2 - State of the art ... 4
2.1 Proteasome ... 4
2.2 Proteasome activation ... 9
2.3 Proteasome inhibition ... 11
2.3.1 Enzymatic Inhibition Mechanisms. ... 13
2.4 AFM study on Proteasome 20S. ... 21
2.5 Porphyrins as proteasome’s inhibitors. ... 25
Chapter 3 -Experimental Session ... 29
3.1 Materials and Methods ... 29
3.1.1 Chemicals ... 29
3.1.2 Proteasome activity assays ... 33
3.1.3 Kinetic assays (Inhibition Mechanism) ... 35
3.1.4 Wild Type proteasome purification from yeast ... 35
3.1.5 α3ΔN (mutant proteasome) sample preparation from yeast. ... 37
3.1.6 Atomic Force Mycroscopy (AFM) experiments ... 37
3.1.7 UV-Visible - Circular Dichroism (CD) - melting experiments ... 38
3.1.8 Cell Culture ... 38
3.1.9 Proteasome-GloTM Cell Based Assay ... 39
3.1.10 MTT Assay ... 39
Chapter 4 -Studies on interaction between cationic porphyrins ( H2T4 and its isomeric forms) and 20S proteasome ... 41
4.1 Goal of this study ... 41
4.2 Inhibition potency of H2T4 and his isomers on purified proteasome 20S .. 41
4.3 NMR analysis of H2T4/proteasome complexes ... 45
4.4 Kinetic study ... 47
4.5 Molecular Modeling and stopped-flow investigation ... 49
4.6 Conclusions ... 57
Chapter 5 – Focusing on 20S proteasome conformations ... 58
5.1 Goal of this study ... 58
5.2 Kinetic Assay on WT and Mutant 20S from yeast ... 58
1
5.4 Circular Dichroism (CD) and Melting investigation ... 65
5.5 Conclusion ... 70
Chapter 6 - Porphyrin and Porphyrinoid compounds: inhibition potency on purified proteasome 20S ... 71
6.1 Goal of this study ... 71
6.2 Porphyrin and Porphyrinoid compounds: fluorescence activity assay on purified proteasome 20S and kinetic mechanism studies ... 73
6.3 Porphyrins and porphyrinoids effectiveness on intact cells: in cell proteasome activity and vitality evaluation ... 80
6.4 Conclusions ... 82
Chapter 7 - Anionic porphyrin H2TPPS actives 20S proteasome ... 83
7.1 Goal of this study ... 83
7.2 Anionic porphyrin H2TPPS: fluorescence activity assay on purified human 20S and yeast wild-type/mutant 20S proteasome ... 83
7.3 Spectroscopic investigation: Circular Dichroism experiments ... 84
7.4 AFM characterization ... 88
7.5 Conclusion ... 90
Chapter 8- Derivatives of natural compounds: inhibition potency on purified proteasome 20S ... 91
8.1 Natural compounds and their capability to inhibit proteasome ... 91
8.2 Goal of this study ... 93
8.3 Screening of bio-inspired molecules ... 93
Conclusion ... 97
References ... 99
Acknowledgments...106
1
Chapter 1 - Introduction
The ubiquitin–proteasome system (UPS) is the primary degradation system in eukaryotic cells, with high selectivity for a myriad of soluble proteins, and perturbations in the UPS are associated with numerous human disorders. For this reason the proteasome has become a pharmacological target for cancer and neurodegenerative diseases1 where opposite effects are desirable, inhibition and activation respectively.
Interestingly, accumulation of the ubiquitin-conjugated proteins, which have been tagged for degradation, but not efficiently degraded have been observed at advanced age in many tissues. Similar phenomena have been observed in many diseases such as Alzheimer, Parkinson, and other neurodegenerative disorders2. In-line with these data the efficiency of the UPS and the proteasome in particular decrease with age, which suggests a link between neurodegenerative diseases and UPS dysfunction. Ubiquitinylated protein accrual has also been observed in senescent cells (which accumulate with age) and maybe caused by dysfunction of the proteasome or the ubiquitinating/deubiquitinating machinery3. It has been suggested that activation of the proteasome core might be a potential strategy to minimize protein homeostasis deficiencies underlying aggregation-related diseases, such as Alzheimer’s and Huntington’s disease4. Therefore, stimulating proteasome activity seems to be very promising as a therapeutic strategy for this type of pathology.
It is also known that multiple hallmarks of cancer such as replicative immortality, apoptosis resistance, and increased proliferation, are clearly dependent on the proteasome and UPS. For this reason proteasome inhibition is a very promising anti-cancer therapy yet there are very few drugs available for this use.
Also, despite the initial success of these treatments competitive proteasome inhibitors have severe side effects and specific cancers show resistance to these drugs.5
2
For this reason scientists are trying to develop new inhibitors, which can act as proteasome allosteric modulators, because this class of compounds could offer several advantages. Allosteric modulators have the potential for greater specificity and reduced side effect profiles.
Another promising anti-cancer therapy could emerge from promiscuous proteasome inhibitors, which target both the proteasome, as well as other known cancer viability pathways such as pro-growth, anti-apoptotic, and cell cycle pathways (multi-target molecule).
Porphyrins are excellent candidates for multi-target molecules because:
1. Cationic porphyrins are proteasome inhibitors.
2. Porphyrins inhibit the activity of telomerase, an enzyme responsible of the telomeric elongation. Porphyrin’s can stabilize the telomeric G-quadruplex structure by capping it, which subsequently decreases cancer cell growth6.
3. These molecules are already in use as an anticancer treatment for PDT7 and BNCT8.
4. They are natural products present in our bodies (heme in hemoglobin) and therefore do not cause problems in terms of biocompatibility.
5. They have a very versatile chemistry. In fact, porphyrins are unique molecules; their extended π system leads to a remarkably high extinction coefficient making them highly hydrophobic. Moreover, fictionalization (mainly at the meso-positions) with charged substituents makes them water-soluble; the number and reciprocal dispositions of charged peripheral groups allows, in turn, to modulate their tendency to (self-) aggregate.9,10
Porphyrins can be regarded as polytopic complexing agents because, in addition to the chemistry related to the periphery (which is tunable in terms of number, nature, and reciprocal disposition of substituents), the central core also has a manifold role in determining their physicochemical behavior.11,12 In fact, besides protonation, insertion of different metal ions in the four-nitrogen core, gives additional control of the spectroscopic features (especially concerning the emission properties) and permits us to tune the interactions of these macrocycles with templates, as well as their self-assembly processes.
3
Moreover, there is increasing interest for natural compounds with medicinal properties termed nutraceuticals within the scientific community. Natural products have been the source of most active ingredients in medicine; for this reason, more than 80% of drug substances were natural products or inspired by a natural compound. In particular, molecules such as quercetin13, resveratrol14, epigallocatechin-3-gallate (EGCG)15. It has been shown that consumption of fruits and vegetables containing these compounds reduces the risk of cancer by inhibiting proteasomal activities. Derivatives of cinnamic acids are ubiquitous in plants and foods (i.e., fruits, vegetables, coffee) and have been identified as interesting compounds with antioxidant, anti-inflammatory and cytotoxic properties16.
This research project is centered around the proteasome, with a particular emphasis on the interaction between porphyrins/porphyrinoids and this multi-proteolytic system.
Finally, we have begun to investigate the anti-proteasomal activity of a new class of bio-inspired natural compound derivatives.
These studies have been carried out using different approaches and techniques: spectroscopic, computational, imaging-microscopy (AFM), molecular/cell biology.
4
Chapter 2 - State of the art
2.1 Proteasome
The ubiquitin−proteasome system (UPS) is the major cytosolic proteolytic system in prokaryotes and eukaryotes17 with critical functions in cell cycle control, apoptosis, inflammation, transcription, signal transduction, protein quality control, then it also responsible to eliminate defective proteins and it determine the half-life of every protein in cell.18
The end point of the UPS is the 26S proteasome, an endoprotease of about 2.5 megadaltons that functions primarily to degrade proteins that have been modified by the attachment of ubiquitin.19 (Figure 1)
Figure 1: UPS behavior.
Proteasome 26S consist of a barrel-shaped 20S core particle (CP) capped by one or two 19S Regulatory Particles (RP).20
The core particle (CP), 20S proteasome, is a tube-shaped complex of 28 subunits arranged in four hetero heptameric rings. According to the crystal
5
structure models of yeast and mammalian 20S proteasomes, the diameter of the cylinder is nearly 12 nm, and the length approaches 16 nm21 . It is made of four rings with seven members each: two external α-subunits rings (antechambers) and two central β-subunits rings (catalytic chamber).22,23
In the catalytic chamber there are two duplicates of three different proteolytically active β-subunits: β1, β2 and β5, exhibiting caspase- (CP-L), trypsin- (T-L) and chymotripsin-like (ChT-L) activity, respectively.24,25,26
In the α face there is a swinging gate which is responsible of the substrate entrance which in this way is able to arrive to the catalytic chamber (Figure 2).
Figure 2: Diagram of eukaryotic core proteasome particle (20S
proteasome) and the α face in which there is the swinging gate27 .
The gate is built from short N-terminal sequences of α subunits28.
The conformation of the gate: closed or open (Figure 3), determines if the core proteasome is in the “latent” or “activated” state, prohibitive or receptive to the uptake of substrates29.
6
i ii
Figure 3: Top view of the α rings for closed (i) and open (ii) CP
configurations. The intersubunit clefts where C termini of many proteasome regulators dock, including the regulatory particle (RP), are circled 30.
The diameter of the gate, which is about 2 nm, defines the nature of substrate polypeptides: they need to be unfolded or at least have a poorly organized structure to fit into the narrow opening31.
The gate movements are regulated by two processes: “from the inside” and “from the outside”32.The first one doesn't require additional protein cofactors and it's an example of allostery33.
In fact, the active sites send an allosteric signal to the gate and a gate opening is obtained thus making the proteasome ready to accept the substrate molecule.33
The signal for gate opening in the latent proteasome may still originate in the active center, perhaps as a result of the reorganization of water molecules and hydrogen bonds around the catalytic threonine33.
Polypeptide are able to enter in the native latent core particle because the 20S constantly switches between the closed-gate and open-gate states32,33. The more stable closed-gate conformation prevails and is more abundant than the open-gate conformation. However, even less abundant, the amount of 20S with open gate is sufficient to accept a substrate and to activate the allosteric feedback loop34.
The “from the outside” or extra molecular path of gate opening provides an excellent example of protein-protein interaction. The ring is not only a receptor
7
of allosteric signals from the catalytic chamber; in fact it's used as platforms for the attachment of protein complexes which are able to modulate the core particle activity, forming "proteasomal assemblies" (Figure 4)35. A closer inspection of α-face reveals the presence of shallow grooves between the subunits36 (Figure 3 ) which serve as anchor pits for all the known regulatory modules.
The best-known and most physiologically relevant module is a 900 kDa heteromultimeric protein complex called regulatory particle (RP) or 19S cap37. The architecture of RP was revealed using cryo-electron microscopy imaging, X-ray diffraction modeling and affinity mapping38 .
How previously said, the core can be capped by two 19S complexes; however a single 19S assembly is sufficient for bestowing the ability to process polyubiquitinated substrates to the proteasome, and for general increase of the enzyme’s activity.
The 26S proteasome is the most structurally and functionally advanced form of the proteasome.
Thus, the assembly of the mature 26S proteasome is a tightly regulated and reversible process which leads to conformational changes displacing α subunit tails and opening the gate39; however, it's not still well known the mechanistic features of the process.
8
Figure 4: Proteasome assembly - Left : 20S CP composed by seven
-subunits (with two duplicates of three different proteolytically active β-subunits) and seven different α-subunits which anchor different regulatory complexes: 19S (PA700)(right, below) or PA28 (11S/REG) (right, upward) 40
Instead, it's know that the peptidase activity of eukaryotic CP can be activated by a variety of treatments;41 for example, exposure to low levels of sodium dodecylsulfate (SDS).
Moreover, It was shown that the nine residual tails (GSRRYDSRT) from the N-terminus of the α3-subunit are important for the function of the CP. The importance of the tails in the function of CP is indicated by the remarkable evolutionary conservation of these sequences across eukaryotes. Of the seven tails the one in α3 subunit is unusual and its rearrangement is fundamental for opening of an axial channel and its deletion cause a structural perturbation. Actually, the deletion of the α3 tail (artificial modification which allow to obtain a "mutant" α3ΔN 20S proteasome) has little effect on peptide hydrolysis by
9
the 26S proteasome; instead the principal in vitro effect is to activate the free CP from the repressed state that it exhibits in its free form.42
(a) (b)
Figure 5 : Electron density maps (colored in gray) of the yeast core
particle (gray sticks) from (a) wild type and (b) α3ΔN. The maps are contoured at 1σ, with 2FO–FC coefficients after two-fold
averaging. Each N-terminal tail of the α-subunits is drawn in a specific color. Asp9 of subunit α3 plays a key role in the stabilization of the closed state of the channel and is marked with a black arrow. Mutagenesis within this residue generates an axial channel (b) whose dimensions are comparable to the archaeal CP channels43.
Therefore, the properties of the mutant proteasome α3ΔN reflect the general properties of core particles in an open / semi-open channel state.
2.2 Proteasome activation
How previously described, excessive accumulation of the Ub-conjugates is observed in many pathological conditions such as Alzheimer, Parkinson and other neurodegenerative disorders. Accumulation of ubiquitinylated proteins in senescent cells may be caused by dysfunction of the proteasome or the ubiquitinating/ deubiquitinating machinery, or both44. For example, in the
10
human fibroblast model peptidase activities and levels of proteasome subunits decreased during replicative senescence45. Consequently, a partial proteasomes inhibition resulted in accelerated senescence in fibroblasts46; instead, an over expression of proteasome catalytic subunits helped the fibroblasts to overcome effects of cellular stressors47.
It has been shown that the involvement of the UPS in neurodegeneration is indisputable, but the exact role of this system in neurodegenerative diseases it's not known yet48.
For example, in Alzheimer’s disease a reduced proteasome activity is detected in the brain regions affected by Alzheimer and it was reported that oligomers of A(1-40) and A(1-42) significantly decreased all three proteolytic activities of the 20S proteasome in a dose-dependent manner49. Moreover, both A peptides are degraded by the proteasome in vitro. Therefore, the proteasome activity block causes an increase in the intracellular A level50.
It has been shown that also the paired, helical filaments of tau protein can impair the proteasome function, mostly in the areas crucial for long term memory formation50. Moreover, in vitro and in vivo studies confirmed that proteasome inhibition results in tau accumulation51.
Amyotrophic lateral sclerosis (ALS) is characterized by motor neurons degeneration resulting in a progressive paralysis, atrophy of devastated muscles and severe disability. In 5-10% of patients, the disease occurs in the familial form, in which mutated copper-zinc superoxide dismutase 1 (SOD1) forms aggregates52.
It was shown that with a pharmacological inhibition of the proteasome (with MG-132) the number of aggregates significantly increases53. In turn, the misfolded SOD1 mutant is able to arrest the proteasome activity, expecially in motoneuronal cells54. Recently it have been found that small pyrazolone molecules have the effect of activating the proteasome. The results presented provide strong evidence that the mode of action by which pyrazolone-containing compounds is through direct binding to constituent proteins of the 26S proteasome55.
11
Moreover, the literature reveals another one small molecule compound which have the effect of activating the proteasome. This compound acts by inhibiting USP14, a proteasome-associated deubiquitinating enzyme that can inhibit the processing of ubiquitin−protein complexes destined for degradation by the proteasome. Inhibition of USP14, in turn, results in proteasome activation56. Such activation may be of significance in the protection against cellular dysfunction typical for aging and neurodegeneration.
2.3 Proteasome inhibition
A large number of studies have demonstrated that proteasome inhibition may represent a promising therapeutic strategy in the treatment of malignancies57. Proteasome inhibition causes the accumulation of misfolded proteins and reactive oxygen species58,59,60,61 and, ultimately, the intensification of proapoptotic signals leading to cell-cycle interruption.62
Indeed, tumor cells divide and grow rapidly and this accelerated cell cycle needs to be managed by an increased capacity of the proteasome to degrade accumulating misfolded proteins. Therefore, proteasome inhibitors (PIs) mainly induce apoptosis in malignant cells, whereas healthy cells may better overcome this stress.63
Several compounds, both natural and synthetic, have been found to affect UPS functionality,64 and some proteasome inhibitors are already efficient anticancer drugs.
Bortezomib is the first proteasome inhibitor that it was approved for clinical use in human cancers.65 (Figure 6)
12
Figure 6: Bortezomib structure.
However, there are still many problems to be faced: i) relapse, as often cancer patients develop drug resistance, and ii) severe side effects. Accumulating evidence suggests that the challenge of developing new anti-cancer agents is to design molecules able to allow a finer regulation of proteasome and thereby potentially develop improved efficacy and safety profiles compared with Bortezomib.
In accordance with the hypothesis, the search of new molecules that may affect proteasome activity by binding outside of the active site may be regarded as a promising strategy; allosteric inhibition of proteasome may overcome resistance to competitive inhibitors, by a noncompetitive mechanism. There are already some promising molecules, such as chloroquine,66 5-amino-8-hydroxyquinoline (5AHQ), 67 and PR-39, an antimicrobial peptide found in pig intestine.68,69
In particular, experimental data suggest that PR-39 is a noncompetitive and reversible proteasome inhibitor.
Atomic force microscopy (AFM) studies demonstrate that 20S and 26S proteasome striated with PR39 or its derivatives exhibit serious perturbations in their structure and their normal allosteric movements69. This peptide binds to top of the antechamber and interferes with the CP-RP assembly preventing the formation of the mature 26S proteasome.
In fact, in AFM experiments, 26S complexes were typically found with one or two dragonhead-shaped 19S caps attached to the 20S core. After the treatment with PR39, they noticed a dramatic transition in the shape of the
13
molecules; an immediately lost features typical of the 26S complexes have been observed, giving the impression that two 19S caps almost touched each other with hardly recognizable 20S core69. Their hypothesis was that either the 19S caps partially dissociated or they vibrated too fast for recognition of 20S core and these findings fully correlate with the inhibition of 26S proteasome by PR39.
Despite the biochemical data collected so far for allosteric inhibitors are convincing, any advance of these results to the clinic treatment remains challenging and there is still an urgent need of novel compounds targeting the CP at regions distant from the active sites.
2.3.1 Enzymatic Inhibition Mechanisms.
Enzymes are attractive targets for drug therapy because of their essential roles in life processes. The function of enzymes is to accelerate the rates of reaction for specific chemical species. Substrate is a compound that became, thanks the enzyme action, a reaction products70. Chemical reaction, like enzymatic reaction, can be analyze by kinetic way for obtain information about reaction mechanism. The discussion above of enzyme reactions treated the formation of the initial ES complex as an isolated equilibrium that is followed by slower chemical steps of catalysis. This “rapid equilibrium”70 model was first proposed by Henri (1903) and independently by Michaelis and Menten (1913). However, in most laboratory studies of enzyme reactions the rapid equilibrium model does not hold; instead, enzyme reactions are studied under steady state conditions. The term steady state refers to a situation where the concentration of ES complex is held constant by a balance between the rate of ES formation70 (by association of the free enzyme and free substrate) and the rate of ES complex disappearance (through dissociation back to the free reactants and by forward progress to form products)70. The rate, or velocity, of an enzymatic reaction, measured either as the disappearance of substrate or the formation of product, is proportional to the concentration of ES complex as:
14
The condition of constant ES is experimentally achieved by having a large molar excess of substrate over enzyme concentration, so that there is a relatively constant pool of substrate available to bind of the free enzyme70.
The fundamental enzymatic equation is ”Michaelis-Menten equation”:
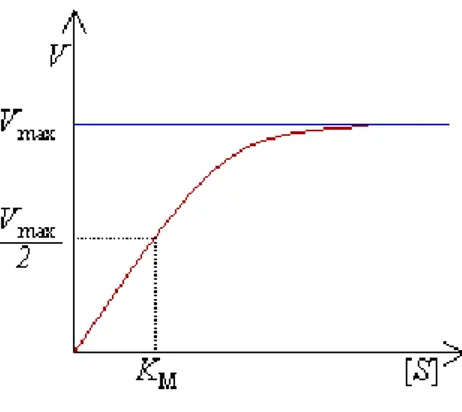
Vmax and KM can be obtained using plots where reaction velocity is in function
of substrate concentration (Figure 7).
Figure 7: Graph of reaction velocity in function of substrate concentration.
The term Vmax refers to the maximum velocity obtained at infinite substrate
concentration. KM is the substrate concentration that yields a velocity equal to
half of the maximum velocity.70
Stated another way, the KM is that concentration of substrate leading to half
saturation of the enzyme active sites under steady state conditions. This constant is specific for each emzyme-substrate complex and depends on temperature or pH70.
15
The term KM relates mainly to the dissociation reaction of the encounter
complex ES returning to E + S. Conversely, the reciprocal of KM (1/KM) relates to the association step of E and S to form ES70.
It’s possible show Michelis-Menten equation in other way:
It is possible obtain a double-reciprocal graph, where 1/V is in function of 1/[S] (Figure 8).
Figure 8: Double Reciprocal Graph.
This type of graph is useful for understand the inhibition mechanisms. Hence, like other protein ligand equilibrium, we can quantify such enzyme–inhibitor binary complexes such as an equilibrium dissociation constant (given the special symbol Ki for enzyme inhibition)70 (Figure 9a).
There are three types of inhibition mechanism: Competitive (A), Noncompetitive (B) and Uncompetitive (C)70 (Figure 9b).
16
(b)
Figure 9: a) Equilibrium scheme for enzyme turnover in the
presence and absence of reversible inhibitors. b) (A) Competitive
Inhibition; (B) Noncompetitive Inhibition; (C) Uncompetitive Inhibition70.
Competitive Inhibition
An inhibitor that binds exclusively to the free enzyme (i.e., for which α=∞) is said to be competitive because the binding of the inhibitor and the substrate to the enzyme are mutually exclusive; hence these inhibitors compete with the substrate for the pool of free enzyme molecules70.
The presence of a competitive inhibitor thus influences the steady state velocity equation as described by following equation:
17
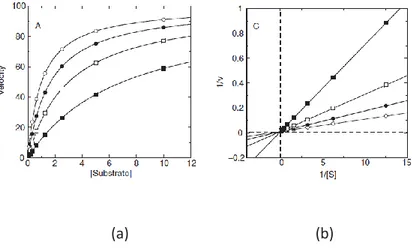
If we were to plot the velocity as a function of substrate at varying concentrations of a competitive inhibitor (Figure 10a) , we would obtain graphs such as those shown in Figure The value of Vmax is constant at all inhibitor
concentrations, but the apparent value of KM (defined as KM(1 + [I]/Ki))
increases with increasing inhibitor concentration.
The effects are perhaps most apparent in the double reciprocal plot (Figure 10b) where the intercept value (i.e., 1/Vmax) is constant but the slope (KM/Vmax)
and x-intercept (-1/KM) values of the line change with inhibitor concentration70.
(a) (b)
Figure 10: Substrate titration of steady state velocity for an enzyme
in the presence of a competitive inhibitor at varying concentrations.
(a) Untransformed data;(b) plotted in double reciprocal form70.
Because competitive inhibitors bind to the free enzyme to the exclusion of substrate binding, it is easy to assume that this results from a direct competition of the two ligands (substrate and inhibitor) for a common binding pocket (i.e., the active site) on the enzyme molecule. While this is very often the case, it is not a mechanistic necessity. Inhibitor and substrate could bind to separate sites on the enzyme molecule that somehow exert a negative regulation on one another (i.e., through negative allosteric interactions, driven
18
by ligand-induced conformational changes)70. This type of negative regulation via allosteric communication between separate binding sites on a protein is well represented in biology, especially in metabolic pathways, in the form of feedback regulation. Thus, one cannot assume that because an inhibitor displays the kinetic signature of a competitive inhibitor that it necessarily binds to the enzyme active site.
Non Competitive Inhibition
A noncompetitive inhibitor is one that displays binding affinity for both the free enzyme and the enzyme– substrate complex or subsequent species. In this situation the binding affinity cannot be defined by a single equilibrium dissociation constant; instead, we must define two dissociation constants, one for the binary enzyme–inhibitor complex (Ki) and one for the ternary ESI complex (αKi)70. When the constant is unity, the inhibitor displays equal affinity for both the free enzyme and the ES complex. When α>1, the inhibitor preferentially binds to the free enzyme, and when α<1, the inhibitor binds with greater affinity to the ES complex or subsequent species70.
Because noncompetitive inhibitors bind to both the free enzyme and the ES-complex, or subsequent species in the reaction pathway, we would expect these molecules to exert a kinetic effect on the E+S ES‡ process, thus effecting the apparent values of both Vmax/KM (influenced by both the Ki and
αKi terms) and Vmax (influenced by the αKi term)70. This is reflected in the
velocity equation for noncompetitive inhibition:
The equation can be simplified further in the specific case where the inhibitor displays equal affinity for both enzyme forms (i.e., where α = 1, therefore Ki = αKi):
19
The double reciprocal plot (for noncompetitive inhibitors) display a nest of lines that intersect at a point other than the y-axis. This is a diagnostic signature of noncompetitive inhibition70.
(a) (b)
Figure 11: Substrate titration of steady state velocity for an enzyme
in the presence of a noncompetitive inhibitor (α = 1) at varying concentrations. (a) Untransformed data; (b) plotted in double reciprocal form70.
The plot in Figure 11b was generated for an inhibitor with α = 1, for which the nest of line converge at the axis. When α>1, the lines intersect above the axis of a double reciprocal plot, and when α<1, the lines intersect below the x-axis70.
Uncompetitive Inhibition
An inhibitor that binds exclusively to the ES complex, or a subsequent species, with little or no affinity for the free enzyme is referred to as uncompetitive. Inhibitors of this modality require the prior formation of the ES complex for binding and inhibition70.
20
One might then expect that these inhibitors would exclusively affect the apparent value of Vmax and not influence the value of KM70. This, however, is
incorrect.
The velocity equation for uncompetitive inhibition is as follows:
Both Vmax and KM decrease with increasing concentration of an uncompetitive
inhibitor, and these effects are clearly seen in Figure 11a. In the double reciprocal plot for uncompetitive inhibition (Figure 12b) the diminution of the apparent Vmax is reflected in different y-intercept values for the different
concentrations of uncompetitive inhibitor70.
(a) (b)
Figure 12: Substrate titration of steady state velocity for an enzyme in the presence of an uncompetitive inhibitor at varying concentrations. (a) Untransformed data; (b) plotted in double
reciprocal form70.
Therefore, the diagnostic signature of uncompetitive inhibition is a double reciprocal plot composed of parallel lines.
21
2.4 AFM study on Proteasome 20S.
Many proteins exist in more than one conformational state and exist an intrinsic dynamics which regulate allosterically many enzymes71. Allosteric transitions are known for many enzymes and these transitions induce nanometer-scale movements. Atomic force microscopy (AFM) imaging performed in a tapping mode (in liquid environment) is a very effective technique for real-time analysis of single protein molecules without disturbing their natural dynamics in order to get information about conformational diversity, allosteric transitions, and their coupling. For this reason, single 20S proteasome molecule can be detected and studied by AFM27.
Here, a method that probes the conformational diversity and dynamics of 20S core particle using the AFM in liquid will be presented. Concerning the sample immobilization, the simplest and least invasive, is to let the particles electrostatically attach to the mica surface. Two different alignments of CP are possible. In the first case, the cylinder-shaped molecule is “standing” upright on its α ring (top view), allowing for direct observation of the gate status. In the second orientation, the particle is lying on its side (side view) and observation of the gate is not possible. To distinguish between these two orientations, it is necessary to measure the length (l) to width (w) ratio (l/w)72 (Figure 13). In all experiments with yeast and human proteasomes, it has been found that the top-view particles are prevalent (>90%)73.
Figure 13: Two different 20S proteasome orientations: “standing”
or in “lying”. AFM topographs of typical particles in top-view (“standing”; left ) and side-view (“lying”; right ) orientations. Sections of the topmost parts of the particles accompany the topographs27.
22
The particles (standing orientation) showed a cylinder diameter of about 8–12 nm and a cylinder length of 13–17 nm, which agreed well with crystallographic74 and electron microscopic data75.
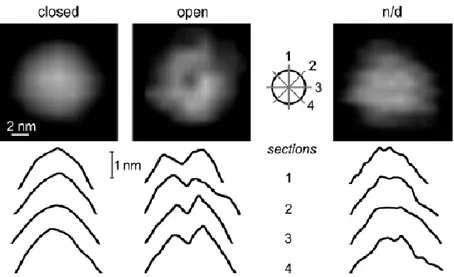
Usually, the top-view particles with a “smooth” alpha ring surface are considered to have a closed gate. Instead, if the alpha ring surface has the "crater-like" appearance, the gate is presumed open; more in detail: if sections of a molecule performed in four different directions were all cone shaped, the particle should be considered closed. If all four sections are crater shaped (with a dip or hole surrounded by a higher-positioned rim), the particle is classified as open (Figure 14)27.
Figure 14: The AFM images of yeast core proteasomes show two
stable conformations distinguishable by the shapes of sections through the topmost parts of their topographs. Left : the particle with a smooth and concave α face is classified as closed. Middle : the particle with a deep central opening in α face, prominent in all four sections, is labeled as open. Right: indistinguishable conformation - intermediate.27
It's possible to observe individual proteasomes to alternate between the open and closed states on the mica surface. Moreover, it was confirmed that approximately 25% of wild-type S. cerevisiae proteasomes imaged without addition of a ligand were in open state, instead, the 75% are in closed state (1:3 ratio)76. On the contrary, a ratio 3:1 of open-to-closed conformers has
23
been observed when a substrate is added for any of the three active centers. This allow to hypothesize that the catalytic act promoted channel opening 77. It was shown that inactivation of each active site specifically disrupts the shift toward the open channel conformation normally induced by a peptide substrate specific to that site33.
Moreover, certain proteasome inhibitors are able to generate a conformational switch.
In fact, the binding of bortezomib to the proteasome active center is able to generate an increase of open conformers in a dose-dependent manner (Figure
15).
Figure 15: Proteasomes trited with bortezomib, which is able to
induce the opening of the proteasome gate. The percentage of open particles (bars with white circles) increased with the increasing concentration of the inhibitor, while the ChT-L activity (white bars) decreased. Black bars represent means ± SD (n = 9 to 17 fields with 300 to 600 top-view particles). 33
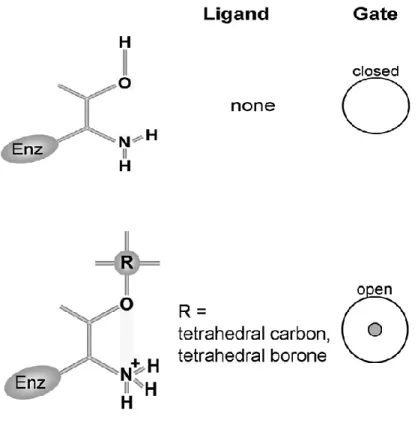
Boronic acid derivatives occupying the binding pocket, block directly the hydroxyl group and increasing the basicity of the catalytic amine in serine or threonine proteases (Figure 16).
24
Figure 16: The shift toward open gate is noted when the α amine is
blocked. Left column: Schematic representation of catalytic Thr1 without ligand an in presence of a ligand. Middle column: The ligand used. Right column: The prevailing conformation of the gate computed from AFM images33.
The stable, anionic covalent adduct formed by boronic acids closely mimics the transition-state tetrahedral complex created during peptide bond hydrolysis33. These results suggest that formation of a tetrahedral transition state during peptide bond cleavage, which is mimicked by the boronic acid adduct, is linked to the conformational shift from closed to open proteasomes33.
25
2.5 Porphyrins as proteasome’s inhibitors.
In oncology, porphyrins find extended application such as photosensitizers in photodynamic therapy (PDT) for their light-absorbing properties, and some of them were approved for the treatment of certain cancers, especially in the area of dermatology.
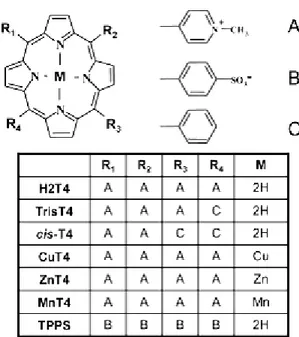
Szokalska et al. observations78 that demonstrated the cytotoxic effects caused by a porphyrinic photosensitizer, in PDT, could be potentiated through inhibition of proteasome, encouraged to scan the ability of porphyrins to inhibit the proteasome activity. Then in 2012 was published the first paper on the inhibition ability of cationic porphyrins on the proteasome 20S79. It was shown that micromolar amounts of porphyrins inhibiting, reversibly, all three main protease activities of the proteasome. In this first study was reported a screening including the tetra-cationic porphyrin (H2T4 - meso-tetrakis (4-N-methylpyridyl) porphyrin), the tetra-anionic porphyrin (H2TPPS - meso-tetrakis (4-sulphonatophenyl)-porphyrin) and tri and bi cationic substituents. (Figure
17)
Figure 17: Chemical structure of all the porphyrin derivatives used
26
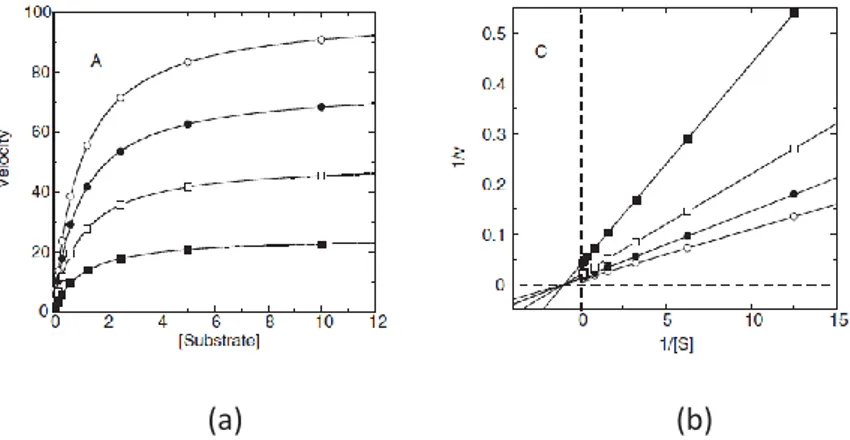
From the preliminary screening emerged the key rule that electrostatic effect is a driving force in the porphyin−proteasome interactions. In fact, any inhibition was observed in presence of the tetra anionic porphyrin (Figure 18a) and the inhibitory efficiency of the cationic macrocycles increase with the number of positive substituents (Figure 18b).
a b
Figure 18: a) Residual chymotryptic-like activity of 20S
proteasome in cell lysates in presence of H2TPPS and H2T4 at 1μM. Data are referred to control sample normalized to 100%. b) Residual chymotryptic-like activity of 20S proteasome in cell lysates with di-, tri- and tetra-cationic porphyrins at 1 μM. Data are related to control sample normalized to 100%79.
Furthermore investigating various metallo-derivatives (Figure 17), which differ to the different propension of the central metal ion toward axial coordination, results that the naked cationic porphyrins are the most active and the molecule should be flat in order to interact effectively with proteasome.
In particular, a regular increase of inhibition of proteasome activity is observed going from hexa-(MnT4) to penta-coordinated (ZnT4) to planar (CuT4) porphyrins suggesting that axially coordinated water molecules get in the way of porphyrin−proteasome interactions (Figure 19).
27
Figure 19: Residual chymotryptic-like activity of 20S proteasome
in cell lysates with different metalated porphyrins (MnT4, ZnT4, and CuT4) at 1 μM. Data are referred to control sample normalized to 10079.
These experiments, as the previous, underline the major activity of H2T4 with respect to all the other porphyrins.
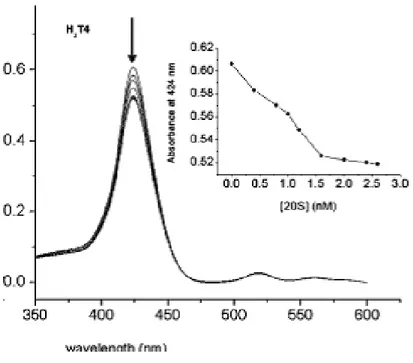
A spectroscopic characterization of porphyrin−proteasome interactions by UV−vis spectra opened another prospective, identifying in porphyrins the new molecular “probes” .
Figure 20: UV−vis titration of 4 μM H2T4 with increasing amounts
of 20S proteasome. The insert reports a plot of the hypochromic effect vs proteasome concentration79.
28
The ChT-L activity of the proteasome is mostly probed to evaluate proteasomal activity; in fact, previous reports suggesting that the chymotryptic substrate is the most proteasome-specific of those examined80(Figure 21).
Figure 21: Concentration−response plot of H2T4 for
Chymotryptic-like, Caspase-Chymotryptic-like, and Tryptic-like residual activities on 20S from cell lysates 79.
Moreover, it's known that uncontrolled heme exposure can cause acute kidney injury and endothelial cell damage81. Heme-triggered cell damage have been explored previously, with a focus on oxidative processes that can be catalyzed by free heme as well as on the activation of innate immunity receptors by the porphyrin.82
In addition to redox reactivity, heme may adversely alter cellular functions by binding to essential proteins and impairing their function.83
It was shown that high levels of intracellular heme disrupt cellular homeostasis by the combined activities of proteasome inhibition and oxidative damage83. In fact, in states of intracellular heme, excess proteasome inhibition acts in concert with the pro-oxidant activity of the iron protoporphyrin, resulting in the accumulation of damaged proteins that contribute to the triggering of cell death.83
These results encouraged us to continue the studies on this class of compounds.
29
Chapter 3 -Experimental Session
3.1 Materials and Methods
3.1.1 Chemicals
Purified human 20S proteasome was purchased from Boston Biochem (Cambridge, MA, USA) and Enzo Life Sciences Inc. (Farmingdale, NY, USA). The fluorogenic substrates specific for the chymotriptic-like (ChT-L) proteasome activity (Suc-LLVY-AMC) and caspase-like (CP-L) proteasome activity (Z-LLE-AMC) were purchased from Boston Biochem (Cambridge, MA, USA).The T-L (Ac-RLR-AMC) substrate was purchased from Enzo Life Sciences Inc. (Farmingdale, NY, USA).
Muscovite mica in sheets was purchased from Ted Pella Inc. (Redding, CA, USA) Atomic force microscope (Multimode Nanoscope III a, Bruker; software version 5.1) equipped with a scanner suitable for nanometer/ micrometer-scale work ( scanner E for Nanoscope III a) has been used. NP-ST oxide-sharpened silicon nitride probes (“tips”) suitable for tapping (oscillating) mode in liquid were purchased from Bruker.
The meso-tetrakis(4-N-methylpyridyl) porphyrin (H2T4), meso-tetra(2-N-metil-pyridyl) porphyrin (ortho-H2T4), meso-tetra(3-N-metil-meso-tetra(2-N-metil-pyridyl) porphyrin (meta-H2T4), the monophenyl-tri-(N-methyl-4-pyridyl)-porphyrin (tris-T4), and the meso-tetrakis(4-sulphonatophenyl)-porphyrin (H2TPPS) were purchased from Midcentury. The meso-tetrakis [4-(4-N-methylpyridyl)-Phenyl]porphyrin (pTMPyPP) and the meso-tri(N-methylpyridyl) corrole (TMPC) were synthesized by Prof. Paolesse (Tor Vergata University, Rome) and coworkers. Phthalocyanine derivate (FBPcG1) was synthesized by Prof. T. Torres (Universidad Autónoma de Madrid). The 5-(4-carboxyphenyl)- 10,15,20-tris(Nmethylpyridinium)porphyrin- apidecin (MTPyP-api) was synthesized by Prof. M. Gobbo and coworkers (Padova’s University). The meso
(N-tetradecyl-30
4-pyridyl) porphine (TMPyP4-C14) was obtained from Frontier Scientific Inc, Logan, UT, U.S.A (Figure 23).
a) b) c) d) e) f) N+ NH N N+ C H3 N N+ C H3 N H N + CH3 C H3 NH N N NH CH3 CH3 CH3 C H3 SO3 2-SO3 2-SO3 2-SO3 2-N+ NH N N+ N N+ N H N+ CH3 CH3 CH3 CH3 N+ NH N N+ N N+ N H N+ C H3 C H3 CH3 CH3 N+ NH N N+ C H3 N N H N + CH3 C H3 N+ C H3 N+ C H3 NH N N NH N+CH3 N+ C H3
31 g) h) i) NH N N H N+ N+ N H N+ CH3 C H3 C H3 O O O O N H N N N N N N H N O O O O O O O O O O C H3 C H3 O O O O O O O O CH3 C H3 O O O C H3 O O O O CH3 O O O C H3 CH3 N+ NH N N+ CH3 N N+ N H N+ C H3 CH3 CH3 12
32 l)
Figure 23: a) meso-tetrakis(4-N-methylpyridyl) porphyrin (H2T4);
b) tetra(2-N-metil-pyridyl) porphyrin (ortho-H2T4), c) meso-tetra(3-N-metil-pyridyl) porphyrin (meta-H2T4), d) meso-tetrakis (4-sulphonatophenyl)-porphyrin (H2TPPS), e) monophenyl-tri-(N-methyl-4-pyridyl)-porphyrin (tris-T4), f) meso-tri (N-methylpyridyl) corrole (TMPC); g) meso-tetrakis [4-(4-N-methylpyridyl)-Phenyl]porphyrin (pTMPyPP); h) Phthalocyanine derivate (FBPcG1); i) meso (N-tetradecyl-4-pyridyl) porphine
(TMPyP4-C14), l) 5-(4-carboxyphenyl)- 10,15,20-tris (Nmethylpyridinium)
porphyrin- apidecin (MTPyP-api).
Natural compounds derivatives was synthesized by Prof. Tingali and coworkers (Catania’s University) (Figure 24).
Figure 24: Structure of derivatives of natural compounds.
N+ NH N N+ C H3 N N+ C H3 N H C H3 R O NH O R3 R4 R5 R2 R1 R
CT-E14= R: H, R1: OH, R2: OMe, R3:
H, R4: Me, R5: H
CT-E15= R: H, R1: OMe, R2: OMe,
R3: H, R4: Me, R5: H
CT-E12= R: H, R1: OH, R2: OH, R3: H,
R4: Me, R5: H
CT-E16= R: H, R1: Me, R2: H, R3:
OMe, R4: OMe, R5: OMe
CT-E21= R: OMe, R1: OH, R2: OMe,
R3: OMe, R4: OMe, R5: OMe
CT-E23= R: H, R1: OH, R2: H, R3: H,
R4: Me, R5: H
CT-E24= R: H, R1: OH, R2: H, R3:
OMe, R4: OMe, R5: OMe R = Gly-Asn-Asn-Arg-Pro- Val-Tyr-Ile-Pro-Gln-Pro-Arg-Pro-Pro-His(CH3 )-Pro-Arg-Leu-OH
33
MCF7 cells were purchased from SIGMA. Proteasome-GloTMCell Based Assay was purchased from PROMEGA.
3.1.2 Proteasome activity assays
The assays were performed in vitro using purified 20S proteasome, with the activity of each subunit of the proteasome (2 nM) assessed upon incubation in assay buffer (Buffer: HEPES 25mM, EDTA 0,5mM pH=7.6) for 30 min at 37 °C with increasing concentrations (0.5 - 10 μM for porphyrin and porphyrinoid compound and 1-10 μM for natural compounds derivates) of inhibitor and subsequently added to the AMC-labeled substrate peptide (100 µM).
The activity assays for yWT20S CP and its mutant α3ΔN were performed in buffer 100 mM Tris/HCl pH 8 and NaCl 6 mM.
Proteasome activity is monitored by measuring AMC fluorescence at 440 nm (excitation at 360 nm) for 20 min, using a fluorescence plate reader (Multiskan, Thermo) in 384 multiwell black plate. A minimum of three replicates were performed for each data point. Fluorescent substrate cleavage by the 20S proteasome was linear during this incubation time frame. The slope of the emission of AMC at 440 nm increases with time and it is correlated to proteasome activity (Figure 25); black line is a control (non inhibited 20S),instead other lines are 20S with increasing quantity of inhibitor (e.g. H2T4 - line red, green, blu and light-blue).
Decreasing slopes are proportional at H2T4 (inhibitor) concentration, and indicate that there is a fluorophore (AMC) decreasing.
34
Figure 25: Fluorescense intensity at 440 nm vs time; each line
indicate a specific inhibitor (i.e. H2T4) concentration, from 0 (black line) to 3 μM (light-blue line).
Data are expressed as normalized percentages of residual activity considering the slope of the control (fluorogenic peptide/proteasome in the absence of inhibitors) as 100% of proteasome activity.
Dose-response plots of the residual proteasome activity, in presence of increasing inhibitor concentration, provide a quantitative estimate of its potency.
The calculated residual activities were plotted against the logarithm of the applied inhibitor concentration and fitted to the equation
v(%) =100 × IC50 I
[ ]+ IC50=
100 1+10(log[ I ]-log IC50)
; GraphPad Prism 5 software was used.
The IC50 is defined as the concentration of the inhibitor, which causes 50%
reduction of activity and it is thus calculated from the x-axis value of the dose−response plot occurring at a fractional activity of 50%.
6 12 18 24 20 40 60 80 CTRL H 2T4 0,5 M H2T4 0,75 M H2T4 1M H2T4 3 M In te n si ty (A. U .) Time (min)
35 3.1.3 Kinetic assays (Inhibition Mechanism)
Proteasome activity assays were performed in vitro by mixing 20S proteasome (2nM) with different concentrations of an AMC-labeled substrate peptide (i.e., Suc-LLVY-AMC) in the assay buffer (Buffer: HEPES 25 mM, EDTA 0,5mM pH=7.6) at 37 °C, monitoring the released AMC fluorescence at 440 nm (excitation at 360nm) for 20 min, using a fluorescence plate reader (Multiskan, Thermo) in a 384 multiwell black plate. A minimum of three replicates was performed for each data point. The slope of the emission of AMC at 440 nm increases with time and it is correlated to proteasome activity (see below). Data have been analyzed by a double reciprocal Lineweaver-Burk plot and using Michelis Menten model (GraphPad Prism 5).
3.1.4 Wild Type proteasome purification from yeast
Yeast blocks of S.cerevisiae were dissolved in Lysis Buffer (LysB) (50mM potassium phosphate, pH 7,5,). A spatula of DNAse is added and stirred for 15 min. The yeast cells were lysed in a French press using a pressure of 2,400 psi. Cell debris was removed by centrifugation at 6X140 g for 30 min. The supernatant was transferred to a 500-ml beaker and 30% saturated Ammonium Sulphate was added. The lysate mixture was filtered to remove fatty acid and lipid84.
Phenyl-Sepharose TM 6 Fast Flow: Flow rate for this column was maintained at
5ml /min. Column was equilibrated with two-column volumes of Buffer A (20mM potassium phosphate, pH 7,5 and 1M (NH4)2SO4).
Lysate mixture was added to the equilibrated chromatographic column which after was washed with 1-3 column volumes of Buffer B (20mM potassium phosphate, pH 7,5). Protein elution was performed at linear gradient using 0-100% of Buffer A to Buffer B in four-column volumes84. The eluate was
36
collected in 12mL fractions. Column was washed with one-column volume of Buffer B.
Fractions collected were tested for proteasome activity through a fluorogenic assay. In fact, 29µl of each fraction was pipetted into a well of 96 well plates (Fluoro Nunc). One microliter of 10nM Y-substrate was added to each well and incubated for 30’ at 37° C. Fluorescence was measured. The selected fraction were pulled and applied to the following column.
Before to start with second chromatographic process, the Ammonium Sulphate was removed by dialysis (three times)84.
Hydroxyapatite Column: The flow rate was maintained at 4ml/min. Column was
equilibrated with 20mM Potassium Phosphate pH 7,5 Buffer A. Mixture was added to the column which was washed with Buffer A. Protein elution was performed at a linear gradient of 0-50% of Buffer A to Buffer B (130mM of Potassium Phosphate, pH 7,5)84. The eluate was collected in 5mL fractions. Column was washed with one-column volume of 100% Buffer B. Fractions collected were tested for proteasome activity through a fluorogenic assay as above84.
Resource Q column: The flow rate was maintained at 2ml/min. Column was
equilibrtated with two-column volumes of Buffer A (20mM Tris/HCl pH 7,5). Combined fractions are added to the equilibrated column which after was washed with 1-3 column volumes of Buffer A84. Protein elution was performed at linear gradient of 0-50% of Buffer A to Buffer B (20mM Tris/HCl, pH 7,5 with 1M NaCl) in ten-column volumes. One milliliter fraction was collected and a fraction analysis was carried out according to previous described procedure (Fluorescence assay).
An SDS-PAGE was performed for the active fractions17.
HiPrepTM 26/10 Desalting Column: The flow rate was maintained at 2ml/min.
Column was equilibrated with two-column volumes desalting buffer (DS: 20mM Tris/HCl pH 7,5 with 1M NaCl). Combined fraction were added to the
37
equilibrated column and one microliter fractions were collected. Column was washed with DS and an SDS-PAGE analysis was performed.
Proteasome will be stored at 4°C and avoid proteasome freezing84.
3.1.5 α3ΔN (mutant proteasome) sample preparation from yeast.
The α3ΔN mutant was generated in previous experiments by the plasmid shuffle procedure85. Mutant yeast strains were grown in 18 I YPD (yeast extract peptone dextrose) cultures for 2 days at 30°C. Cells were harvested by centrifugation for 15 min at 5,000g and frozen at -20°C. These will be used as start sample for a new proteasome purification.
3.1.6 Atomic Force Mycroscopy (AFM) experiments
20S proteasomes (Enzo, Calbiochem) and buffer for proteasome dilution and imaging (50 mM Tris–HCl - pH 7) have been used for the AFM experiments. These experiment have been carried out using an Atomic Force Microscope with the tapping mode in liquid capability how reported in literature27.
More in detail, proteasomes (3 μL), diluted to a concentration of about 5 nM (in such concentration an image of dispersed particles on mica should be produced), have been immobilized on a surface of mica. After about 2 min the chamber surface has been covered by a buffer droplet of 30 μL. The disk attached with the mica surface was positioned the in the microscope head, taking care not to spill the droplet. Afterwards, the chamber was positioned in the AFM head way above the sample. After the alignment of the laser with the tip, a nominal spring constant of 0.32 N/m has been used for these experiments. A field size at 1 mm × 1 mm in the Nanoscope software was choose and usually the excitation frequency was set between 9 and 10 kHz, slightly below the peak resonant frequency.
38
The drive voltage was set at 200–500 mV and the set point ranges from 1.4 to 1.8 V. Instead, a typical speed of scanning was set in the 2–3 Hz range27.
After the first scan or two, it should be better verify if the quality of the image and the imaged sample is acceptable or if further adjustments or changes are needed (scan conditions, probe, protein density in the sample, or protein/buffer purity). As soon as the image is acceptable, the scanning session can proceed even for an hour with the same sample and tip.
3.1.7 Circular Dichroism (CD) - melting experiments
Far-UV CD spectra of h20S, yWT 20S CP and its mutant α3ΔN were recorded at 0.025uM of enzyme with a Jasco J-810 spectropolarimeter equipped with a Peltier thermally controlled cuvette holder (JASCO PTC-348). All measurements were performed at 25 °C unless specified. CD spectra were recorded using a 0.1-cm path length quartz cuvette, from 260 to 190 nm, at 0.1 nm data pitch, 50 nm/min, with a response time of 2s. All spectra, corresponding to an average of 10 scans, were base-line-corrected by subtracting the signal of the buffer from the CD of the sample. CD curves were recorded in 100 mM Tris/HCl pH 7.5 and NaCl 150 mM (this buffer condition stabilizes the closed conformation).
The thermally-induced unfolding of proteasome was studied by monitoring the CD signal at 222 nm upon increasing the temperature from 20 to 80 °C (heating rate = 0.5 °C/min). The melting temperatures were calculated from fitting the normalized CD 222 nm signals by a sigmoidal curve.
3.1.8 Cell Culture
Human MCF-7 breast cancer cell lines were cultured in Eagle's Minimum Essential Medium (EMEM) additioned with: 2mM Glutamine, 1% Non Essential Amino Acids and 10% Fetal Bovine Serum (FBS/FCS), 1% PenStrep. This cell line
39
grew attached to plastic as a monolayer in an atmosphere of 5% CO2 and 95%
air at 37 °C and 100% humidity.
3.1.9 Proteasome-GloTM Cell Based Assay
In Proteasome-GloTM assay fluorogenic substrates of chymotrypsin-like active site is replaced with the luminogenic substrates Suc-LLVY-aminoluciferin (aLuc). Its cleavage by the site of the proteasome liberates aminoluciferin, which is a substrate of luciferase. Proteasome-Glo assay has allowed us to reduce the amount of cells needed to perform a single time-point measurement of all three activities by approximately 20-fold, largely because of superior sensitivity of luminescent detection over fluorescent detection.
The chymotrypsin-like proteolytic activity of the proteasome in intact MCF7 cells was determined according to manufacturer's instructions. Briefly, 800 cells/well were cultivated in 384 sterile multiwells (optical plate and white walls) in 50ul of DMEM+FBS10% + penStrep.
After cell seeding (6 h) porphyrins and porphirinoids were added in cell medium at 10µM concentration for 24h; and in positive control sample Bortezomib (1µM=IC50) was added.
The substrate for the ChT-L activity (Suc-LLVY-aminoluciferin) was dissolved in Proteasome-Glo™ Cell-Based Reagent and added to intact cells (1/1 vol). After 2 min of shaking for permeabilization and further 10 min of incubation, luminescence was measured with a luminometer (Varioskan Flash ,Thermo).
3.1.10 MTT Assay
To determine cell viability the colorimetric MTT (3-(4,5-Dimethylthiazol-2-yl)-2,5-Diphenyltetrazolium Bromide)) metabolic activity assay was used; the cells were seeded in a 96-well plate at a density of 5 × 10³ cells/well and exposed to varying concentrations of porphyrins in the dark for 48 h. Cells treated with only cell medium were used as control sample. After removing the supernatant
40
of each well and washing twice by PBS, 20 µl of MTT solution (5 mg ml-1 in PBS) and 100 µl of medium was introduced. After incubation for another 4 h, the resultant formazan crystals were dissolved in dimethyl sulfoxide (200 µl) and the absorbance intensity measured by a microplate reader (Varioskan Flash) at 570 nm. All experiments were performed in quadruplicate, and the relative cell viability (%) was expressed as a percentage relative to the untreated control cells.
41
Chapter 4 -Studies on interaction between cationic
porphyrins ( H2T4 and its isomeric forms) and 20S
proteasome
4.1 Goal of this study
Starting from the evidences reported on paper (JACS 2012)79
evidencing the antiproteasome potential of cationic porphyrins, the successive goal has been to elucidate the molecular mechanism on the basis of this activity, investigating the structure-function relationship.
Then a combined multidisciplinary approach (enzymatic assays, UV stopped flow, NMR experiments and computational approaches) has been adopted to inspect the proteasome inhibition by H2T4 and his two isomers, ortho-H2T4 and meta-H2T4.
4.2 Inhibition potency of H2T4 and his isomers on purified
proteasome 20S
In the first step, all three proteolitic activities (ChT-L, T-L and CP-L) have been studied on purified 20S samples, instead that in lysates, in order to avoid eventual interaction with possible contaminant in the cell extracts.
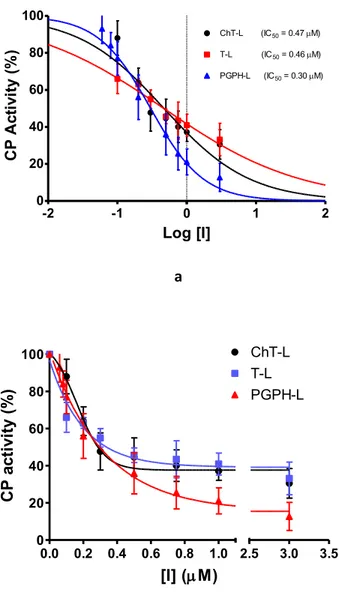
The experiments confirm that H2T4 is a good and specific proteasome 20S inhibitor, both for ChT-L activity, T-L and CP-L activity (Figure 26).
42
a
b
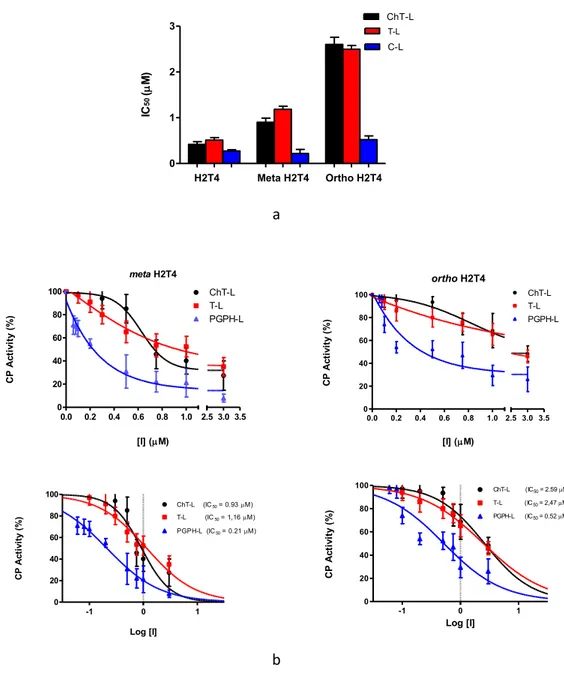
Figure 26: a) Semi-log plot of the residual CP activities of H2T4 as
a function of inhibitor concentration. b) Normalized concentration-response plot for H2T4-mediated inhibition of ChT-L, T-L and PGPH-L residual activities of 20S proteasome86.
Moreover, to better understand the effect of the positive charges's spatial distribution on the porphyrins's activity, we compared the IC50 values of H2T4 with those of the ortho-H2T4 and meta-H2T4 isomeric forms (Figure 27). A dose–response plots of the residual proteasome activity in presence of increasing concentration of porphyrin it's shown below.
The IC50 indicate the concentration of the inhibitor which causes 50% reduction of activity and it is thus calculated from the x-axis value of the dose–
-2 -1 0 1 2 0 20 40 60 80 100 ChT-L (IC50 = 0.47M) T-L (IC50 = 0.46M) PGPH-L (IC50 = 0.30M) Log [I] CP A ct iv it y (% ) 0.0 0.2 0.4 0.6 0.8 1.0 0 20 40 60 80 100 2.5 3.0 3.5 ChT-L T-L PGPH-L [I] (M) C P ac ti vi ty (% )
43
response plot occurring at a fractional activity of 50%. The estimation of the IC50 is based on a nonlinear fit with the equation86
The IC50 values and their standard errors were deduced from the fitting.
a
b
Figure 27: a) Comparison of the IC50 values of H2T4 –
para-tetra(4-Nmethyil-pyridyl) porphyrin-, meta-H2T4 – meso-tetra(3-N-methyilpyridyl) porphyrin – and ortho-H2T4 – meso-tetra(2-N-methyil-pyridyl) porphyrin – determined for the ChT-L (black), T-L (red) and PGPH-L (blue) peptidase activities of the CP.
b) semi-log plots of residual CP activities of meta-H2T4 (left) and otho-H2T4 (right).86 H2T4 Meta H2T4 Ortho H2T4 0 1 2 3 ChT-LT-L C-L IC 50 ( M) meta H2T4 0.0 0.2 0.4 0.6 0.8 1.0 0 20 40 60 80 100 2.5 3.0 3.5 ChT-L T-L PGPH-L [I] (M) C P A ct iv it y (% ) ortho H2T4 0.0 0.2 0.4 0.6 0.8 1.0 0 20 40 60 80 100 2.5 3.0 3.5 ChT-L T-L PGPH-L [I] (M) C P A ct iv it y (% ) -1 0 1 0 20 40 60 80 100 ChT-L (IC50 = 0.93M) T-L (IC50 = 1,16M) PGPH-L (IC50 = 0.21M) Log [I] C P A ct iv it y (% ) -1 0 1 0 20 40 60 80 100 ChT-L (IC 50 = 2.59M) T-L (IC50 = 2,47M) PGPH-L (IC50 = 0.52M) Log [I] C P A ct iv it y (% )
44
Curve fitting parameters are reported in Table 1.
Table 1: Data fitting relative to the evaluation of the IC50 values of
H2T4 and its meta- and ortho- variants for all three CP peptidase activity86.
From these experiments, it is clear that also the charge position is fundamental for obtain an optimal effect; in fact H2T4 is a better proteasome inhibitor than
orto-H2T4 and meta-H2T4.
Even if the charge distance between these two different isomeric forms is only of few angstroms, this difference it is enough to influence the recognition phenomena between porphyrin and proteasome86.
Fitting parameters ChT-L activity T-L activity PGPH-L activity H2T4 Best-fit values IC50 0.4692 0.4667 0.3016 95% Confidence Intervals IC50 0.2737 to 0.8043 0.3634 to 0.5993 0.249 to 0.3653 R² 0.8348 0.9583 0.9829 Meta-H2T4 Best-fit values IC50 0.9310 1.159 0.2113 95% Confidence Intervals IC50 0.4658 to 1.861 0.8074 to1.664 0.1840 to0.2427 R² 0.8187 0.9401 0.9900 Ortho-H2T4 Best-fitvalues IC50 2.592 2.476 0.5190 95% Confidence Intervals IC50 1.584 to 4.242 1.864 to 3.289 0.2905 to 0.9271 R² 0.9362 0.9813 0.8634
45
4.3 NMR analysis of H2T4/proteasome complexes
In collaboration with the research group of Prof. R. Fattorusso ( Seconda Università di Napoli) and Dott.ssa D. Diana ( CNR - IBB Napoli) (they and co-workers planed and performed the follows experiments), in order to identify the functional groups involved in the H2T4-CP interaction, a set of NMR experiments, such as Saturation Transfer Difference (STD), have been performed.
Initially, the structure of the ligand dissolved in the buffer (Buffer: 20 mM Tris– HCl, pH 7.6, 150 mM NaCl) has been analyzed by 1H NMR spectroscopy. In particular, H2T4 1H chemical shift assignment has been obtained as it follows: 9.09 (8H, s, broad, Hpyr) 9.27 (8H, d, methylpyridine-Hm), 8.89 (8H, d, N-methylpyridine-Ho), 3.69 (12H, s, N-methylpyridine- CH3). After, 860 nM of 20S proteasome has been added to 172 mM of H2T4 (protein : ligand ratio of 1 : 200)85. It was shown that the 1H H2T4 chemical shifts in presence of proteasome 20S don't significantly change upon the addition of 20S proteasome, except for the pyrrole ring resonances, which display shifts downfield (from 9.10 to 9.14 ppm) (Figures 28a and 28b and Figures 28a’ and
28b’); on the other hand, H2T4 resonances experience an overall soft line
broadening86.
Both effects, line broadening and chemical shift perturbations, confirmed the binding between H2T4 and proteasome. To structurally characterize the H2T4– 20S proteasome interaction, they apply STD (Saturation Transfer Difference) NMR spectroscopy assay87.