Coen, D., Guidi, M., Yordanova, N., & Héritier, A. (2020). The logic of regulatory venue shopping: a firm's perspective. PUBLIC POLICY AND ADMINISTRATION.
This is the peer reviewd version of the followng article:
The logic of regulatory venue shopping: a firm's perspective
Published:
DOI:10.1177/0952076718814900
Terms of use:
Open Access
(Article begins on next page)
The terms and conditions for the reuse of this version of the manuscript are specified in the publishing policy. Works made available under a Creative Commons license can be used according to the terms and conditions of said license. For all terms of use and more information see the publisher's website.
Availability:
This version is available http://hdl.handle.net/11365/1070362 since 2020-04-08T15:42:22Z
The logic of regulatory venue shopping:
a firm’s perspective
David Coen
University College London
Mattia Guidi Scuola Normale Superiore Nikoleta Yordanova
University of Mannheim
Adrienne Héritier European University Institute
Accepted for publication in Public Policy and Administration, 18 October 2018
Abstract
Drawing on an original and unprecedented survey data set of 243 medium- and big-sized firms operating in five sectors(energy, telecommunications, railways, airlines, and postal services) and across 29 European countries, we analyse what incentivizes firms to interact with and influence multiple regulators. In so doing, we map the regulatory op-portunity structure and scrutinize firms’venue shopping logics. The study shows that firms can clearly identify where the locus of political and regulatory competence lies and that they concentrate their activities at this level. In particular, the data shows that the national level is still the most important target level for regulatory representation. Regulatory venue shopping, the study illustrates, occurs when issues are highly salient, highly technical and when high stakes are involved. Notably, we show that firms tend to address more regulat-ors in sectregulat-ors characterized by higher international competitiveness to mitigate uncertainty when operating in multiple markets and facing rivalry from international competitors.
1
Introduction
Over recent decades, many regulatory agencies have been created in order to facilitate the integ-ration of markets across national borders and correct market failures. A large body of literature analyses the emergence, institutional design and functioning of these independent regulatory au-thorities (Gilardi 2008; Jordana and Levi-Faur 2004; Levi-Faur 2005; Guardiancich and Guidi 2016). How firms navigate this new complex landscape of regulatory agencies or what logic drives their activity remains unclear despite its potential implications for regulatory decisions and outcomes. Which level (national, supranational) prevails? Do firms normally address mul-tiple regulators? Which sectoral, firm-specific, or issue-specific factors lead them to diversify regulatory venues? Answering these questions is important to learn how firms use the current regulatory landscape, if this is consistent and useful to them, and if there are risks of an op-portunistic use of this variety of venues: do firm choose regulators depending on the kind of outcome they expect? Do they play regulators against each other?
Given multiple regulators, and the often cited risk of business venue shopping, it is surprising how few empirical studies of business regulatory activity or models of business political logics exist. In this paper, we explore why firms interact with specific regulators drawing on the theories of venue shopping and regulatory governance. More specifically, we map the regulatory opportunity structure available to business by assessing the multiple levels at which business operates and scrutinize firms’ motives to interact with particular regulators. For the purpose, we build on and add to the broader theoretical literature on venue-shopping by applying it to study firms’ choices of regulators in a multi-level regulatory setting. Indeed, venue shopping has so far been generally conceptualized as an activity linked to policy-making, not to regulation, and most research in the public policy and political science literature has focused on venue-shopping carried out by interest groups, lobbyists, or NGOs rather than individual businesses (Buffardi et al. 2015, Jourdain et al. 2017, Binderkrantz et al. 2015, Halpin and Fraussen 2017). To assess this, we build a regulatory venue shopping model based on the perceived economic and political costs and benefits of regulatory interaction. We assume that firms are strategic political actors and economic maximizers with incomplete information on regulators’
prefer-ences and the outcomes of potential regulatory decisions, playing multiple horizontal (sectoral and cross-sectoral regualtors) and vertical (national, European and international) venues to ob-tain the best outcome. Subsequently, we hypothesize that firms’ activity, or their venue shopping behaviour, is driven by the technical complexity, the saliency and the expected economic costs of regulatory decisions. We test our hypotheses using original survey data on 243 big and me-dium sized firms in five sectors (energy, telecom, railway, postal services and airlines) across 29 European countries. Focussing on network firms allows us to study sectors in which regulatory decisions and interactions are regular and frequent, and, therefore, in which regulatory venue shopping is most likely to occur. Our results indicate that uncertainty is the main driver of reg-ulatory venue shopping, and that firms “use” regulators to acquire information that minimizes their expected costs.
2
Theoretical framework
2.1 The rationale of regulatory venue shopping: opportunities
This article seeks to explore firms’ motives for dealing with particular regulators when confron-ted with multiple sectoral and cross-sectoral regulators at the national, European and interna-tional levels. A vast body of political science literature using principal-agent theory deals with the conditions of delegation to independent regulatory authorities (Miller 2005). Consequently, we know a great deal about the motives underlying delegation, such as the need for expertise and lack of capacity, political uncertainty, political credibility and blame shifting. However, this focus on delegation has been at the expense of exploring the firms’ motivation for engaging with regulators after delegation. Unfortunately, there is far less empirical or theoretical work exploring firms’ perceptions of regulatory authorities or how firms navigate the complex, mul-tiple regulatory venues at the national, EU and international levels. In fact business-government studies have tended to focus on the structural power of business in the political system at the expense of developing micro-political theories of the firm. In filling this gap we map out the opportunity structure of firms’ horizontal and vertical regulatory activity, exploring how far
competence, capacity and expertise, saliency and economic costs influence the behaviour of business in selecting a regulator if they can choose among regulators. Having identified the levels and potential interactions, we explore the actual phenomena of regulatory venue shop-ping.
In the case of intensely regulated sectors such as energy, telecommunications, railways, airlines, and postal services, there has been an explosion of horizontal delegations to new national sec-torial regulatory authorities (NRAs) with potentially overlapping competencies with national cross sectoral competition authorities and national ministries in the 1990s (Levi-Faur 2005, Gilardi 2008, Coen and Héritier 2005). This has also coincided with the emergence of poten-tial vertical venue shopping opportunities at the EU level, with delegation of authority for the single market to the European Commission (Prince and Kerremans 2008, Thatcher 2007), and the increasing primacy of EU competition policy (Cini and McGowan 2009). The level of venue shopping complexity, however, increased dramatically with the potential “double delegation” to European Networks of Regulators and the emergence of European regulatory authorities (Coen and Thatcher 2008, Maggetti and Gilardi 2011).
The situation is no less complex at the international level, with the emergence of global gov-ernance and regulatory networks (Slaughter 2004). With the recent global crises in climate, and financial markets, there has been a recognition of the concept of global public goods and an in-creasing willingness of nation states to delegate to international bodies (Bachman and Newman 2014), increased co-ordination of international organizations (Abbott and Snidal 2009; Abbott et al. 2015, De Bièvre et al. 2014, Jupille et al. 2011) and acceptance of business self-regulation (Mattli and Buthe 2003).
Under these increased complexities, what motivates and incentivises firms to play different venues? This paper is interested in how these new capacities and authorities are reflected in a firm’s decision to address a particular regulator or, indeed, several regulators in the evolving multilevel regulatory environment.
2.2 The rationale of regulator/regulatee interaction
In assessing the question “under which conditions do we encounter ‘regulatory venue shop-ping’?” the broader literature linking policy-making and lobbying identifies several possible answers. First, the logic of national level venue shopping has often been described as a process of “trial and error”, where lobbyist/regulatees learn to manage the policy process, reinforcing messages or regrouping to block policy debates that they have lost in new venues (Baumgartner and Jones 1993, Constantelos 2010, Pralle 2003). Thus, for some interests venue shopping is an insurance policy to positively reinforce policy wins and navigate regulation along the policy cycle (Brasher and Lowery 2006), but for others it is a veto playing activity where change or blockage is the objective (Baumgartner et al 2013). How successful business actors are in choosing the venue(s) that would bring them most favourable outcome is often a function of the resources mobilised and experience they bring to the policy process. Over time, interests learn what venues work for them in terms of outputs and what access goods they must provide to join the policy debate (Broscheid and Coen 2003, Bouwen 2003, Hall and Deardroff 2006).
Second, drawing on principal-agent insights, we assert that businesses are boundedly rational actors that wish to maximise their political returns and minimise their uncertainty (Miller 2005). To achieve these aims we expect firms to seek out venues that they perceive to have primary competence, expertise to make “good” policy , and in which they have established long term confidence to deliver on policy (Carpenter 2010). While firms may not expect the regulator to have as much expertise as themselves on the specifics of production and marketing processes, they may reasonably expect that a specialized sector regulator will have considerable know-ledge and well-informed judgment on questions of market access, market operation and market correction – certainly at a much higher level of expertise than politicians or cross-sector regu-lators. Accordingly, when addressing a regulator, the firm expects to be granted a decision that is substantively well-founded based on expertise as well as – and importantly so – the necessary formal and substantive capacity to undertake this decision. Similarly, on trans-border questions (such as competition, mergers and acquisitions, interconnection and trans-border infrastructure) we expect to see that firms address regulators with trans-boundary competences as opposed to
national regulators, especially if we accept that regulators at supranational level are created by political principals because they themselves lack (coordinative) capacity in trans-border issues (Abbott et al 2015).
3
Model and hypotheses
To develop our model, we first define our dependent variable, i.e. regulatory venue shopping. We are primarily interested in the businesses’ attempts to get involved in the regulatory process. In this respect, we define regulatory venue shopping as comprising one of two distinct activities: the first one consists of regularly addressing more than one regulator at the same time, in order (1) to acquire as much as information as possible on their orientation and preferences as well as on the positions and strategies of competitors and/or (2) to influence regulatory decisions. While the first is aimed at minimizing uncertainty and risks, the second is aimed at influencing the decision of regulators at multiple levels. As far as Europe is concerned, the two levels that matter most are the national and the EU one.
Our model relies on a set of assumptions. First, on the micro-side, we assume that firms are boundedly rational actors that know the structure of multiple venues around them and seek to use them in view of maximizing their expected material and immaterial gains and minimizing their expected losses. Second, and more specifically, we assume that firms have incomplete information on regulators’ preferences as well as the potential outcomes of different regulatory decisions. This leads to our general expectation that, to minimize the uncertainty related to decision-making, firms seek to acquire information from multiple regulators (though not ex-clusively from them).
Third, as regards the macro-side (i.e. the regulatory environment or opportunity structure), we assume that there may be overlapping competences of agencies across levels and sectors (Jupille et al 2011). So, there are multiple agencies to be addressed by firms and these regulatory agencies themselves may be in competition with each other for affirming their competence or extending their influence in a certain policy field. This means that, if there are overlapping
competences between them, regulatory agencies may have an incentive to meet the firms’ needs to establish or increase their regulatory competence, or to challenge the competence of another regulator. Hence, it makes sense for a firm to address several regulators in order to increase the chances of a favourable decision. Alternatively, firms may ask regulators to cooperate in order to get a regulatory decision.
We now turn to formulating our hypotheses. The first and most obvious cost that firms want to minimize (or benefit that they want to maximize) is the monetary impact of a regulatory decision on their budget. The potential cost (or benefit) that a decision is likely to have on the firm’s budget raises the stakes and, thus, firms’ incentives to decrease the degree of uncertainty they face on a certain issue. Therefore, it is reasonable to expect that, when a firm has a lot to gain or to lose from a decision, the tendency to engage in venue shopping will increase (Jupille et al 2011, Miller 2005):
H1: The greater the cost of regulation, the higher the likelihood that a firm will engage in regulatory venue shopping.
Another determinant of a firm’s tendency to address multiple regulators can be identified in issue saliency (Culpepper 2011). Salient issues are, by definition, debated in the media, and for this reason taken into high consideration by politicians and regulators as well. High media coverage for a firm implies high potential reputational costs of a negative decision on a regulatory issue, which may in turn lead to material costs. Contacting more regulators can help minimize these costs in two ways: first, by acquiring more information on the principles informing a regulatory agency’s decision; second, by making the regulator(s) more aware of the firm’s interests and views on the matter. Therefore, we expect that:
H2: The higher the saliency of a regulatory issue, the higher the likelihood that a firm will engage in regulatory venue shopping.
Moreover, we argue that another source of uncertainty for firms in regulated markets is technical complexity. Regulatory agencies can be a source of valuable information for firms, especially with regard to questions of market access and market operation, After all, delegation happens
because political principals delegate power to bureaucratic agents to deal with complex issues, for which they lack both the time and the necessary expertise (Bendor et al. 2001). Assuming that there is a positive relationship between need for information and complexity of regulatory issues, and considering that regulators can help firms obtain this information (and that dealing with several regulators may increase the amount of useful information), we can hypothesize that:
H3: The higher the technical complexity of a regulatory issue, the higher the likelihood that a firm will engage in regulatory venue shopping.
We further hypothesize that another reason for engaging in regulatory venue shopping can be identified in the competitiveness of the sector in which a firm operates. A sector with low petitiveness constitutes a more stable and predictable business environment than a highly com-petitive sector. Low comcom-petitiveness is usually found in sectors with high (informal) barriers to entry, which result in the establishment of oligopolies. The latter normally implies better know-ledge of other competitors and a lower likelihood of confronting aggressive market strategies from other actors. Hence, in sectors with low competitiveness firms have more information about the market and the outcome of business transactions is more predictable. In contrast, high competitiveness results in less information being available and increased uncertainty about the outcome. To mitigate this uncertainty, firms have an incentive to address multiple regulators in order to increase the amount of available information on the business environment, such as the relative position of competitors and the regulatory outcome they can expect from alternative choices. Therefore, we can expect that:
H4: The higher the competitiveness of a sector, the higher the likelihood that a firm will engage in regulatory venue shopping.
Finally, we posit that the perception of competences will also affect the firms’ behaviour in reg-ulatory venue shopping. Firms will seek more to acquire information from multiple regulators the more they perceive that regulators have knowledge that can be useful to them. If compet-ence is only national, regulatory venue shopping will be limited to national agencies. But if a
supranational competence exists as well, there will be higher chances that more regulators at more levels could be consulted and utilized. In particular, when companies perceive that there is a European competence on a certain issue, they will engage in regulatory venue shopping across levels:
H5: The stronger the firm’s perception that regulatory competences are located at European level, the higher the likelihood that a firm will engage in regulatory venue shopping.
4
Multilevel venue shopping: data and descriptive statistics
(map-ping the opportunity structure)
To empirically test our hypotheses, we conducted an online survey of big and medium sized firms operating across all the EU member states (except Croatia which acceded to the EU only in 2013), Switzerland and Norway. The survey was sent out in three waves: November 2009, February 2010 and June 2010. The survey methodology is rather common in studies on venue-shopping (e.g. Holyoke et al. 2012, Binderkrantz et al. 2015, Varone et al. 2017). Alternative methods (Jourdain et al. 2017, p. 128–131) are used when the range of activities is limited in time and/or in space (for instance, lobbying on a specific issue in a specific country or state). Our study differs from these analyses in that it attempts to carry out a mapping exercise, which covers many countries and many possible venues. Therefore, the survey methodology seems the most appropriate. The sampled companies operate in the energy (140 companies), tele-communication (128), railway transportation (96), postal services (30) and airlines (64) sectors. These sectors are characterized by a relatively low number of actors and by a limited or mono-polistic access to infrastructures, which result in an imperfect market competition that requires continuous and sustained regulatory effort. Firms in these markets rely on regulatory policies more heavily than firms in more competitive markets. For this reason, they should be more prone to seek interactions with regulators.
and companies using the booklets European Agenda.1 Second, we consulted the websites of European-level agencies operating in the industry sectors we targeted for information on their membership, contacting them personally where necessary. We then used the Amadeus European Company Database2to complete our sample and exclude smaller firms based on their national market share.3 We thus arrived at our final sample of 458 firms. The survey was sent via email to those directors and officials dealing with regulatory and legal affairs. We contacted all the relevant respondents we identified, resulting in more than one response per firm in some cases. To motivate honest responses, we guaranteed anonymity. The overall company response rate is 53.1%. It is highest in the postal services (70%) and energy (65%) sectors, followed by telecommunications (52.3%) and airlines (45.3%) sectors, and, finally, railways (36.5%) (see Appendix 1 for more details). This original survey is the first firm level study to provide detailed behavioural information on regulatory shopping. It not only offers comparative evidence on a wide range of regulatory issues facing companies, but it also covers firms in 5 different sectors across 29 countries.
We complemented our survey data with additional information on company turnover, national market share and number of employees drawing on the Amadeus industrial database; perceived regulatory quality of the countries covered by our analysis using the World Bank’s World-wide Governance Indicators;4 and the degree of competitiveness of the sectors surveyed in the OECD’s Product Market Regulation database.5
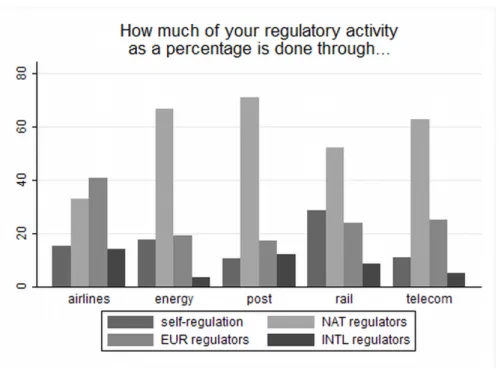
Before turning to the empirical test of our hypotheses, we examine the data to gather informa-tion about general patterns of firms’ behaviour and the opportunity structure. While we expect that all regulatory levels are utilized by firms, it is interesting to analyse how the combination of interactions at different levels varies across sectors. In Figure 1, we see that the bulk of firms’ interactions with regulators occur at the national level. This holds for all sectors except
1See http://www.european-agenda.com.
2Amadeus (Bureau van Dijk) is a pan-European financial database providing information on Europe’s biggest 520,000 public and private companies from 43 countries.
3For each sector, we ordered firms based on their operating revenue and we included them in our sample until we found a firm having an operating revenue less than 1/3 of the operating revenue of the previous firm.
4See http://info.worldbank.org/governance/wgi/index.asp.
5 In particular, for the indicators of regulation in energy, transport and communications (ETCR), see: http: //www.oecd.org/eco/growth/indicatorsofproductmarketregulationhomepage.htm.
Figure 1: Percentage of companies’ regulatory activities at different levels, per sector.
aviation, where interactions with European regulators are more important than interactions with national regulators. In other words, in spite of the liberalization and re-regulation of the net-work industries, the national regulatory authorities are still the most relevant for firms in the postal services, energy, telecom, and railways sectors. The rationale for the dominance of these NRAs could be explained by the status quo, location, proximity, scale and resources of NRAs, understanding of local markets and expertise, or clarity of competencies and mandates.
Exploring the differences between sectors, Figure 2 shows the number of firms which frequently address regulators according to sectors and levels. Overall, there is significant variation across and within sectors. On average, airline firms regularly address multiple regulators at all three levels – national, European and international. Energy firms on average regularly address mul-tiple national regulators, but not mulmul-tiple European and international regulators. For postal firms, national regulators are of great importance, whereas European and international regu-lators are of limited significance. For railways, national reguregu-lators are also viewed as the most important, European regulators less so and international regulators rank lowest. Finally, for
tele-Figure 2: Average number of regulators at the national, European and international level that firms report addressing regularly, per sector
Note: The figure represents the average number of regularly addressed regulators after ‘conservatively’ excluding outliers, i.e. those respondents reporting that their firms regularly address more than 15 regulators at the national, European and international level combined.
coms firms national regulators are of considerable importance, followed by European regulators and international regulators, as a distant third. In summary, on average firms in all sectors regu-larly address more than one national regulator; firm in the airlines, railway and telecom sectors address frequently more than one European regulator; and only airlines address on a regular basis more than one international regulator. This fits with our main assumption that, given a choice between regulators, firms will address several regulators when seeking a decision (see Appendix 2 for a summary across sectors).
Overall, what emerges from this descriptive analysis is that regulatory venue shopping is not a dichotomous concept (i.e. it is either present or not present) but a phenomenon with different degrees of intensity across sectors and levels.
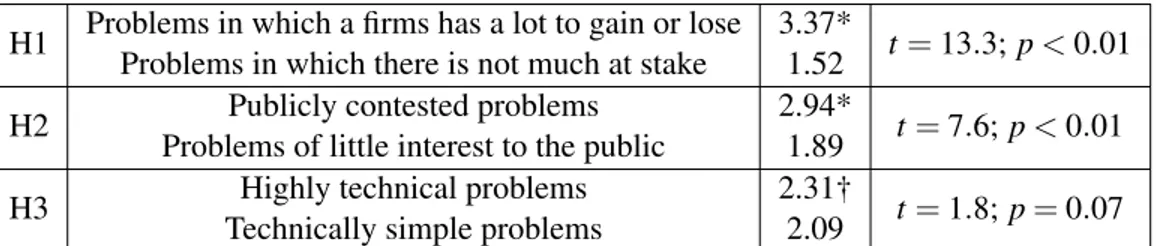
H1 Problems in which a firms has a lot to gain or lose 3.37* t= 13.3; p < 0.01 Problems in which there is not much at stake 1.52
H2 Publicly contested problems 2.94* t= 7.6; p < 0.01 Problems of little interest to the public 1.89
H3 Highly technical problems 2.31† t= 1.8; p = 0.07
Technically simple problems 2.09
Table 1: Paired-sample T-test comparing the mean number of regulator types that firms report they would contact regarding pairs of issue types.
5
The logic of regulatory venue shopping: an analysis
To examine our hypotheses H1-H3, we rely on firms’ responses to three matrix questions ask-ing which type of regulator a firm would contact if concerned with, respectively: 1) problems in which they have a lot to gain or lose versus problem in which there is not much at stake for them; 2) publicly contested problems versus problems of little interest to the public; 3) highly technical problems versus technically simple problems. Respondents were then allowed to choose as many as applicable from six types of regulator, namely national cross-sectoral, national sectoral, European cross-sectoral, European sectoral, international cross-sectoral and international sectoral regulators (see Appendix 3). Based on responses to these three questions, we constructed two types of dependent variables.
The first type measures the number of types of regulator (ranging from 0 to 6) that firms indic-ated they would address when faced with a given problem. These are continuous variables and the compared samples of responses are dependent because they are based on the same subjects, or here firms (e.g. a firm’s responses on the regulators they would address regarding salient is-sues cannot be assumed to be independent of the firm’s responses on the regulators they would address regarding non-salient issues). Therefore, we employ a paired-sample T-test to examine whether venue shopping by virtue of contacting more types of regulator is more likely when firms face higher costs and uncertainty as hypothesized in H1-H3. The results, presented in Table 1, offer support for all three hypotheses (albeit more limited support for H3 due to the 7% significance level) as the mean number of regulator types a firm addresses is indeed significantly
H1 Problems in which a firms has a lot to gain or lose .82* χ = 54.3; p < 0.01 Problems in which there is not much at stake .37
H2 Publicly contested problems .65* χ = 13.1; p < 0.01 Problems of little interest to the public .48
H3 Highly technical problems .56 χ = 0.6; p < 0.43
Technically simple problems .53
Table 2: McNemar Test comparing the proportions of firms indicating they would contact supranational regulators besides national ones regarding pairs of issue types.
higher when firms face more versus less costly issues (H1), more versus less salient issue (H2) and more versus less complex issues (H3).
The second type of dependent variables we employ indicate whether firms reported they would address only national (0) or also European and/or international regulators (1) regarding a spe-cific problem. Once again, we compare dependent samples. Yet, this time our response vari-ables to test the three hypotheses are binary, necessitating the use of the more appropriate McNemar Test for comparing dependent proportions (Agresti and Finlay 1997, p. 229). Spe-cifically, with this test we will examine whether venue shopping by virtue of going beyond the national level and contacting also supranational regulators is more likely in the hypothesized circumstances. The findings, reported in Table 2, offer evidence for the first two hypotheses but not for the third one. Specifically, firms do tend to engage in venue shopping by going beyond national regulators and addressing also European and/or international regulators when they are concerned with potentially more costly problems as well as with more salient issues (H2). Issue complexity plays no role in this regard (H3).
Additional analyses focusing on sectoral regulators only, whom firms tend to address more frequently, shows in line with H1 that firms address such regulators at significantly more levels – national, European and international (so min = 0 and max = 3) – when a lot is riding on the decision (mean = 2.0) than when they have little to lose or gain (mean = 0.94) (a paired-sample t-test indicates that these results are significant at p < 0.01, two tailed with t = 13.7) Regarding H2, we find that when salient issues are concerned, on average firms address sectoral regulators at 1.74 levels, while this number is significantly smaller when problems of little interest to the
public are concerned and lies at 1.23 (t = 6.2; p < 0.01, two-tailed). Turning to H3, we find that regarding highly technical issues firms address on average sectoral regulators at 1.69 levels, while again this number is significantly smaller regarding technically simple issues – 1.23 (t = 5.7, p < 0.01 two-tailed).
Overall, the three analyses, using various operationalisations, of venue shopping offer strong support for H1 (cost of regulation) and H2 (saliency of regulatory issues). As regards H3, technical complexity has an impact on the firms’ tendency to address sectoral regulators, but has less of an impact on the number of regulators addressed and on vertical venue shopping. Therefore, we can conclude that regulatory venue shopping is a strategy often adopted by firms seeking the most favourable outcome in high stake situations – be it due to the economic or the political costs of regulation.
In contrast to the previous three explanations, H4 and H5 shift the attention from explaining within-firm variation in regulatory venue shopping depending on the regulatory issue at hand to explaining between-firm variation. The independence of cases, or firms, predisposes moving away from the univariate analysis used to test H1-H3 and employing multivariate regression analysis.
For robustness sake, we again rely on two distinct, but complementary, operationalizations of the dependent variable (regulatory venue shopping). The first operationalization we use is a count variable, namely the answer firms gave to the question: ‘How many regulators do you regularly address?’.6 The second is the level at which companies report to address regulators, a binary variable with value 0 if firms report to address regulators only at national level, and 1 if they report to address regulators also at supranational (EU and international) level.7 For the first dependent variable, we employ a Poisson regression model,8while for the second we use
6The companies’ responses range from 0 to 50, with a mean of 4 regulators regularly addressed per company. Responses higher than 20 (five in total) were removed from the data set as invalid. Furthermore, when there were multiple respondents from the same company, we selected the respondent with the least number of unanswered questions. The resulting response variable employed for the analysis has a mean of 2.94.
7The variable was coded from the responses given to a question asking how many regulators the firm addresses at national, EU and international level. We assigned 0 to companies that reported to address regulators only at national level, and 1 to companies that reported to address regulators both at national and supranational (EU and international) level.
logistic regression. In both types of models, we compute country-level random intercepts to take into account the nested structure of our data.
Regarding the two explanatory variables for these hypotheses, sector competitiveness is oper-ationalized with data from the OECD’s Product Market Regulation Database (OECD 2011).9 Two different indicators of sector competitiveness have been calculated: the first one is a proxy for the competitiveness of each sector in each country; the second one is the mean of the compet-itiveness of each sector across all countries.10With these two indicators, we aim to capture both the level of competition that a firm faces in the internal market and the level of ‘international’ competition it is confronted with, which is relevant for companies that operate across different countries. Both variables range from 0 (no competitiveness) to 6 (maximum competitiveness). The minimum value the first indicator assumes in our data is 0.7 (railway transportation in Fin-land) and the maximum value is 6 (airlines in Germany and Belgium). According to the second indicator, the least competitive sector is railway transportation (2.26) and the most competitive is air transport (4.50).11 The explanatory variable that we use to test H5, i.e. perception that regulatory issues are located at European level, is operationalized with the firms’ responses to questions asking whether, for six different issues,12 companies perceive that the competence lies at national level (0), European level (2), or it is equally shared (1). The explanatory variable is obtained by summing the responses given by firms in all issues, the maximum value (12) being that of a firm perceiving European competence in all issues and the minimum value (0) that of a firm perceiving national competence in all issues.
package lme4 in R) instead of negative binomial regression because we found no statistical package that could com-pute a multilevel negative binomial regression with weights. Other statistical packages allow for the computation either of a multilevel negative binomial regression without weights (package glmmADMB in R) or of a non-multilevel negative binomial regression with weights (function glm.nb in package MASS in R). We ran these models as robust-ness checks (see Appendix 4) and we obtained results in line with the Poisson model.
9The database codes “energy” and “gas” as two separate sectors. Since we consider them together, we calculated the mean value of the two sectors.
10The mean has been calculated across the 2003-2007 period. 2007 was the last available year when the data were collected (November 2012). Concerning the first indicator, no value could be calculated for non-OECD countries (Bulgaria, Cyprus, Estonia, Latvia, Lithuania, Malta, Romania). Also Slovenia (member since July 2010) was not a member when the data were collected.
11Postal services scores 2.97, Energy 3.58, Airlines 4.23.
12The issues are: “mergers and acquisitions”, “interconnection”, “infrastructure access”, “regularity of services provisions”, “prices”, “services reliability”.
Several indicators are employed as control variable in our analysis. The firm’s operating revenue (in billions of Euros), market share, and number of employees13help us control for the size of the company, under the assumption that a bigger company will have more markets to take care of, will be more likely to engage in regulatory activities at multiple levels, and will have more at stake in general. We then use an indicator for the regulatory quality of a country in which the firm is based14as a proxy of the tendency of the company to rely on agencies for collecting useful and trustworthy information; our assumption is that if a country’s regulators have a bad reputation, firms will be less likely to address them.15 Finally, we also control for the firm’s tendency to engage in self-regulation,16assuming that if a company tends to make great use of self-regulation, it will be less likely to engage in regulatory venue shopping. Regarding survey responses, whenever more than one respondent per company filled in our questionnaire we ran into the problem of violating the independence of cases assumption. In such cases we use the weighted average response per company. Furthermore, to deal with the missing data problem inherent to survey data, we imputed missing values.17
The results of the regression analysis (see Table 3) confirm both H4 and H5. Regarding H4, we can see that cross-country sector competitiveness significantly affects both the number of regularly addressed regulators and the level at which companies interact with regulators. The relationship is positive as hypothesized and statistically significant in all models. In contrast, within-country sector competitiveness does not have any significant impact on the two depend-ent variables. From this analysis, it seems that the tendency to address more regulators is related
13 Data on operating revenue, market share and number of employees have been collected from the Amadeus database.
14The regulatory quality indicator captures “perceptions of the ability of the government to formulate and imple-ment sound policies and regulations that permit and promote private sector developimple-ment” (Kaufmann et al. 2010, p. 4). We employ it as an indicator for the quality of the assistance, guidance, information that firms can receive from regulatory agencies. The assumption is that a better regulatory quality provides incentives for companies to address more regulators.
15To avoid the risk of endogeneity and multicollinearity, we tested whether this index is correlated with the firms’ tendency to address regulators at supranational level. Indeed, a firm’s regulatory quality assessment could depend on the prior decision to go at a particular level. However, we only found a very weak (0.08) correlation between the two variables.
16Measured as the percentage of regulatory activity carried out through self-regulation (own survey data). 17 We used package Amelia (Honaker et al., 2011) in R to impute missing values. It uses an expectation– maximization with bootstrapping (EMB) algorithm to draw random values for replacing the missing ones. We imputed 10 data sets from the original one. The original data set had 815 missing values out of 4131 values (19.73%).
to the level of international competitiveness of the sector, rather than on national sector com-petitiveness. Even when internal competition is low, companies operating in sectors that are, on average, more competitive in other countries tend to address several regulators, either because they expect that their internal market might become more competitive, or because they operate (or wish to operate) in countries where there is greater competition. As shown in Figure 3, the model predicts that companies in the most competitive sector (air transport) will regularly address, on average, 0.77 regulators more than firms in the least competitive sector (railway transport). As concerns the probability that companies will address regulators at supranational level, the empirical analysis shows that international sector competitiveness has a decisive im-pact: such probability is on average 19% for a railway firm and 68% for an airline.
Concerning H5, the models in Table 3 show that the more firms perceive that competences on regulatory issues are located at European level, the more they tend to engage with agencies at the supranational level and the more regulators they address overall – although the evidence for the first effect is weaker. Figure 3 is once again useful to identify the impact of the selected predictors on both the dependent variables. H5 is confirmed in the first operationalization, as the average number of regulators regularly addressed by companies not identifying any issues under EU competence is 0.93, while, all else equal, the number grows to 1.43 for companies perceiving all their regulatory issues as involving a primary European competence. Turning to the second operationalization, as we can observe in Table 3, the Perceived EU competence variable is statistically significant only at 0.1 level in the first two models (Models 4 and 5) and it is not significant in Model 6. This is reflected in the weaker effect identifiable in Figure 3 for this variable. Although we still have an increase in predicted probabilities of addressing supranational regulators when moving from the lowest (43% probability) to the highest value (78%), the 95% confidence interval is wider than for the sector competitiveness variable, and suggests to interpret this result with more caution.
Among the controls, the operating revenue and regulatory quality indicators are positively re-lated to the first dependent variable, as expected, while market share, number of employees, and the tendency to engage in self-regulation do not affect a firm’s venue shopping activity.
Figure 3: Impact of cross-country sector competitiveness and perception of EU regulatory com-petences on the predicted number of regularly addressed regulators and on the probability of addressing agencies at supranational level (graphs based on Models 1 and 4).
Dependent variables: Number of re gulators re gularly addressed Le v el at which firms report to address re gulators (0 = only na-tional; 1 = national + suprana-tional) (1) (2) (3) (4) (5) (6) Sector competiti v eness (within country) -0.067 -0.061 -0.064 -0.2 -0.143 -0.167 (0.075) (0.079) (0.077) (0.331) (0.307) (0.28) Sector competiti v eness (cross-country) 0.344*** 0.308*** 0.331*** 0.994** 0.835* 0.927** (0.111) (0.108) (0.112) (0.478) (0.434) (0.401) Percei v ed EU competence 0.042** 0.044*** 0.039*** 0.127* 0.129* 0.122 (0.016) (0.016) (0.016) (0.076) (0.073) (0.075) Mark et share 0.388 0.34 0.578 0.435 (0.23) (0.239) (1.128) (1.083) Operating re v enue (billion C) 0.01** 0.01** 0.029 0.03 (0.005) (0.004) (0.031) (0.03) Number of emplo yees (thousands) -0.001 -0.001 -0.005 -0.005 (0.001) (0.001) (0.007) (0.007) Re gulatory quality 0.286** 0.292** 0.497 0.546 (0.132) (0.135) (0.531) (0.522) Self-re gulation (% of re gulatory acti vity) 0.007 0.005 0.017 0.014 (0.004) (0.004) (0.022) (0.02) (Intercept) -0.714 -0.119 -0.51 -4.397** -3.076 -4.053 (0.435) (0.384) (0.412) (1.83) (1.276) (1.609) AIC 1090.38 1096.63 1100.21 221.47 221.48 219.67 BIC 1129.12 1127.63 1127.33 260.22 252.48 246.79 Random intercepts’ standard de viation 0.123 0.172 0.144 0.012 0.001 0.0001 Notes: Models 1, 2 and 3 are Poisson re gressions with country-le v el random intercepts. Models 4, 5 and 6 are logistic re gressions with country-le v el random intercepts. N = 356. Significance le v els: * < 0.1, ** < 0.05, *** < 0.01. T able 3: Multile v el re gression models of the number (pois son models 1-3) and le v el (logistic re gression models 4-6) of addressed re gulators
6
Discussion of results and conclusions
Drawing on an original survey of 243 firms’ attitudes to venue shopping, our study provides a number of interesting finding. Our hypotheses, which were mainly drawn from the previous literature on venue shopping, were supported by the empirical analysis. Significantly, the data shows the robustness of the national level, even in sectors where multi-level opportunities exist. What is clear from our analysis is that there is a limited incentive to by-pass national regulat-ors. This also implies that we can expect national “varieties of capitalism” to shape distinct “varieties of regulatory capitalism” (Levi-Faur 2005, Guardiancich and Guidi 2016). The resi-lience of the nation-state in regulatory policies, despite increasing economic interdependence and globalization, is an aspect that, we believe, deserves closer attention.
That said, we found that firms do engage in regulatory venue shopping, and the study clearly illustrates that they use a multi-regulatory and multi-level strategy. While a large proportion of firms reported that they regularly address multiple regulators, we did observe significant vari-ation across sectors. Thus, at the horizontal level, energy, telecommunicvari-ation and airline firms regularly address several national regulators, while railway and postal firms do so less, being more nationally embedded and having less regulatory venues. At the vertical level, airlines are the most internationalised and address several European regulators, followed by telecommunic-ation and energy firms who, while primarily focused on NRAs, are also dealing with the ERNs and Commission. Again, postal and railway firms are nationally embedded and resort to the EU level sparingly.
In terms of the logic of regulatory venue shopping, this happens when issues are highly sali-ent, highly technical and when the stakes for the individual firm are high. Companies tend to address more regulators in sectors characterized by higher international competitiveness, as a means to mitigate uncertainty when operating in multiple markets and facing rivalry from in-ternational competitors. We also found that regulatory venue shopping is positively affected by the companies’ perceptions regarding regulatory competences: the more they perceive them to be located at the EU level, the more they venue-shop. Thus, while the national level remains predominant, the growth of supra-national regulation pushes firms to diversify their strategies.
The robustness of the nation state can be rationalized as a consequence of the evolution of the regulator/regulatee relationship over time – that is, of the firms’ previous experience with national regulators. This could be due to the stronger formal and de facto independence of national agencies. As independence is meant to increase the consistency and stability of regu-latory decisions, we could expect it to have a positive effect on the choice to address regulators. In addition, the longevity of business/regulators interactions may increase the confidence and certainty of obtaining sympathetic outcomes. We do not systematically analyse these processes in the paper, but they are factors which future research in this field could incorporate. The creation of European networks might also have strengthened rather than weakened national regulators. Studying the effects of the emergence of European regulatory solutions on domestic business/regulators relationships is another potentially fruitful avenue to explore.
Overall, this is the first large-N study to look at individual firm’ venue shopping in regulation. We have focused on network firms operating in sectors that are characterized by frequent in-teractions and regulatory decisions, where regulatory venue shopping should be most likely to occur. It remains to be seen whether out findings would also pertain to other more competitive sectors. While we have explored firms’ individual venue shopping behaviour, venue shopping may be also shaped by group strategy. In particular, the role of employer associations in co-ordinating the choice of regulatory venues is worth investigating further.
References
Agresti A and Finlay, B (1997) Statistical Methods for the Social Sciences. 3rd Ed. Saddle River: Prentice-Hall, Inc.
Abbott K and Snidal, D (2009) The Governance Triangle: Regulatory Standards Institutions and the Shadow of the State. In Mattli W and Woods N (eds.) The Politics of Global Regulation (pp. 44-88). Princeton: Princeton University Press.
Abbott K, Genschel P, Snidal, D and Zangl B (eds) (2015) International Organisations as Or-chestrators. Cambridge, UK: Cambridge University Press.
Amadeus European Company Database. Available at https://amadeus.bvdinfo.com/. Ac-cessed in October 2009 and May 2011.
Bach D and Newman A (2014) Domestic Drivers of Trans-governmental Regulatory Co-operation. Regulation & Governance 8(4), 395–417.
Baumgartner F and Jones B (1993) Agendas and Instability in American Politics, Chigago: Chicago University Press.
Bendor J, Moe T and Shotts K (2001) Recycling the garbage Can, An assessment of the Re-search Program, American Political Science Review 95(1), 169–190.
Binderkrantz A S, Christiansen P M, and Pedersen H H (2015) Interest Group Access to the Bureaucracy, Parliament, and the Media: Interest Group Access. Governance 28(1), 95–112. Bouwen P (2002) Corporate Lobbying in the European Union: The logic of access, Journal of European Public Policy9(3): 365–390.
Brasher H and Lowery D (2006) The Corporate Context of Lobbying Activity, Business and Politics8(1), 1–23.
Broschied A and Coen D (2003) Insider outsider lobbying of the European Commission, European Union Politics4(2), 165–189.
Buffardi A L, Pekkanen, R J, and Smith S R (2015) Shopping or specialization? Venue targeting among nonprofits engaged in advocacy. Policy Studies Journal 43(2), 188–206.
Coen, D and Héritier A (eds.) (2005) Refining Regulatory Regimes: Utilities in Europe, Chel-tenham, UK: Edward Elgar.
Coen, D and Thatcher M (2008) Network governance and Multi-level delegation: European networks of regulatory agencies, Journal of Public Policy 28(1), 49–71.
Coen, D (2009) Business Lobbying in the EU. In Coen D and Richardson J (eds.) Lobbying the European Union: Institutions, Actors and Issues, Oxford, UK: Oxford University Press. Constantelos J (2010) Playing the Field: Federalism and the Politics of Venue Shopping in the United States and Canada, Publius 40(3), 460–483.
Cini M and McGowan L (2009) Competition Policy in the European Union, Basingstoke, UK: Palgrave Macmillan.
Culpepper P (2011) Quiet Politics and Business Power: Corporate Control in Europe and Ja-pan, Cambridge, UK: Cambridge University Press.
De Bièvre D, Poletti A and Thomann L (2014) To enforce or not to enforce? Judicialization, venue shopping, and global regulatory harmonization, Regulation & Governance 8(3), 269– 286.
Gilardi F (2008) Delegation in the regulatory state: independent regulatory agencies in Western Europe, Cheltenham, UK: Edward Elgar.
Guardiancich I and Guidi M (2016) Formal independence of regulatory agencies and Varieties of Capitalism: A case of institutional complementarity? Regulation & Governance 10(3), 211– 229.
Hall R and Deardroff A (2006) Lobbying as a Legislative Subsidy, American Political Science Review100(1): 69–84.
Halpin D R and Fraussen B (2017) Conceptualising the policy engagement of interest groups: Involvement, access and prominence. European Journal of Political Research 56(3), 723–732. Holyoke T T, Brown H and Henig J R (2012) Shopping in the Political Arena: Strategic State and Local Venue Selection by Advocates. State and Local Government Review 44(1), 9–20. Honaker J, King G and Blackwell M (2011) Amelia II: a program for missing data, Journal of Statistical Software45(7), 1–47.
Jourdain C, Hug S and Varone F (2017) Lobbying Across Venues: An Issue-Tracing Approach. State Politics & Policy Quarterly17(2), 127–153.
Jordana J and Levi-Faur D (eds.) (2004) The Politics of Regulation: Institutions and Regulatory Reforms for the Age of Governance, Cheltenham, UK: Edward Elgar.
Jupille J, Mattli W and Snidal D (2011) International Institutional Choice: Cooperation, Al-ternatives and Strategies, Cambridge, UK: Cambridge University Press.
Kaufmann D, Kraay A, and Mastruzzi M (2010) The Worldwide Governance Indicators: Meth-odology and Analytical Issues. World Bank Policy Research Working Paper (5430).
Levi-Faur D (2005) The Global Diffusion of Regulatory Capitalism, Annals of the American Academy of Political and Social Science598(1), 12–32.
Levi-Faur D (2010) Regulatory Networks and Regulatory Agencification: Towards a Single European Regulatory Space, Journal of European Public Policy 18(6), 810–829.
Maggetti M and Gilardi F (2011) The Policy Making Structure of European Regulatory Net-works and the Domestic Adoption of Standards, Journal of European Public Policy 18(6), 830– 847.
Mattli W and Buthe T (2003) Setting International Standards: Technological Rationality or Primacy of Power, World Politics 58(1), 1–42.
Miller G J (2005) The Political Evolution of Principal-Agent Models, Annual Review of Polit-ical Science8(1), 203–225.
OECD (2011) Product Market Regulation Database, Available at: www.oecd.org/economy/ pmr.
Pralle S (2003) Venue Shopping, Political Strategy and Policy Change: The Internationalization of Canadian Forest Advocacy, Journal of Public Policy 23(3), 233–260.
Prince S and Kerremans B (2008) Opportunity Structures in the EU multi level system, West European Politics31(6), 1129–1146.
Slaughter M (2004) A New World Order, Princeton: Princeton University Press.
Thatcher M (2007) Internationalisation and economic institutions: comparing the European experience, Oxford, UK: Oxford University Press.
Varone F, Ingold K and Jourdain C (2017) Defending the status quo across venues and coali-tions: evidence from California interest groups, Journal of Public Policy 37(1), 1–26.
Appendix 1: sample and response rate
Energy Telecom Rail Post Airlines TOTAL
Number of sampled firms 140 128 96 30 64 458
Company responses 91 67 35 21 29 243
Company response rate 65.0% 52.3% 36.5% 70.0% 45.3% 53.1%
Individual responses 128 100 47 31 50 356
Median number of answered questions 21 22 17 9 15 20 Mean number of answered questions 16 16 13 11 13 15 Table A1: Sample and response rate of the survey
Note: The reported response rate is based only on the responses in which at least three questions were completed.
Appendix 2: Additional descriptive statistics
As Table A2 shows, only 26 percent of firms report regularly addressing only one regulator at whatever level, while 43 percent of firms regularly address two or three regulators. The number of firms regularly addressing just one regulator at the national level stands at 36 percent, while those addressing two or three regulators at this level account for 43 percent. In terms of European regulators, the percentage of firms regularly addressing one such regulator is 47 percent, while 24 percent of respondents report addressing two or three European regulators on a frequent basis. Finally, the percentage of firms which indicate they regularly address one international regulator stands at 18 percent, while 14 percent of firms report addressing two or three international regulators. These figures indicate a sizeable percentage of companies are regularly turning to multiple regulators, especially at the national but also at the European level.
0 1 2 3 4 or more All 1.3 26.0 25.6 17.0 30.1 (3) (58) (57) (38) (67) National 0.9 35.6 27.4 15.5 20.6 (2) (78) (60) (34) (45) European 21.6 46.8 17.5 6.4 7.7 (37) (80) (30) (11) (13) International 60.5 17.7 12.1 1.6 8.1 (75) (22) (15) (2) (10)
Table A2: Percentage of firms reporting that they regularly address 0, 1, 2, 3 or more regulators. Note: The numbers represent the percentage of respondents that indicated their firms contacted regularly the respective number and type of regulators. In brackets are displayed the corresponding frequencies.
Appendix 3: Most frequently addressed regulator depending on type
of problem in question
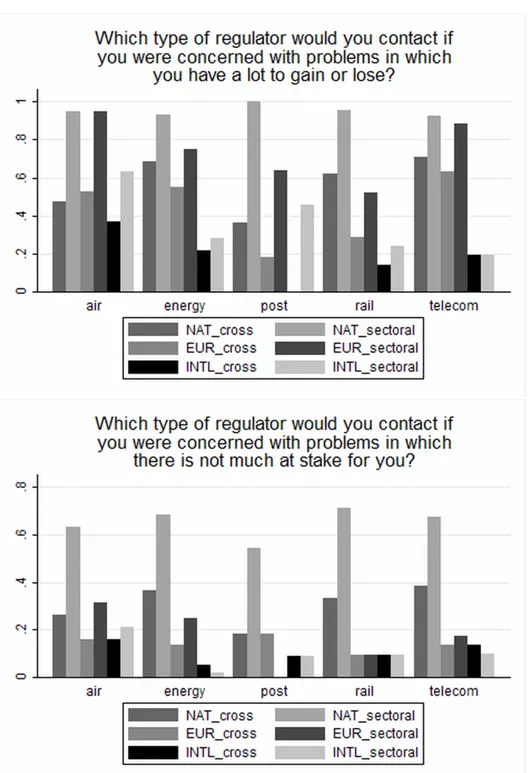
As an alternative ways to explore H1-H3, in this appendix we consider the types of regulator firm most frequently address depending on the stakes, salience and technical complexity a prob-lem entails. Defining a regulator as ‘likely to be addressed’ if more than 50% of the respondents of the sample in a given sector indicate that they would approach it regarding a given problem, we rank the frequency with which firms in different sectors approach sectoral or cross-sectoral regulators at the national, European and international level. Thus, Table A3 displays in des-cending order the types of regulators that most firms in a given sector indicated as likely to address when concerned with problems in which it has a lot to gain or lose and problems in which there is not much at stake for it. We find that firms approach frequently European and international-level regulators only on issues where the stakes are high and they stand to lose or gain significantly. Notably, European sectoral regulators are addressed more frequently than national cross-sectoral regulators on issues where firms have a lot to lose, except in the case of railway firms (for the exact breakdown of the results by sector, see Figure A1.
Problems in which a firm Problems in which there is has a lot to gain or lose not much at stake for a firm
Airlines
1. NAT sectoral & EUR sectoral (.95)
1. NAT sectoral (.63) 2. INTL sectoral (.63) 4. EUR cross-sectoral (.53) Energy 1. NAT sectoral (.93) 1. NAT sectoral (.68) 2. EUR sectoral (.75) 3. NAT cross-sectoral (.68) 4.EUR cross-sectoral (.55)
Post 1. NAT sectoral (1.00) 1. NAT sectoral (.55)
2. EUR sectoral (.64) Rail 1. NAT sectoral (.95) 1. NAT sectoral (.71) 2. NAT cross-sectoral (.62) 3. EUR sectoral (.52) Telecom 1. NAT sectoral (.92) 1. NAT sectoral (.67) 2. EUR sectoral (.88) 3. NAT cross-sectoral (.71) 4. EUR cross-sectoral (.63)
Table A3: Most frequently reported choice of regulator when a firm is concerned with problems in which it has a lot to gain or lose versus problems in which there is not much at stake for it (in descending order)
Note: Reported are only the types of regulator which more than 50% of the respondents of the sample in a given sector indicated as likely to address. The exact fraction of such firms is displayed in brackets.
Publicly contested problems Problems of little public interest Airlines 1. NAT sectoral (.89) 1. NAT sectoral (.67) 2. EUR sectoral (.78) 3. EUR cross-sectoral (.56) Energy 1. NAT sectoral (.93) 1. NAT sectoral (.75) 2. NAT cross-sectoral (.68) 3. EUR sectoral (.57)
Post 1. NAT sectoral (.91) 1. NAT sectoral (.73) Rail 1. NAT sectoral (.89) 1. NAT sectoral (.74)
2. NAT cross-sectoral (.68) Telecom 1. NAT sectoral (.92) 1. NAT sectoral (.83) 2. NAT cross-sectoral (.71) 3. EUR sectoral (.63)
Table A4: Most frequently reported choice of regulator when a firm is concerned with publicly contested problems versus problems of little interest to the public, per sector (in descending order)
Note: Reported are only the types of regulator, which more than 50% of the respond-ents of the sample in a given sector indicated as likely to address. The exact fraction of such firms is displayed in brackets.
Table A4 displays in descending order the types of regulators that most firms in a given sector indicated as likely to address when concerned with publicly contested problems and problems of little interest to the public (for more details, see Figure A2). In all sectors, firms are likely to address only national sectoral regulators regarding issues of limited public interest. When concerned with publicly contested problems, bar some sectoral differences, firms are gener-ally most likely to address national sectoral regulators, then national cross-sectoral regulators, followed by European sectoral regulators, but not international regulators. Postal services and railway firms are alone in approaching solely national regulators, likely due to the limited avail-ability of alternative competent regulatory venues at the supranational level. Thus, firms appear to ‘go abroad’ only when concerned with publicly contested issues where they are not confident of getting a favourable decision by the regulator at home. They seem to be responding to public pressure at home when they choose to ‘go abroad’ and seek out alternative regulatory venues. This appears to hold for all sectors.
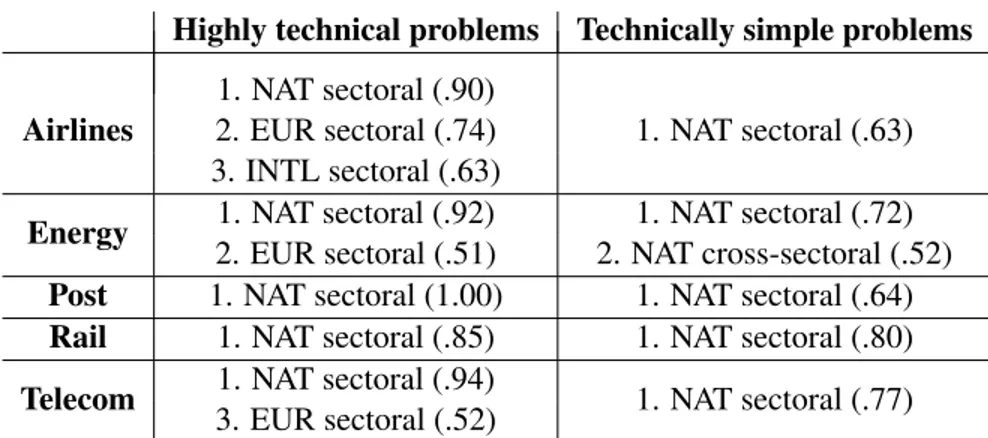
Highly technical problems Technically simple problems Airlines 1. NAT sectoral (.90) 1. NAT sectoral (.63) 2. EUR sectoral (.74) 3. INTL sectoral (.63)
Energy 1. NAT sectoral (.92) 1. NAT sectoral (.72) 2. EUR sectoral (.51) 2. NAT cross-sectoral (.52) Post 1. NAT sectoral (1.00) 1. NAT sectoral (.64) Rail 1. NAT sectoral (.85) 1. NAT sectoral (.80) Telecom 1. NAT sectoral (.94) 1. NAT sectoral (.77)
3. EUR sectoral (.52)
Table A5: Most frequently reported choice of regulator when a firm is concerned with highly technical problems versus technically simply problems (in descending order)
Note: Reported are only the types of regulator, which more than 50% of the respond-ents of the sample in a given sector indicated as likely to address. The exact fraction of such firms is displayed in brackets.
Turning to H3, what emerges from our findings, summarized in Table A5 (for more details see Figure A3) is that when confronted with highly technical issues, firms tend to contact national and European sectoral regulators. In the airlines, energy and telecom sectors, firms may not limit themselves to addressing national sectoral agencies only, but would also seek to acquire information from European sectoral regulators. In other words, the European sectoral regulator helps firms “cross-check” the information obtained at the national level. In contrast, when technically simple problems are concerned, firms prefer to remain at the national level, which is obviously easier to address. Thus we could argue that the lower the complexity of an issue, the weaker the incentive is to “go to Brussels”.
Figure A1: Firms’ choice of sectoral or cross-sectoral regulator at national, European or inter-national level when facing ‘problems in which they have a lot to gain or lose’ versus ‘problems in which there is not much at stake for them’
Figure A2: Firms’ choice of sectoral or cross-sectoral regulator at national, European or inter-national level when facing ‘publicly contested problems’ versus ‘problems of little interest to the public’
Figure A3: Firms’ choice of sectoral or cross-sectoral regulator at national, European or inter-national level when facing ‘technically difficult’ and ‘technically simple’ problems
Appendix 4: Robustness checks for H4 and H5 (negative binomial
regressions)
Dependent variable: Number of regularly addressed regulators
(7) (8) (9)
(Intercept) -0.667 -0.182 -0.417
(0.431) (0.382) (0.431) Sector competitiveness (within country) -0.043 -0.029 -0.024
(0.075) (0.077) (0.074) Sector competitiveness (cross-country) 0.316*** 0.289*** 0.297***
(0.109) (0.108) (0.11) Perceived EU competence 0.044** 0.046** 0.042**
(0.018) (0.018) (0.019)
Market share 0.46 0.429
(0.234) (0.237) Operating revenue (billion C) 0.012*** 0.012***
(0.004) (0.004) Number of employees (thousands) -0.001 -0.002
(0.001) (0.001)
Regulatory quality 0.287** 0.287**
(0.126) (0.134)
Self-regulation (% of regulatory activity) 0.004 0.002
(0.004) (0.004)
N 356 356 356
AIC 1535.55 1539.45 1551.57
Table A6: Multilevel negative binomial regressions of the number of regularly addressed regu-lators (without weights).
Dependent variable: Number of regularly addressed regulators
(10) (11) (12)
(Intercept) -0.643 -0.179 -0.408
(0.498) (0.381) (0.424) Sector competitiveness (within country) -0.044 -0.022 -0.02
(0.082) (0.075) (0.071) Sector competitiveness (cross-country) 0.311** 0.285** 0.293***
(0.128) (0.108) (0.108)
Perceived EU competence 0.04* 0.046** 0.043**
(0.021) (0.018) (0.019)
Market share 0.368 0.418
(0.281) (0.233) Operating revenue (billion C) 0.01 0.012***
(0.006) (0.004) Number of employees (thousands) -0.001 -0.002
(0.002) (0.001)
Regulatory quality 0.258* 0.287**
(0.148) (0.128)
Self-regulation (% of regulatory activity) 0.007 0.002
(0.005) (0.004)
N 356 356 356
AIC 1028.66 1538.16 1549.9
Table A7: Negative binomial regressions of the number of regularly addressed regulators (with weights).