UNIVERSITÀ DEGLI STUDI DI CATANIA
DIPARTIMENTO DI SCIENZE BIOMEDICHE E BIOTECNOLOGICHEDOTTORATO DI RICERCA IN BASIC AND APPLIED BIOMEDICAL SCIENCES XXIX CICLO
---
_______________
TESI DI DOTTORATO_____________________
Evaluation of the PI3K/Akt/mTOR pathway in Multiple Sclerosis
Dott.ssa Santa Mammana
Coordinatore e Tutor:
Chiar.mo Prof. Ferdinando Nicoletti
---
1
Sommario
INTRODUCTION ... 3
Multiple sclerosis ... 3
Clinical Course And Diagnosis ... 3
Figure 1. ... 4
Etiology ... 6
Role of infectious Agents ... 6
Immuno-Pathogenesis ... 7
Possible Mechanisms of Injury and Repair in Multiple Sclerosis. ... 7
Treatment ... 8
Current therapies ... 9
The Experimental Allergic Encephalomyelitis (EAE) as the animal model for MS ... 10
The PI3K/Akt/mTOR pathway ... 10
Figure 2. ... 13
Figure 3. ... 14
The PI3K/Akt/mTOR pathway in the adaptive immune response ... 15
The PI3K/Akt/mTOR pathway in autoimmune diseases... 17
Inhibitors targeting the PI3K/Akt/mTOR Pathway ... 18
mTORC1 Inhibitors ... 19
mTOR Inhibitors ... 19
PI3K Inhibitors ... 20
Dual PI3K/mTOR Inhibitors ... 21
Akt Inhibitors... 22
AIM OF THE STUDY ... 24
Figure 4. ... 26
MATERIALS AND METHODS ... 27
In silico analysis ... 27
Generation of the MS “Disease gene signature” and of Rapamycin “Drug regulated genes” ... 27
Generation of the mTOR “Regulatory molecular network” ... 27
Dataset selection and analysis of oligodendrocyte damage and remyelination processes ... 28
Gene enrichment analysis ... 28
Ex vivo and in vitro analysis ... 28
Animals... 28
2
Ex vivo restimulation with MOG35-55 ... 29
Determination of Cytotoxicity ... 30
Supernatant cytokine levels ... 30
In vitro effects of Rapamycin ... 30
qRT-PCR. ... 30
Statistical analysis ... 31
RESULTS ... 32
Generation of the mTOR network ... 32
Figure 5. ... 33
Figure 6. ... 34
Involvement of the mTOR network in MS ... 35
Figure 7 ... 36
Rapamycin effects in MS ... 37
Figure 8. ... 38
Involvement of the mTOR pathway in MS cortical lesions ... 39
Figure 9. ... 40
Involvement of the mTOR pathway in oligodendrocyte function ... 41
Figure 10. ... 41
Figure 11. ... 42
Effects of PI3K/mTOR inhibitors in MS ... 43
Figure 12. ... 44
Figure 13. ... 45
Figure 14. ... 46
Effects of mTORC1 inhibition on T cells under a Th17 polarizing condition ... 47
Figure 15. ... 48 Figure 16. ... 49 Figure 17. ... 50 Figure 18. ... 52 Table 1. ... 52 Table 2. ... 53 Table 3. ... 53 Table 4. ... 54 CONCLUSIONS ... 55 REFERENCES ... 59
3
INTRODUCTION
Multiple sclerosisMultiple sclerosis (MS) is one of the most common chronic inflammatory diseases of the central nervous system leading to demyelination and neurodegeneration.
According to the Atlas of MS, there are about 2.3 million people in the world with MS, although the number may be much higher as it is likely that many people with MS remain undiagnosed in certain parts of the world (Rosati et al., 1996).
Although MS is found in all parts of the world, the prevalence of multiple sclerosis varies considerably around the world. The prevalence is highest in northern Europe, southern Australia, and the middle part of North America and lowest in sub-Saharan Africa and East Asia. There has been a trend toward an increasing prevalence and incidence, particularly in southern Europe (Bufill et al., 1995). MS affects at least twice as many more women than men, suggesting a role of hormones in the disease process. Most people are diagnosed between the ages of 25 and 35, although around three to five per cent of people with MS are diagnosed as children, and it can occur in much older adults. It is rather defined as a complex genetic disease. This is supported by twin studies, in which for monozygous twins the concordance rate is around 30%, and by findings in siblings of affected individuals who carry a risk of about 2%. Most probably, a combination of genetic and also environmental risk factors like smoking contributes to its pathogenesis. The reasons for the variation in the prevalence and incidence of multiple sclerosis worldwide are not understood. Environmental and genetic explanations have been offered, and both factors probably have a role.
Clinical Course And Diagnosis
Multiple sclerosis is a variable condition and the symptoms depend on which areas of the central nervous system have been affected. There is no set pattern to MS and everyone with MS has a different set of symptoms, which vary from time to time and can change in severity and duration, even in the same person. Although the signs and symptoms of MS are completely unpredictable, there are more frequent clinical pattern; the majority of patients present with a sudden onset with subsequent relapses and remissions that lead to a slow deterioration and an incomplete functional recovery; only a minority has a rapidly progressive clinical deterioration. The worsening of the
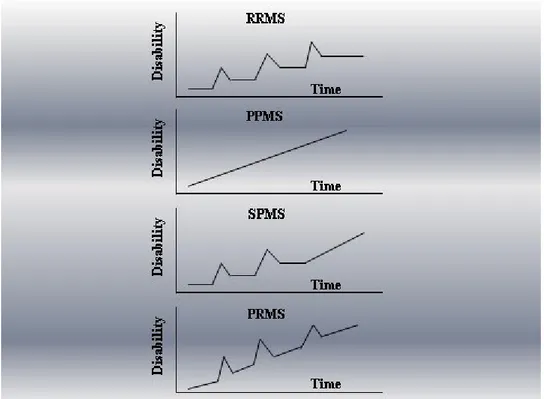
4 disease is the result of two mechanisms: a deterioration caused by the incomplete step recovery of acute injuries and a slow and gradual deterioration that characterizes primarily progressive forms. Based primarily on clinical course, there are four generally recognized subcategories of MS (Figure 1):
Relapsing-remitting MS (RRMS): the most common form, affecting approximately 85% of all MS patients. Characterized by episodic flare-ups (or relapses) of various neurologic symptoms, followed by periods of disease stability (i.e. remission).
Secondary progressive MS (SPMS): develops over time after the diagnosis of RRMS with gradual worsening with or without superimposed relapses.
Primary progressive MS (PPMS): affecting 8-10% of patients, characterized by gradual continuous neurologic deterioration from onset.
Progressive-relapsing MS (PRMS): the least common form, affecting less than 5% of patients. Progressive from onset (similar to PPMS), but with superimposed relapses.
5 In RRMS, symptoms and signs typically evolve over a period of several days, stabilize, and then often improve, spontaneously or in response to corticosteroids, within weeks. Persistent signs of central nervous system dysfunction may develop after a relapse, and the disease may progress between relapses (SPMS). RRMS typically starts with sensory disturbances, unilateral optic neuritis, diplopia (internuclear ophthalmoplegia), Lhermitte’s sign (trunk and limb paresthesias evoked by neck flexion), limb weakness, clumsiness, gait ataxia, and neurogenic bladder and bowel symptoms. Many patients describe fatigue that is worse in the afternoon and is accompanied by physiologic increases in body temperature. The onset of symptoms post partum and symptomatic worsening with increases in body temperature (Uhthoff’s symptom) and pseudoexacerbations with fever suggest the diagnosis. Some patients have recurring, brief, stereotypical phenomena (paroxysmal pain or paresthesias, trigeminal neuralgia, episodic clumsiness or dysarthria, and tonic limb posturing) that are highly suggestive of multiple sclerosis. Prominent cortical signs (aphasia, apraxia, recurrent seizures, visual-field loss, and early dementia) and extrapyramidal phenomena (chorea and rigidity) only rarely dominate the clinical picture. Eventually, cognitive impairment, depression, emotional lability, dysarthria, dysphagia, vertigo, progressive quadriparesis and sensory loss, ataxic tremors, pain, sexual dysfunction, spasticity, and other manifestations of central nervous system dysfunction may become troublesome. Patients who have primary progressive multiple sclerosis often present with a slowly evolving upper motor-neuron syndrome of the legs (“chronic progressive myelopathy”). Typically, this variant worsens gradually, and quadriparesis, cognitive decline, visual loss, brain-stem syndromes, and cerebellar, bowel, bladder, and sexual dysfunction may develop. The diagnosis is based on established clinical and, when necessary, laboratory criteria. Advances in cerebrospinal fluid analysis and MRI, in particular, have simplified the diagnostic process.
The relapsing forms are considered clinically definite when neurologic dysfunction becomes “disseminated in space and time”. Primary progressive multiple sclerosis may be suggested clinically by a progressive course that lasts longer than six months, but laboratory studies to obtain supportive evidence and efforts to exclude other, potentially treatable illnesses are advised; for example, structural or metabolic myelopathy can be identified by appropriate laboratory studies, including spinal MRI.
Cerebrospinal fluid analysis often shows increased intrathecal synthesis of immunoglobulins of restricted specificity (oligoclonal bands may be present, or the synthesis of IgG may be increased), with moderate lymphocytic pleocytosis (almost invariably there are fewer than 50 mononuclear cells).
6 Abnormalities detected by testing of somatosensory evoked potentials and spinal MRI may clarify the diagnosis in patients with optic neuritis alone or isolated brain-stem abnormalities and in those suspected. Of having unifocal cerebral multiple sclerosis on the basis of MRI.
Etiology
The etiology of MS is extremely complex as both genetic predisposition and environmental factors play a crucial role, in conjunction with a failure of immune tolerance mechanisms to suppress and effectively abolish the self-reactive cell.
Researchers have identified particular genes that make some people more susceptible to getting MS, in particular the HLA complex, as containing probably the most important susceptibility gene for MS (Jersild et al., 1973). Since 1973, it has been recognized that the presence of the HLA-DR2 allele substantially increases the risk of multiple sclerosis. HLA class II haplotypes especially HLA-DR2 (DRβ1*1501). DQ6 (DQβ1*0602), DR3 (DRβ1*0301). DQ2 (DQβ1*0201),and DR4 (DRβ1*0401). DQ8 (DQβ1*0302) have shown the strongest association with susceptibility to MS. HLA polymorphism and UVR exposure through sunlight are two important factors linked to predisposition to MS (Bastardo Blanco et al., 2014). HLA-DR and DQ polymorphisms are not associated with the course and severity of multiple sclerosis, despite their substantial contribution to disease susceptibility (Weinshenker et al., 1998).
Recently, variants of the interleukin-1 receptor and interleukin-1 receptor antagonist genes (Schrijver et al., 1999), immunoglobulin Fc receptor genes, and apolipoprotein E gene have been associated with the course of the disease (Myhr et al., 1999).
Role of infectious Agents
Structural similarities between antigens of infectious agents and myelin proteins (molecular mimicry) can induce an activation of naïve autoreactive T cells which recognize peptides derived from infectious agents and self-antigens.
This cross-reactivities may happen frequently. There has been intensive research on possible infectious triggers of MS: it has been shown that T-cell clones specific for an immunodominant epitope of MBP, also recognize viral peptides, e.g., of Epstein Barr virus (EBV), influenza A virus, herpes simplex virus, human papilloma virus, or human herpesvirus-6 (Riedhammer and Weissert, 2015).
7
Immuno-Pathogenesis
Genetic and environmental factors (including viral infection, bacterial lipopolysaccharides, reactive metabolites, oxidative stress) may promote the activation of autoreactive T cells with the involvement of a variety of other immune cells, including macrophages, B-cells, NK cells, cytotoxic T-cells and microglial cells (Weissert, 2013).
MS was originally thought to be a Th1-driven disease, as suggested by observations from an animal model of MS, experimental allergic/autoimmune encephalomyelitis (EAE). (Sriram and Steiner, 2005). However, it was later shown that IL-12 knockout mice (unable to generate Th1 cells) are still susceptible to EAE, whereas IL-23 knockout mice are not (Langrish et al., 2005). This led to the discovery of a new subset of Th cells, Th17, that secrete IL-17, IL-6 and TNF-α . In human MS patients, Th17 cells and also IFN-γ and IL-17 co-expressing Th cells have been detected in cortical lesions, especially the active ones (John et al., 2008).
Effector T helper cells, mainly Th1 and Th17, cytotoxic T-cells, B-cells, macrophages, microglia, and the cytokines they secrete, are implicated in the initiation and maintenance of a deregulated immune response to myelin antigens and the subsequent immune-mediated demyelination.
The pathological hallmark of chronic multiple sclerosis is the demyelinated plaque, consisting of a well-demarcated hypocellular area characterized by the loss of myelin, relative preservation of axons, and the formation of astrocytic scars. These lesions are composed of areas of myelin and oligodendrocyte loss along with infiltrates of inflammatory cells, including lymphocytes and macrophages. Inflammatory cells are typically perivascular, but they may diffusely infiltrate the parenchyma. Although remyelination is minimal in lesions associated with chronic multiple sclerosis, plaques in acute and early multiple sclerosis may have extensive remyelination (Mouzaki et al., 2015).
Possible Mechanisms of Injury and Repair in Multiple Sclerosis.
Activated CD4+ T cells specific for one or more self antigens are believed to adhere to the luminal surface of endothelial cells in CNS venules and migrate into the CNS at the time of disruption of the blood–brain barrier. This process is followed by an amplification of the immune response after the recognition of target antigens on antigen-presenting cells. Local factors that up-regulate the expression of endothelial adhesion molecules, e.g. intercellular adhesion molecule 1 (ICAM-1), vascular-cell adhesion molecule 1 (VCAM-1), and E-selectin, facilitate the entry of T cells into the
8 CNS. Proteases, such as matrix metalloproteinases, may further enhance the migration of autoreactive immune cells by degrading extracellular-matrix macromolecules.
The existence of T cells that are reactive to several putative self myelin and non-myelin “multiple sclerosis antigens,” including myelin basic protein, myelin-associated glycoprotein, myelin oligodendrocyte glycoprotein, proteolipid protein, B-crystallin, phosphodiesterases, and S-100 protein, has been proposed. Additional amplification factors including autoantibodies or cytokines may also be involved in the process of demyelination.
Given that here is an important degree of variability among patients in the structural and immunologic features of the lesions of MS, various pathogenic mechanisms seem to be involved (Lucchinetti et al., 1996): cytokine-mediated injury of oligodendrocytes and myelin; digestion of surface myelin antigens by macrophages; binding of antibodies against myelin and oligodendrocytes (i.e., antibody-dependent cytotoxicity); complement-mediated injury; and direct injury of oligodendrocytes by CD8+ T cells.
The damage of the myelin membrane results in denuded axons that are no longer able to transmit action potentials efficiently within the CNS via loss of saltatory conduction. This slowing down or blocking of the action potential results in the production of neurologic symptoms. The exposed axon segments may be susceptible to further injury from soluble mediators of injury (i.e. cytokines, chemokines, complement, and proteases), resulting in irreversible axonal injury (such as axonal transection and terminal axon ovoids).
Treatment
There is currently no definitive diagnostic test available; therefore, the diagnosis is made largely on clinical evidences, often employing a combination of magnetic resonance imaging (MRI), lumbar puncture (LP), serologic testing, and evoked potentials.
It is important to distinguish clinical relapses from the transient worsening of symptoms that may accompany an increase in body temperature or fatigue. Findings of recent disease activity do not invariably indicate an unfavorable long-term prognosis and that pregnancy does not worsen the long-term outcome. Patients should limit their exposure to viral illnesses because infections may trigger relapses.
In 1993, the United States Food and Drug Administration (FDA) has approved the first disease modifying drug (DMD) for the treatment of RRMS. Interferon beta-1b was a major milestone in MS therapy, serving as the first step in almost three decades of MS drug development. There are
9 now thirteen FDA-approved DMDs for the treatment of RRMS, with several more agents in various stages of development.
Current therapies
Interferons (Interferon ß) have been shown to reduce in RRMS patients the annualized relapse rate (ARR) and new MRI lesions by 50 to 80%. Common adverse effects are liver function abnormalities, leukopenia, depression, Flu-like symptoms along with injection site reactions (Paty et al., 1993). Glatiramer acetate, approved by the FDA in 1996, has been shown to reduce relapse rates by approximately one third over a two year period. Common adverse event associated with glatiramer acetate is injection-site reactions (20-40%). (Johnson et al., 2001). The recombinant humanized monoclonal antibody, Natalizumab, targets the alpha-4 subunit of beta-7 integrins, interfering with leukocyte migration across the blood-brain barrier. It has been shown to reduce by 60% the ARR (Polman et al., 2006; Rudick et al., 2006). Alemtuzumab, a humanized monoclonal antibody targeting CD52, is associated to rapid, long lasting depletion of circulating B and T lymphocytes, followed by a slow repopulation from the unaffected hematopoietic precursor cells. (Wiendl et al., 2013).
Orally administered therapies include: Fingolimod, a sphingosine-1-phosphate (S1P) receptor, including S1PR1. The S1PR1 molecular pathway is essential for cell migration processes, particularly of lymphocytes subtypes expressing the “homing” receptor CCR7, such as naïve and central memory T-cells, Th17 cells, and B-cells. In addition, fingolimod interacts with S1PR1, S1PR3, and S1PR5 expressed by neurons, astrocytes, oligodendrocytes, and microglia, promoting neuroprotective and regenerative events, such as neural stem cell migration, neuronal injury repair, increase of endogenous BDNF, increase in the number of oligodendrocytes progenitors, and remyelination (Gajofatto et al., 2015). Teriflunomide, approved by the FDA in 2012, affects lymphocyte proliferation through blockade of de novo pyrimidine synthesis, interrupting the cell cycle, thus exerting a cytostatic effect on proliferating T and B cells (Loffler et al., 2004; Ruckemann et al., 1998). Dimethyl Fumarate, approved by FDA in 2013 for the treatment of relapsing MS, likely affects the nuclear factor (erythroid derived 2)-like2 (NRF2), a transcription factor that results in transcription of anti-oxidative genes, stimulating the natural anti-inflammatory response of immune cells. (Bomprezzi et al., 2015).
10
The Experimental Allergic Encephalomyelitis (EAE) as the animal model for MS
A model of immunoinflammatory disease of the nervous central system with clinical, histological and immunological characteristics similar to human multiple sclerosis (MS) can be induced in susceptible strains of mice by subcutaneous injection of myelin oligodendrocyte glycoprotein (MOG) (Adelmann et al., 1995; Johns et al., 1995; Kerlero de Rosbo et al., 1995; Slavin et al., 1998). MOG is a minor protein of myelin (0.05–0.1% of the protein content), which is expressed only at the surface of oligodendrocytes (Yamada et al., 1996). Within two weeks after immunization with CFA-MOG emulsion and challenge with pertussis toxin, peripheral immune responses are initiated that subsequently causes inflammation in the CNS (Adelmann et al., 1995; Johns et al., 1995; Kerlero de Rosbo et al., 1995; Fritz et al., 1985). Thereafter, zones of demyelinization can be seen in association with perivascular inflammatory, cell infiltrates and progressively ascending (tail to hind limb[s] to forelimbs) paralysis. MOG-induced EAE can be transferred to syngeneic recipients by injection of T-cell lines bearing specific encephalitogenic MOG peptides (Mendel et al., 1995). Anti-MOG antibodies failed to induce MOG-induced EAE but synergized with MOG-specific T cells to increase the severity of onset of disease (Piddlesden et al., 1993). Whilst EAE induced with MBP or PLP is more often primary-progressive or progressive-remitting, depending on the strain of mice used, EAE induced by the peptide (pMOG35–55develops as primary-progressive form in H2bmice (i.e. C57BL6/J) and as progressive relapsing clinical form in H2Umice.) (Kerlero de Rosbo et al., 1995; Mendel et al., 1995).
The preferential use of MOG-induced EAE as a preclinical model of human MS is validated by the higher frequency with which anti-MOG antibodies are found in the circulation of these patients as compared to anti-MBP or anti-PLP Ab (Lassmann et al., 1988; Linington et al., 1988; Xiao et al., 1991; Reindl et al., 1999).
The PI3K/Akt/mTOR pathway
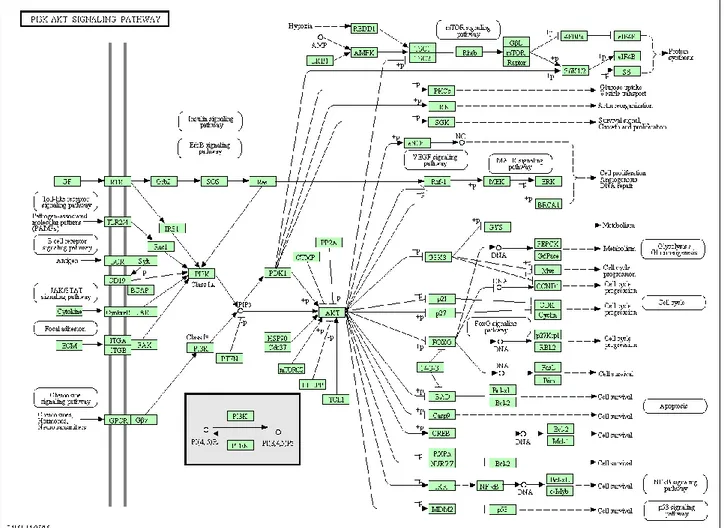
Phosphatidylinositol-3kinase (PI3K) is a heterodimeric protein with an 85-kDa regulatory subunit and a 110-kDa catalytic subunit (PIK3CA) (Franke et al., 1997). PI3K phosphorylates a series of membrane phospholipids including phosphatidylinositol 4-phosphate (PtdIns(4)P) and phosphatidylinositol 4,5-bisphosphate (PtdIns(4,5)P2), by catalyzing the transfer of ATP-derived phosphate to the D-3 position of the inositol ring of membrane phosphoinositides, forming the phosphatidylinositol 3,4-bisphosphate (PtdIns(3,4)P2) and phosphatidylinositol 3,4,5trisphosphate (PtdIns(3,4,5)P3) (Martelli et al., 2010a; Martelli et al., 2010b; Steelman et al., 2011). PI3K is activated via the binding of a ligand to its receptor, allowing p85 to associate with phosphorylated
11 tyrosine residues on the receptor via a Src-homology 2 (SH2) domain. After binding to the receptor, the p110 catalytic subunit transfers phosphate groups to the membrane phospholipids (Martelli et al., 2010a; Martelli et al., 2010b; Steelman et al., 2011). As a consequence, the PtdIns(3,4,5)P3 initiates the signaling cascade (Martelli et al., 2010 a; Martelli et al., 2010b; Steelman et al., 2011). Downstream of PI3K is the Akt/protein kinase B (PKB). Akt contains an amino-terminal pleckstrin homology (PH) domain that allows to target the protein to the membrane for its activation (Franke et al., 1997). Within its central region, Akt present a large kinase domain that is flanked on the carboxy-terminus by hydrophobic and proline-rich regions (Steelman et al., 2011). Akt is activated via the phosphorylation of the T308 and S473 residues. The phosphotidylinositide-dependent kinases (PDKs) are responsible for activation of Akt. Akt is also phosphorylated by the mammalian target of Rapamycin (mTOR) complex referred to as (Rapamycin-insensitive companion of mTOR /mLST8 complex) mTORC2 (Martelli et al., 2010 a; Martelli et al., 2010b; Steelman et al., 2011). After activation, Akt is able to translocate to the nucleus (Martelli et al., 2010 a; Martelli et al., 2010b; Steelman et al., 2011) where it affects the activity of a number of transcriptional regulators including CREB, E2F, nuclear factor kappa from B cells (NF-κB) via inhibitor kappa B protein kinase (Iκ-K), the forkhead transcription factors and murine double minute 2 (MDM2) which regulates p53 activity (Martelli et al., 2010 a; Martelli et al., 2010b; Steelman et al., 2011). Akt is also able to target other molecules to affect the survival state of the cell, such as the pro-apoptotic molecule Bcl-2-associated death promoter (BAD), and glycogen-synthase k inase-3ß (GSK-3ß) (Martelli et al., 2010 a; Martelli et al., 2010b; Steelman et al., 2011). GSK-3ß regulates beta-catenin protein stability. Negative regulation of the PI3K pathway is exerted by the action of the phosphatase and tensin homologue deleted on chromosome ten (PTEN) tumor suppressor proteins.
PTEN encodes a lipid and protein phosphatase whose primary lipid substrate is PtdIns(3,4,5)P3
(Chalhoub et al., 2009; Silva et al., 2008). PTEN presents four primary structural domains. On the amino terminus, is the lipid and protein phosphatase domain, flanked adjacent to the C2 domain responsible for lipid binding and membrane localization. Next are two protein sequences rich in proline (P), glutamic acid (E), serine (S), and threonine (T) (PEST) domains that regulate protein stability. Lastly, PTEN has a PDZ domain, that facilitates protein-protein interactions (Chalhoub et al., 2009; Silva et al., 2008). Another negative regulator of the PI3K pathway is the PH domain leucine-rich repeat protein phosphatase (PHLPP). PHLPP dephosphorylates S473 on Akt which induces apoptosis and inhibits tumor growth (Gao et al., 2005). Two other phosphatases, SH2 domain-containing inositol 5’phosphatase (SHIP)-1 and SHIP-2, remove the 5 phosphate from PtdIns(3,4,5)P3 to produce PtdIns(3,4)P2 (Damen et al., 1996). Akt inhibits tuberous sclerosis 2 (TSC2 or hamartin) function through direct phosphorylation (Martelli et al., 2010 a; Martelli et al.,
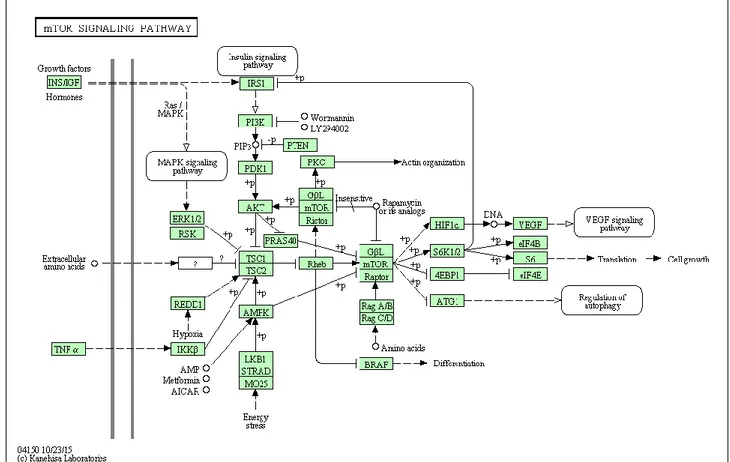
12 2010b; Steelman et al., 2011). TSC2 is a GTPase-activating protein (GAP) that functions in association with the tuberous sclerosis 1 (TSC1 or tuberin) to inactivate the small G protein Rheb (Martelli et al., 2010 a; Martelli et al., 2010b; Steelman et al., 2011). TSC2 phosphorylation by Akt represses GAP activity of the TSC1/TSC2 complex, allowing Rheb to accumulate in a GTP-bound state. Rheb-GTP then activates, the protein kinase activity of mTOR when complexes with the Raptor (Regulatory associated protein of mTOR) adaptor protein, DEPTOR and mLST8, a member of the Lethal-with-Sec-Thirteen gene family (Martelli et al., 2010 a; Martelli et al., 2010b; Steelman et al., 2011). The mTOR/Raptor/mLST8 complex (mTORC1) is sensitive to rapamycin and inhibits Akt via a negative feedback loop which involves the p70S6K (Steelman et al., 2011). Akt also phosphorylates proline-rich Akt substrate-40 (PRAS40), an inhibitor of mTORC1, thus preventing the ability of PRAS40 to suppress mTORC1 signalling (Martelli et al., 2010 a; Martelli et al., 2010b; Steelman et al., 2011). Moreover, PRAS40 is a substrate of mTORC1 itself, and the mTORC1-mediated phosphorylation of PRAS40 facilitates the removal of its inhibition on downstream signaling of mTORC1 (Martelli et al., 2010 a; Martelli et al., 2010b; Steelman et al., 2011). Also p90 Rsk-1 and ERK 1/ 2 phosphorylate TSC2, suppressing its inhibitory function (Martelli et al., 2010 a; Martelli et al., 2010b; Steelman et al., 2011). Moreover, the mTOR/Rictor complex (mTORC2), which shows rapamycin-insensitive activity, directly phosphorylates Akt on S473 in vitro and promotes T308 phosphorylation (Hresko and Mueckler, 2005) (Figures 2-3). mTOR is a 289-kDa S/T kinase that regulates translation in response to nutrients and growth factors by phosphorylating components of the protein synthesis machinery, including p70 S6K and eukaryotic initiation factor (eIF)-4E binding protein-1 (4EBP-1), the latter resulting in the release of the eukaryotic initiation factor-4E (eIF-4E), allowing eIF-4E to be involved in the assembly of a translational initiation complex (Martelli et al., 2010 a; Martelli et al., 2010b; Steelman et al., 2011). p70S6K phosphorylates the 40S ribosomal protein S6 (rpS6), leading to active translation of mRNAs (Martelli et al., 2010 a; Martelli et al., 2010b; Steelman et al., 2011). In doing so, mTOR controls the production of key molecules such as c-Myc, cyclin D1, p27, and retinoblastoma protein (pRb) (Steelman et al., 2011) and cell growth and hypertrophy. The mRNAs encoding these genes contain 5’untranslated regions which are G+C rich and difficult to translate and referred to as weak mRNAs (Steelman et al., 2011). 4EP-B1 forms a complex with these mRNAs and other binding factors allowing the translation of these weak mRNAs (Steelman et al., 2011) (Figures 2-3).
13
14
15
The PI3K/Akt/mTOR pathway in the adaptive immune response
The PI3K/Akt/mTOR signalling pathway is strictly involved in T cell responses. Both mTORC1 and mTORC2 are activated after TCR stimulation and the magnitude of mTOR activation is directly correlated with the duration of interaction between T cells and APCs. Moreover, the activation level of this pathway is further influenced by costimulatory signals exerted by CD28 and OX40. CD28 co-stimulation is a classic PI3K–Akt activating signal that in turn upregulates mTOR activity induced by TCR, to promote T cell priming and activation (Colombetti et al., 2006; Zheng et al., 2007; Zheng et al., 2009). TCR and CD28 activate the PI3K/PKB pathway and the phosphorylation the of 70-kDa S6 kinase (p70S6k) (Pai et al., 1994; Parry et al., 1997), which promotes the E2F dependent transcription of genes required for S phase entry, such as cyclin E (Brennen et al., 1999). Also, CD28-induced PI3K/PKB activation promotes the down-regulation of the cyclin kinase inhibitor p27Kip, allowing cyclin-dependent kinase Cdk4/Cdk6 activation cell cycle progression (Appleman et al., 2002).
Colombetti and collaborators have found that PI3K and mTOR control, although to a different extent, the CD3/CD28-driven as well as the IL-2-driven proliferation. Indeed, either the PI3K inhibitor, LY294002, or rapamycin prevented the CD3/CD28-induced proliferation of T cells capable of limited autocrine IL-2 production (A.E7 T cells and IL-2−/− DO11.10 T cells). This observation suggests that the activity of both PI3K and of the mTOR/GβL/raptor complex is necessary to sustain the TCR/CD28-driven, IL-2-independent cell proliferation. In contrast, neither LY294002 nor rapamycin were able to abolish the CD3/CD28-induced proliferation of T cells capable of autocrine IL-2 secretion. This is suggestive of the fact that although the TCR/CD28-driven, independent T cell proliferation relies on both PI3K and mTOR signaling, the IL-2-induced proliferation is independently regulated by PI3K and mTOR (Colombetti et al., 2006). Whether TCR engagement leads to activation or tolerance is determined by multiple signals, cytokines, and environmental cues and mTOR integrates these signals determining the outcome of TCR engagement. In vitro, antigen recognition in the setting of mTOR activation leads to full immune responses, whereas recognition in the setting of mTOR inhibition results in anergy. Full T cell activation is associated with an increase in the phosphorylation of the downstream mTOR target S6 kinase 1 at Thr421/Ser424 and an increase in the mTOR-dependent cell surface expression of transferrin receptor (CD71). On the contrary, the induction of anergy is associated in markedly less S6 kinase 1 Thr421/Ser424 phosphorylation and CD71 surface expression. In accordance, T cells engineered to express a rapamycin-resistant mTOR construct are resistant to anergy induction caused by rapamycin. In vivo, mTOR inhibition promotes T cell anergy under conditions that would normally induce priming (Zheng et al.,2007; Zheng et al., 2009). Similarly, OX40 assembles a
16 signaling complex by recruiting PI3K–Akt to increase Akt signaling (So et al., 2011). CD4 T cells that lack OX40 do not sustain PI3K activity and PKB signaling over time after antigen encounter, which correlate with impaired expansion and survival of effector cells and scarce generation of T cell memory (So et al., 2011). Along the same lines, the PD1–PDL1 axis, which is known to mediate immune tolerance, downregulates mTOR signalling (Francisco et al., 2009). Significantly reduced levels of Akt and mTOR phosphorylation are observed when naive T cells are cultured in the presence of increasing quantities of PD-L1. In addition, PD-L1 up-regulates the expression of PTEN (phosphatase and tensin homologue deleted on chromosome 10), a phosphoinositol 3,4,5-triphosphatase important for antagonizing PI3K signaling.
Increasing body of data suggests the key role of the mTOR in the determination of cell fate and polarization of antigen-activated CD4+ and CD8+ T cells. Indeed, mtor-/- T cells although showing normal TCR-induced activation, are not able to polarize into Th1, Th2 and Th17 effector cells (Delgoffe et al., 2009; Delgoffe et al., 2011). Along the same line, deficiency of RHEB, and consequent the of mTORC1 activity, results in impaired Th1 and Th17 cell differentiation (Han et al., 2012). Moreover, complete loss of PTEN in T cells impairs central tolerance as well as peripheral tolerance (Suzuki et al., 2001) and the induction of forkhead box P3 (FOXP3) expression (Sauer et al., 2008). Pharmacological inhibition of mTOR promotes induction of anergic and regulatory CD4+ T cells, as well as differentiation of memory CD8+ T cells (Araki et al., 2010). Lee and collaborators have showed that deletion of rictor, an essential subunit of mTORC2, impaired differentiation into T helper 1 (Th1) and Th2 cells without substantial effects on Treg cell and Th17 cell differentiation. They also showed that activated Akt restored T-bet transcription factor expression and Th1 cell differentiation, whereas activated PKC-theta reverted GATA3 transcription factor and the Th2 cell defect of mTORC2 mutant cells (Lee et al., 2010). Delgoffe and collaborators have demonstrated that differentiation into the Th1 and Th17 was selectively regulated by mTORC1, that was dependent on the small GTPase Rheb. Rheb-deficient T cells failed to generate Th1 and Th17 responses but retained their ability to become Th2 cells. Alternatively, when mTORC2 signaling was deleted from T cells, they failed to generate Th2 cells while preserving the ability to become Th1 and Th17 cells. As regards T regulatory (Treg) cells, genetic deletion of mTOR in CD4 T cells has shown that loss of both mTORC1 and mTORC2 signaling results in a default Treg phenotype upon T cell activation (Delgoffe et al., 2009).
In B cells, mTOR plays a role in controlling IL-7 signaling at the pro-B stage (Brown et al., 2003). Deletion of SIN1, an essential component of mTORC2, enhanced IL-7R expression and increased pro-B cell survival (Lazorchak et al., 2010). Deletion of the mTOR gene in mouse B cells strongly
17 impairs proliferation and germinal center differentiation (Zhang et al., 2013). Inactivation of mTORC2 in B cells, via rictor deletion, reduces mature B-cell survival and impairs antibody responses and germinal center formation (Lee et al., 2013). Rapamycin markedly impairs proliferation of both mouse and human B cells and suppresses antibody responses (Aagaard-Tillery and Jelinek, 1994; Janes et al., 2010). Partial rictor deletion allows B cells to survive and proliferate, and lead to enhanced class switching. The results we obtained with rapamycin titrations are consistent with recent evidence that mTORC1 inhibition can suppress class switching recombination, independent of proliferation (Keating et al., 2013). When both complexes are partially inhibited, the effect of mTORC2 inhibition is dominant for class switching recombination (enhancement), whereas mTORC1 inhibition is dominant for antibody-secreting cell generation (inhibition). Therefore, mTOR inhibitors can improve humoral immune responses, increasing antigen-specific IgG1.
The PI3K/Akt/mTOR pathway in autoimmune diseases
Increasing body of data suggests that alterations in the PI3K/Akt/mTOR pathway may result in an enhanced susceptibility to autoimmunity. This was first suggested by the observation that the p110δ D910A mice develop inflammatory bowel disease (Okkenhaug et al., 2002) and have an impaired Treg function (Patton et al. 2006). Along the same lines, the r1∆Τ/r2n mice (bearing floxed alleles of the PI3K regulatory subunits p85alpha, p55alpha and p50 alpha and lacking p85beta) also develop an autoimmune syndrome characterized by lymphocyte infiltration into the lacrimal and salivary glands and serum antinuclear antibodies, mostly with a specific reactivity towards SS-A and SS-B antigens, thus resembling the human Sjogren’s syndrome (Oak et al., 2006).
Moreover, Camps and collaborators (Camps et al., 2005) have showed that the Pik3cg-/- mice are significantly protected from aCII-induced arthritis (aCII-IA), mainly due to an impaired neutrophil chemotaxis. Also, AS-605240, an orally active small-molecule inhibitor of PI3Kg, suppressed the progression of joint inflammation and damage in both independent and lymphocyte-dependent mouse models of rheumatoid arthritis. mTORC1 inhibition has shown to significantly improve, both in preclinical models and in humans, the course of autoimmune diseases, such as EAE (Donia et al., 2009), myositis (Prevel et al., 2013), uveoretinitis (Hennig et al., 2012), T1DM (Esposito et al., 2010; Donia et al., 2009; Baeder et al., 1992) and hepatitis (Ytting and Larsen, 2015).
18 mTOR is also crucial in the development of synovitis and structural damage in inflammatory arthritis (Cejka et al., 2010). Inhibition of mTOR reduces synovial osteoclast formation in patients with rheumatoid arthritis (RA), and is effective in protecting joints against structural damage. In SLE patients, mTORC1 is activated (Fernandez et al., 2009; Lai et al., 2012), whereas mTORC2 is reduced (Kato et al., 2014). In addition, Rapamycin treatment reduced mTORC1 and enhanced mTORC2 activities of lupus T cells in vitro (Kato et al., 2014). Diminished expression of FoxP3 in T cells may be attributable to reduced mTORC2 activity in lupus Treg cells (Kato et al., 2014; Shrestha et al., 2015; Tay and Craft, 2015). Rapamycin treatment reduces the production of IL-4 by T cells (Lai et al., 2013), which accounts for increased production of anti-DNA auto-antibodies by B cells (Sieling et al., 2000). The benefit of rapamycin may also be attributed to Treg expansion via activation of mTORC2. Finally, it has been reported that in NZBW/F1 female mice, a mouse model of lupus nephritis, Akt and mTOR are over-expressed and phosphorylated at key activating residues and that treatment with Rapamycin is able to prolong survival, maintaine normal renal function, reduce anti-dsDNA levels and ameliorate the histopathological damage (Stylianou et al., 2011).
Inhibitors targeting the PI3K/Akt/mTOR Pathway
Inhibitors of downstream mTOR include: rapamycin (WyethPfizer, sirolimus) and modified rapamycins (rapalogs) (CCI-779, torisel, temsirolimus, Wyeth-Pfizer), AP-23573 (ridaforolimus, Ariad-Merck) and RAD001 (afinitor, everolimus, Novartis). Rapamycin and the modified rapalogs are mTORC1 inhibitors. Several PI3K inhibitors have been developed and tested, including LY-294002 (Lilly), Wortmannin, PX-866 (Oncothyreon), GDC-0941 (Genentech), CAL-101 (Calistoga Pharmaceuticals), XL-147 and XL-765 (Exelixis and Sanofi-Aventis). Dual PI3K/mTOR inhibitors include NVP-BEZ235 and NVP-BTG226 (Novartis), PKI-402, PKI-587 and PF-04691502 (Pfizer), XL765 (Exelixis/Sanofi-Aventis), GNE-477 (Genentech). Various Akt inhibitors have been produced, including: A-443654 (Abbott Laboratories), GSK690693 (GlaxoSmithKline), VQD-002 (a.k.a. API-2, VioQuest Pharmaceuticals), KP372-1 (QLT, Inc), perifosine (AEterna Zentaris/Keryx Biopharmaceuticals) and MK2206 (Merck). Most of these drugs are currently tested for the treatment of numerous solid and hematological malignancies. (Chappel et al., 2011; McCubrey et al., 2011; McCubrey et al., 2012)
19
mTORC1 Inhibitors
Rapamycin/rapalogs act as allosteric mTORC1 inhibitors and do not directly affect the mTOR catalytic site. Rapamycin (Rapamune, Pfizer) has been approved by the FDA in 1999 to prevent rejection in organ transplant patients. Rapamycin/rapalogs associate with the FK506 binding protein 12 (FKBP-12) and by doing so, they induce disassembly of mTORC1, resulting in repression of its activity. Rapamycins are being considered as anti-aging and anti-obestity drugs as well as to prevent diabetic neuropathy and have been examined in clinical trials with patients having various cancers, such as brain, breast, HCC, leukemia, lymphoma, MM, NSCLC, pancreatic, prostate, and RCC. The rapalogs torisel (Pfizer) amd afinitor (Novartis) were approved to treat RCC patients. Torisel was also approved to treat Mantel cell lymphoma patients and Afinitor to treat subependymal giant cell astrocytoma tumors in tuberous sclerosis (TS) patients and to treat patients with pancreatic neuroendocrine tumors. Ridaforolimus (a.k.a. AP23573 and MK8669; formerly known as deforolimus) is a rapalog developed by ARIAD and Merck, evaluated in clinical trials in patients with metastatic soft-tissue or bone sarcomas. Recently the capacity of rapamycin and rapalog to treat viral infections including AIDS has been considered.
mTOR Inhibitors
Small molecules designed for inhibiting the catalytic site of mTOR have shown promising effects on suppression of signaling downstream of mTOR. mTOR kinase inhibitor have been developed which directly inhibit mTORC1 and mTORC2. The mTOR kinase inhibitors have advantages over rapamycin and rapalogs as the mTOR inhibitors will inhibit both mTORC1 and mTORC2 while rapamycin and rapalogs predominantly inhibit mTORC1. Also the mTOR kinases inhibitors do not induce the feedback pathways which result in Akt activation. OSI-027 is a pan mTOR inhibitor developed by OSI Pharmaceuticals/Astellas Pharma Inc. OSI-027 is effective in inducing apoptosis in different types of cancer, including breast and leukemias. OSI027 has been evaluated in a clinical trial (NCT00698243) with patients with advanced solid tumors and lymphoma. PP-242 is a potent inhibitor of both mTORC1 and mTORC2 developed by Intellikine. INK-128 is a derivative of PP-242 which has shown anti-tumoral effects on multiple cancer types including RCC, MM, NHL and prostate neoplasia. INK-128 is in phase I clinical trials (NCT01118689) for patients with relapsed or refractory MM or Waldenstrom macroglobulinemia or patients with solid malignancies (NCT01058707). AZD8055 and AZD2014 are pan mTOR inhibitors with potent anti-tumor activity that have been developed by AstraZenica, currently evaluated in a clinical trial (NCT01316809). Palomid 529 (Paloma Pharmaceuticals) is a pan-mTOR inhibitor which has potent anti-tumor
20 affects and reduces tumor angiogenesis and vascular permeability. It is undergoing phase I clinical trials for patients with macular degeneration (NCT01033721). WAY600, WYE353, WYE687 and WYE132 have been developed by Wyeth (Pfizer). WYE132 has 5000-fold greater selectivity for mTOR over PI3K and it determines tumor regression in breast, glioma, lung, renal tumors. Other mTOR inhibitors include: Ku0063794 (KuDOS Pharmaceuticals) and OXA-01 (OSI Pharmaceuticals), Torin2, TORKiCC223 (Celgene). Metformin is an indirect inhibitor of mTORC1, since it induces AMPK which turns on TSC1 which suppresses mTORC1 activity.
PI3K Inhibitors
Two isoform-nonselective PI3K inhibitors are the fungal metabolite wortmannin and LY294002. Wortmannin is an irreversible inhibitor which forms a covalent bond with a conserved lysine residue involved in the phosphate-binding reaction, while LY294002 is a reversible, ATP-competitive, PI3K modulator. These molecules also non selectively inhibit other lipid and protein kinases (for example, LY294002 inhibits mTOR, casein kinase 2 (CK2), DNA dependent protein kinase (DNA-PK). The modified wortmannin, PX-866 is a PI3K inhibitor currently being evaluated in approximately five clinical trials for prostate cancer, melanoma, CRC, NSCLC, squamous cell carcinoma of the head and neck, glioblastoma and other advanced cancers. GDC-0941 is a PI3K inhibitor developed by Genentech, which has been found to inhibit the metastatic characteristics of thyroid carcinomas by targeting both PI3K and hypoxia-inducible factor-1alpha (HIF-1-alpha) pathways. IC87114 is a selective p110-delta PI3K inhibitor. It has been in clinical trials to treat AML patients (NCT00004263 and NCT00301938). It decreased cell proliferation and survival in AML cells, and increased sensitivity to etoposide. CAL-101(GS-1101), a derivative of IC-87114, is an oral p110-delta PI3K inhibitor developed by Calistoga Pharmaceuticals and Gilead Sciences. CAL-101 is currently undergoing clinical evaluation in patients with relapsed or refractory indolent B-cell NHL, mantle cell lymphoma or CLL. It has been found that CAL101 inhibited the production of inflammatory cytokines, such as interleukin-6 (IL-6), IL-10, tumor necrosis factor (TNF)-alpha (produced by T-lymphocytes), and interferon (IFN)-gamma (synthesized by NK lymphocytes). XL-147 (SAR245408) is a PI3K inhibitor developed by Exelixis/Sanofi-Aventis currently evaluated in at least 11 clinical trials, either as a single agent or in combination, for various cancers. NVP-BKM120 (BKM120) is an orally available pan-class I PI3K inhibitor developed by Novartis evaluated in at least 36 clinical trials with patients having advanced cancers such as CRC, NSCLC, breast, prostate, endometrial, squamous cell carcinoma of the head and neck, GIST, RCC, melanoma and advanced leukemias. NVP-BYL719 (BYL719) is a PI3K-alpha
21 selective inhibitor developed by Novartis, currently in clinical trials for patients with advanced solid tumors (NCT0138732, NCT01219699, NCT01449058).
Dual PI3K/mTOR Inhibitors
The catalytic sites of PI3K and mTOR share a high degree of sequence homology. This feature has allowed the synthesis of ATP-competitive molecules that target the catalytic site of both PI3K and mTOR. Several dual PI3K/mTOR inhibitors have been developed. In contrast to rapamycin/rapalogs, dual PI3K/mTOR inhibitors target both mTOR complex 1 and mTOR complex 2, inhibit the rapamycin resistant phosphorylation of eIF4B-1 and protein translation of many gene products. Also, they strongly reducethe proliferation rate and induce an important apoptotic response. Dual PI3K/mTOR inhibitors have demonstrated significant, concentration-dependent cell proliferation inhibition and induction of apoptosis in a broad panel of tumor cell lines. They are well tolerated and achieved disease stasis or even tumor regression when administered orally in the preclinical setting. The effects of detrimental Akt activation by mTOR inhibition might be avoided upon treatment with a dual kinase inhibitor. In addition, the negative side effects of mTOR inhibition on the activation of the Raf/MEK/ERK pathway might be eliminated with the PI3K inhibitor activity in the dual inhibitor. However, potential toxicity may arise from the fact that PI3K and mTOR are fundamental to a broad range of physiological processes. PI-103 is the first in class ATP-competitive kinase inhibitor of mTOR which also blocked the enzymatic activity of PI3K p110 isoforms. NVP-BEZ235 is a dual PI3K/mTOR inhibitor developed by Novartis, which has been found to suppress the proliferation and to induce important apoptotic responses in AML cells without affecting healthy CD34L cell survival. Importantly, it suppresses the clonogenic activity of leukemic, but not healthy, CD34 cells. The drug also induces apoptosis, and inhibited both mTORC1 and mTORC2 signaling. However, it has been reported that NVP-BEZ235 seems to induce an over activation of MEK/ERK signaling, most likely due to compensatory feedback mechanism that involves p70S6K. NVP-BEZ235 has been evaluated in at least eight clinical trials for patients with advanced cancers. NVP-BTG226 is a recently developed PI3K/mTOR inhibitor by Novartis. PKI-587 is a PI3K/mTOR inhibitor developed by Pfizer, a.k.a. PF-05212384, and it inhibits class I PI3Ks, PI3K-alpha mutants, and mTOR. PKI-587 inhibits the tumor growth in various models including: breast (MDA-MB-361, BT474), colon (HCT116), lung (H1975), and glioma (U87MG). PF-04691502 is an ATP competitive PI3K/Akt inhibitor developed by Pfizer which suppresses activation of Akt. Both PKI-587 and PF-04691502 are in clinical trials for patients with endometrial cancers (NCT01420081). PKI-402 is a selective, reversible,
ATP-22 competitive, PI3K and mTOR inhibitor developed by Pfizer. It suppresses mutant PI3K-alpha and mTOR equally. PKI402 inhibited the growth of many human tumor cell lines including: breast, glioma, pancreatic, and NSCLC. XL765 (SAR25409) is a dual PI3K/mTOR inhibitor developed by Exelixis/Sanofi-Aventis. XL765, downregulated the phosphorylation of Akt induced by PI3K/mTORC2 and reduced brain tumor growth. GNE-477 is a dual PI3K/mTOR inhibitor developed by Genentech and GDC-0980 is similar to GNE-477 and exerts high activity in cancer models. GDC-0980 is in a clinical trial for patients with advanced cancers or metastatic breast cancers which are resistant to aromatase inhibitor therapy (NCT01437566). GSK2126458 is a dual PI3K/mTOR inhibitor developed by GSK. It is in at least two clinical trials with advanced cancer patients. WJD008 (Chinese Academy of Sciences, Shanghai) is a dual PI3K/mTOR which showed to inhibit the increased activity of the PI3K pathway normally induced by PIK3CA H1047R and suppressed proliferation and colony formation of transformed RK3E cells containing PIK3CA H1047R.
Akt Inhibitors
Triciribine (API-2) is an Akt inhibitor that has been used in at least 92 studies (www.ClinicalTrials.gov). Triciribine suppresses the phosphorylation of all three Akt isoforms in vitro and the growth of tumor cells overexpressing Akt in mouse xenograft and it has been evaluated in a phase I clinical trial in patients with advanced hematologic malignancies. MK-2206 (Merck) is an allosteric Akt inhibitor which inhibits both T308 and S473 phosphorylation. MK-2206 decreases T-acute lymphocytic leukemia (T-ALL) cell viability by the blocking the cells in the G0/G1 phase of the cell cycle and inducing apoptosis and autophagy in the T-ALL cells. MK-2206 induces a concentration-dependent dephosphorylation of Akt and its downstream targets, GSK-3-alpha/beta and FOXO3A. GSK690693 is an ATP-competitive, pan-Akt inhibitor developed by GSK, effective at the low-nanomolar range. GSK690693 does not inhibit the proliferation of normal human CD4 peripheral T lymphocytes as well as mouse thymocytes. GSK2141795 is an Akt inhibitor from GSK reported to be an oral, pan Akt inhibitor with activity in various cancer models. KP372-1 (QLT, Vancouver, Canada) inhibits PDK1, Akt and Fms-like tyrosine kinase 3 (Flt-3) signaling and induces mitochondrial dysfunction and apoptosis in AML cells but not normal hematopoietic progenitor cells. Enzasturin (LY317615) is a protein kinase C-beta (PKC-beta) and Akt inhibitor developed by Lilly. Perifosine (KRX-0401, Keryx/ AOI Pharmaceuticals, Inc. and licensed to AEterna Zentaris) is an alkylphospholipid that can inhibit Akt. Perifosine induces caspase-dependent apoptosis and downregulates P-glycoprotein expression in multidrugresistant
T-23 ALL cells by a JNK-dependent mechanism and it has been evaluated in at least 43 clinical trials to treat various cancer patients, with either blood cancers or solid tumors. Erucylphosphocholine (ErPC) and erucylphosphohomocholine (ErPC3), structurally related to perifosine, have been shown to inhibit Akt and induce apoptosis in malignant glioma cell lines which are normally resistant to the induction of apoptosis. PBI-05204 (oleandrin) is an Akt inhibitor, derived from Nerium oleander and developed by Phoenix Biotechnology, which also targets FGF-2, NF-kB, and p70S6K. PBI-05204 is in clinical trials for cancer patients with advanced solid tumors. Interesting PBI-05204 also provides significant neuroprotection to tissues damaged by glucose and oxygen deprivation which occurs in ischemic stroke. XL-418 is reported to be a dual Akt/p70S6K inhibitor by developed by Exelixis/GSK. It was in clinical trials for patients with advanced cancer, however those trials were suspended.
24
AIM OF THE STUDY
Aim of our work is to evaluate the involvement of the mTOR pathway in the pathogenesis of autoimmune diseases, with particular focus on Multiple Sclerosis (MS). Drugs targeting the PI3K/Akt/mTOR pathway are currently under extensive investigation for their possible use as cancer chemotherapics and as immunesuppressive agents, but no clinical trial has been so far approved for the evaluation of their efficacy in the context of immunological disorders.
The identification of novel disease indications for approved drugs, a.k.a. drug repositioning, offers several advantages over traditional drug development (Ashburn et al., 2004). Indeed, drug discovery is generally protracted and costly, taking on average approximately 15 years and over $1 billion to develop and bring a novel drug to the market (Di Masi et al., 2003). A large part of drug development costs are employed during early development and toxicity testing, with more than 90% of drugs failing to move beyond these early stages (Chong et al., 2007). The repositioning of drugs already approved for human use cuts the costs and risks associated with early stages of drug development, and offers shorter paths to approval for novel therapeutic indications.
Gene expression microarrays (Schena et al., 1995; Lipshutz et al., 1995) allows for the evaluation of genome wide expression levels, and they are broadly applied in studies of human diseases. The comparative gene expression analysis of primary affected cells and tissues is used to study the molecular pathophysiology of a disease and by examining the sets of genes that are significantly modulated in a disease as compared to a healthy condition, it is possible to create a molecular profile, or gene signature, of a disease (Yap et al., 2007; Milano et al., 2008; Wang et al., 2008). Microarrays are also used to uncover the complete gene expression patterns that characterize the modulation of cell homeostasis upon drug administration (Li et al., 2007; Fichtner et al., 2004). Recently, a collection of genome-wide expression data from cells treated with a range of FDA approved drugs has been used to connect genes, disease and small molecule effects (Lamb et al., 2006).
In the current study, we have undertaken two in silico approaches to evaluate the potential use of Rapamycin in the context of Multiple Sclerosis (MS). The first approach was aimed at evaluating the involvement of the mTOR network on the generation and progression of MS. The second approach evaluated whether genes modulated by Sirolimus were among those observed to be altered in the disease (Figure 4). The hypothesis underlying this approach is that if a drug affects the expression of genes oppositely modulated in a disease, that drug has the potential to be used for the
25 treatment of that disease. The higher the number of genes that are upregulated in the disease and downregulated by the drugs, and viceversa, the stronger the putative indication of using the drug in that clinical setting. A similar approach was applied by Sirota and collegues (Sirota et al., 2011), identifying a strong therapeutic score for Topiramate in Crohn’s disease and ulcerative colitis, a data confirmed in an independent study using a TNBS rat model of colitis (Dudley and Sirota, 2011).
Next, we wanted to evaluated the involvement of the mTOR network on oligondendrocyte function, in order to ascertain whether treatment with drugs targeting the PI3K/Akt/mTOR pathway may be useful to promote the remyelination process, so to reverse disability in MS patients.
Finally, the data generated in silico were subjected to an ex-vivo evaluation. To this aims the involvement of mTOR was validated first on a well-known and established animal model of MS in the mouse, the MOG-induced EAE model (Figure 4). Then, given the role of Th17 cells in the pathogenesis of EAE/MS, we determined whether mTORC1 inhibition via Rapamycin treatment on CD4 T cells upon Th17 conditions, was able to modulate the expression levels of the genes previously identified in the in silico analysis.
26
27
MATERIALS AND METHODS
In silico analysis
Generation of the MS “Disease gene signature” and of Rapamycin “Drug regulated genes”
Expression datasets for disease and drug effects were obtained from the NCBI Gene Expression Omnibus (GEO, http://www.ncbi.nlm.nih.gov/geo/), an international public repository for high-throughput microarray and next-generation sequence functional genomic data sets submitted by the research community. Together with ArrayExpress (Parkinson et al., 2011), data for >1 million samples are currently available in the public domain. MESH terms “Multiple Sclerosis” and “Rapamycin” were used to identify potential datasets of interest and GSE29606, GSE38645 and GSE21942 were chosen for the analysis. GSE29606 and GSE38645 were selected for the main analysis because they were both generated on sorted CD4+ T cells. GSE21942 was chosen because it was the only available dataset on drug-naïve MS patients. The GEO2R web application was used for identifying differentially expressed genes. In cases where multiple microarray probes mapped to the same NCBI GeneID, we chose the probes which showed the maximum variance. On each data set, we performed moderate t statistics to generate a list of up-regulated and down-regulated genes. We used a threshold of p<0.05 and fold change>1.5. The list of significantly up and down regulated genes for each comparison were considered for further analysis.
Generation of the mTOR “Regulatory molecular network”
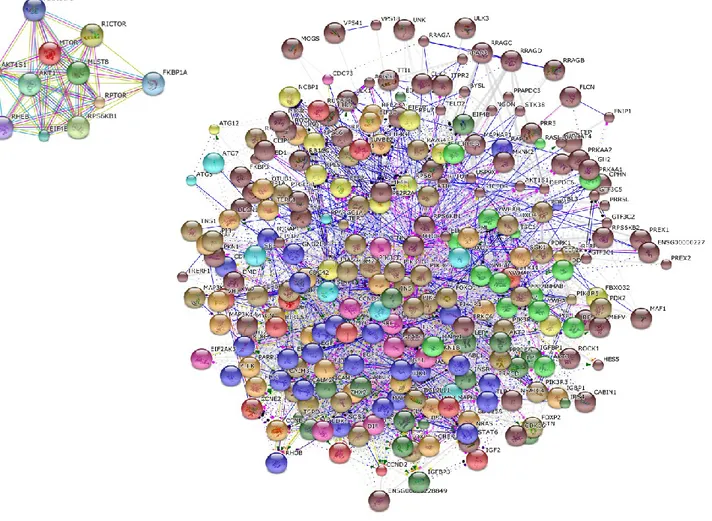
Highly complex phenotypes arise from a relatively restricted set of gene families by a tightly regulated network of interactions among the proteins encoded by the genes. The STRING database (http://string-db.org/) allows to have access to a global view of all the available interaction data by creating large networks, which captures the current knowledge on the functional modularity and interconnectivity of genes in a cell. The majority of associations generated with STRING derive from predictions which are based on analyzing genomic information or from transferring associations/interactions between organisms. All associations are provided with a confidence score that represents a rough estimate of how likely a given association describes a functional linkage between two proteins. For the current study, the search term “mtor” was used to generate a network, using a confidence score of 0.7 and by including no more than 20 interactors per gene. Clustering was performed for 10 clusters by using the KMEANS algorithm.
28
Dataset selection and analysis of oligodendrocyte damage and remyelination processes
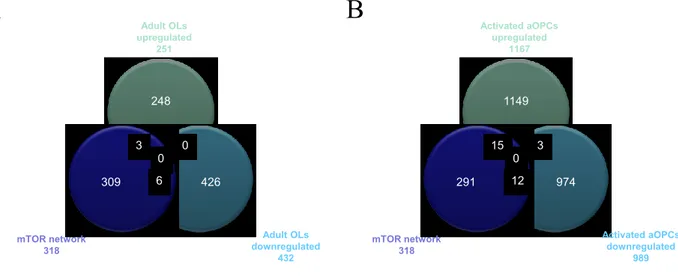
Expression datasets were obtained from the NCBI Gene Expression Omnibus (GEO, http://www.ncbi.nlm.nih.gov/geo/). GSE32645 and GSE48872 were chosen for the analysis. From GSE32645, we selected the three active MS lesions samples (one fulminant active lesion and two chronic active lesions), and the three cortex samples from controls without brain pathology. Complete demographic data of patients and controls can be obtained from the relative publication (Fischer et al., 2013). GSE48872 included gene expression profiles from neonatal oligodendrocyte precursors (nOPCs) and adult OPCs isolated from the brain of postnatal (day 1 to day 5) and 2-month-old mice, while adult OPCs in demyelinating conditions (activated aOPCs) were isolated from the brain of mice previously treated for 5 weeks with cuprizone (0.2%). Adult oligodendrocytes (OLs) were obtained from brains of 2-month-old mice (Moyon et al., 2015). The GEO2R web application was used to identify differentially expressed genes. In cases where multiple microarray probes mapped to the same NCBI GeneID, we chose the probes which showed the lowest p value. On each data set, we performed a Student’s T test to generate a list of up-regulated and down-up-regulated genes. We used a threshold of p<0.05 and fold change>2. The list of significantly up and down regulated genes for each comparison were considered for the gene enrichment analysis using the Chi-square test with Yates' correction using the mTOR pathway as background. A p value <0.05 was considered to be statistical significant. Pathway and Biological Process Enrichment analysis was performed using the PANTHER online software (http://pantherdb.org/) (Mi et al., 2012).
Gene enrichment analysis
In order to evaluate the significance of gene-term enrichment using the mTOR “Regulatory
Molecular Network” as background, a Chi-square test with Yates' correction was performed for the
selected genes. A p value <0.05 was considered to be statistical significant.
Ex vivo and in vitro analysis Animals
Eight to 10 weeks old female C57BL⁄6 mice will be purchased from ENVIGO RMS srl (San Pietro al Natisone, Udine, Italy). The animals were kept at the animal facility of the Department of Biomedical and Biotechnological Sciences, Section of General Pathology, Catania, Italy. They were kept under standard laboratory conditions (non-specific pathogen-free) with free access to food
29 (Harlan Global Diet 2018) and water and were allowed to adapt at least one week to their environment before commencing the study. Automatically controlled environmental conditions were set to maintain temperature at 20 – 24°C with a relative humidity (RH) of 30 – 70% ,10-30 air changes /hr and a natural dark:light cycle. Protection of animals used in the experiment is in accordance with Directive 86/609/EEC, enforced by the Italian D. Lgs 26/2014.
Induction of MOG-induced EAE in C57BL⁄ 6 mice.
MOG35-55 was synthetized by Genemed synthesis (San Francisco CA). The mice were immunized
with 200 ug MOG emulsified in CFA with 1 mg of Mycobacterium tuberculosis H37RA (Difco, Detroit, MI, USA) to make a 1:1 emulsion. Each mouse received subcutaneous injections of 200 l emulsion divided among two sites draining into the axillary lymphnodes. Pertussis toxin (Calbiochem, Nottingham, UK) was used as a co-adjuvant and was administered i.p. at the dose of 200 ng/mouse on day 0 and 2 post immunization. The mice were observed every day by measuring their body weights and clinical signs of EAE. The clinical grading were carried out by an observer unaware of the treatment: 0 = no sign of disease; 0.5 = partial tail paralysis; 1 = tail paralysis; 1.5 = tail paralysis + partial unilateral hindlimb paralysis; 2 = tail paralysis + hindlimb weakness or partial hindlimb paralysis; 2.5 = tail paralysis + partial hindlimb paralysis (lowered pelvi); 3 = tail paralysis + complete hindlimb paralysis; 3.5 = tail paralysis + complete hindlimb paralysis + incontinence; 4 = tail paralysis + hindlimb paralysis + weakness or partial paralysis of forelimbs; 5 = moribund or dead.
Ex vivo restimulation with MOG35-55
At the 14th day after EAE induction, spleens and lymph nodes were harvested from C57BL/6 mice. Cell suspensions were prepared by grinding the organs with the plunger of a 5 ml disposable syringe and suspending them in RPMI 1640 medium supplemented with 10% fetal calf serum, 2 mM glutamine, and 50 mg/ml of penicillin/streptomycin (complete medium). Splenocytes were treated with an ACK Lysis Buffer (Invitrogen, Monza, Italy) to remove red blood cells. Cells were pelleted and washed twice with PBS. Cells were then resuspended at 2 × 10⁶ cells/mL in complete medium and re-restimulated with 40 µg/mL of MOG or Concanavalin A (ConA; 10 μg/ml, Sigma Aldrich St. Louis MO, USA), and treated with BEZ-235, PX-866 and Rapamycin. Stock solutions were prepared in 100% dimethyl sulfoxide (DMSO) (Sigma-Aldrich). Subsequent dilutions and controls were prepared to account for the inclusion of DMSO in the stock solution.
30
Determination of Cytotoxicity
Splenocytes were plated in triplicate in 96-well microtiter plates at a concentration of 4*105 cells/well, in a volume of 50 µL per well in supplemented media were incubated at 37°C and 5% CO2 for 72h.
At the end of the incubation period, MTT was added to cultures to a 0.5 mg/ml working concentration in the medium from a 5-mg/ml stock solution in PBS (Phosphate-Buffered Saline). Following 4h of incubation, precipitated dye was resuspended in 0.1N HCl in isopropyl alcohol and absorbance was measured at 570 nm. Absorbance was quantified as relative percentages compared to control condition.
Supernatant cytokine levels
For cytokine assays, harvested cells were plated in triplicate in 24-well microtiter plates at a concentration of 2*106 cells/well, in the same medium, stimulated with MOG35-55 (40 μg/ml) and incubated for 48h. At the end of the incubation period, supernatants were also collected for subsequent determination of TNF-alpha by ELISA (R&D systems, Minneapolis, MN, USA).
In vitro effects of Rapamycin
Murine CD4+ CD25- T cells were magnetically isolated from wild-type mice. Cells were activated by adding 0.3 mg/mL hamster-anti-mouse CD3 and 0.5 mg/mL hamster-CD28 antibodies to cells in wells pre-coated with 0.3 mg/mL goat-anti-hamster IgG. Th17-polarization was induced using 3 ng/mL recombinant human TGF-β1 and 30 ng/mL recombinant mouse IL-6. 10 nM rapamycin, or vehicle control (DMSO) were added to cultures at the time of activation. Cells were harvested at 18 and 72 hours post-activation and RNA isolated from each sample for subsequent qRT-PCR analysis.
qRT-PCR.
Total RNA was extracted using Trizol reagent (Invitrogen, Monza, Italy) according to the manufacturer’s protocol. Reverse transcription reactions were performed using retro-transcription reagents from Roche. Real-time PCR analyses were carried out using primers in house designed or downloaded from PrimerBank (https://pga.mgh.harvard.edu/primerbank/).
31
Statistical analysis
Data are shown as Mean±S.D. of at least three biological replicates, each one being performed as technical triplicate. Statistical analysis was performed using either the Student’s T test or Mann-Whitney U test based on the results obtained from the Shapiro-Wilk and Kolmogorov-Smirnov Normality Test. The GraphPad Prism or SPSS softwares were used for the statistical analysis and the generation of the graphs. Fisher's Inverse χ2 test was used as integrative analysis for rapamycin effects on Th17 cells. It computes a combined statistic from the P-values obtained from the individual datasets,
S = −𝑙𝑜𝑔 ∑(𝑝𝑖) 𝑛
𝑖=0
32
RESULTS
Generation of the mTOR network
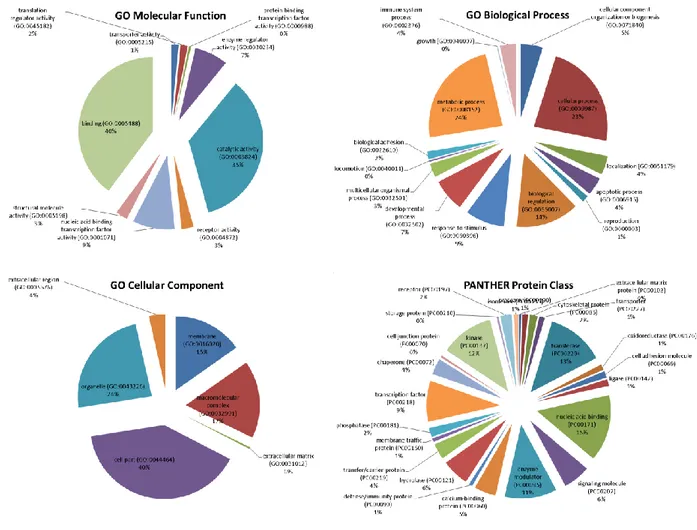
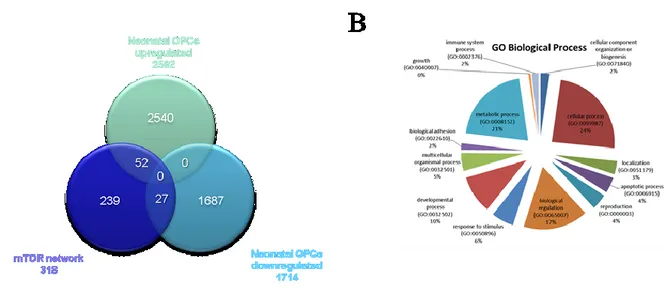
The mTOR network generated by STRING included 318 unique genes (Figure 5). Gene Ontology (GO) analysis identified as the top 3 Molecular Functions: binding activity (GO:0005488); catalytic activity (GO:0003824); and nucleic acid binding transcription factor activity (GO:0001071). Binding activity (GO:0005488) included: protein binding (GO:0005515)(51.10% of the genes); nucleic acid binding (GO:0003676) (34.50% of the genes); calcium ion binding (GO:0005509)(6.90% of the genes); calcium-dependent phospholipid binding (GO:0005544) (5.70% of the genes); and chromatin binding (GO:0003682) (1.70% of the genes).
Catalytic activity (GO:0003824) included: transferase activity (GO:0016740) (39.00% of the genes); hydrolase activity (GO:0016787) (29.90% of the genes); enzyme regulator activity (GO:0030234) (17.10% of the genes); ligase activity (GO:0016874) (5.50% of the genes); oxidoreductase activity (GO:0016491) (3.70% of the genes); isomerase activity (GO:0016853) (3.70% of the genes); and lyase activity (GO:0016829) (1.20% of the genes).
Among the top enriched Biological Processes, we found: cellular process (GO:0009987); metabolic process (GO:0008152); and biological regulation (GO:0065007), followed by response to stimulus (GO:0050896); developmental process (GO:0032502); cellular component organization or biogenesis (GO:0071840); immune system process (GO:0002376); multicellular organismal process (GO:0032501); apoptotic process (GO:0006915); localization (GO:0051179) and biological adhesion (GO:0022610).
When analyzing the Protein Classes represented by the mTOR network genes, we found that the most represented ones were: nucleic acid binding (PC00171) proteins, transferases (PC00220), kinases (PC00137), enzyme modulators (PC00095) and transcription factors (PC00218). Less represented protein classes were: signaling molecules (PC00207), calcium-binding proteins (PC00060), hydrolases (PC00121), chaperones (PC00072), transfer/carrier proteins (PC00219), cytoskeletal proteins (PC000085) and phosphatases (PC00181) (Figure 6).
33
34
35
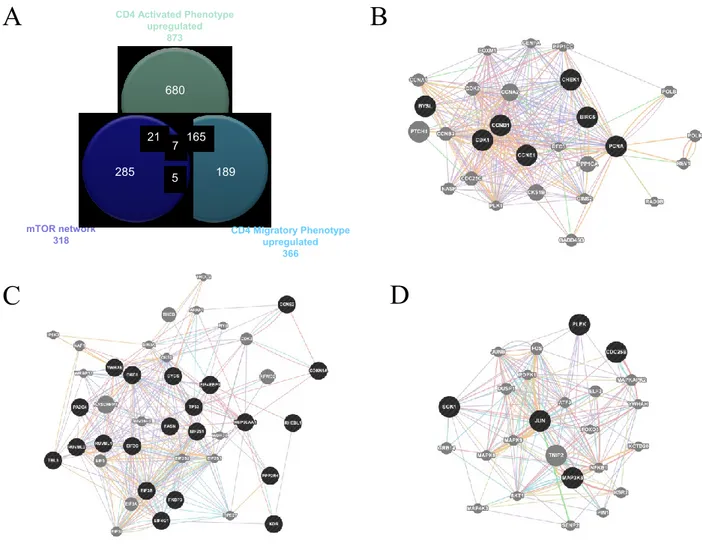
Involvement of the mTOR network in MS
The mTOR network was used for comparison with the upregulated genes involved in MS development as obtained from GSE38645. For the latter, total RNA was extracted from sorted ex vitro myelin specific CD4+T cells (activated phenotype) or isolated from the spleen (migratory
phenotype). Myelin specific activated and migratory CD4+ T cells were defined by 873 and 366
up-regulated genes, respectively, with 172 genes being shared between the two groups (Figure 7; Table 1). When comparing these genes with those belonging to the mTOR pathway, we found that 28 were in common with the activated phenotype and 12 with the migratory phenotype. Chi square test revealed a strong significant enrichment (p<0.0001) in both cases. 7 genes shared among the mTOR network, the CD4 Activated and the CD4 Migratory Phenotypes (Figure 7B). Similar results were obtained comparing the upregulated genes in GSE21942 with the mTOR signature, 19 of them being shared by the two groups (data not shown).