PAPER
TRIGLYCERIDES VARIABILITY IN DONKEY MILK
M. BONONI1*, F. TATEO1 and A. TATEO2
1Department of Agricultural and Environmental Science, University of Milan, Via Celoria 2, Milan, Italy 2Department of Veterinary Medicine, University “Aldo Moro” of Bari, Valenzano, Ba, Italy
*Corresponding author. Tel.: +39 0250316538 E-mail address: [email protected]
ABSTRACT
The distribution of triacylglycerols (TAGs) in donkey milk and of fatty acids in the glycerol backbone affect assimilation and lipolysis, so the utility of analytical methods to characterise fat fractions is proved. In this study an optimised gas chromatography/on-column injector method was used to study the TAG variability of various milk species. This method is useful for quality control aimed at standardising formulated donkey milk and was used to compare the TAG composition of lyophilised donkey milk distributed on the Italian market. Three TAG groups, based on variability degree, were detected and the most characterising TAG fraction was identified.
1. INTRODUCTION
The use of donkey milk for human consumption is justified by various nutritional values and its tolerability (BARŁOWSKA et al., 2011; DO NASCIMENTO RANGEL et al., 2015; MALISSIOVA et al., 2016 POLIDORI and VINCENZETTI, 2013). The presence of bioactive and functional components has been largely reviewed (MARTINI et al., 2014; SALIMEI et
al., 2004; SALIMEI, 2011; SALIMEI and FANTUZ, 2012;). Moreover, the consumption of
donkey milk is an alternative when there is an intolerance to cow’s milk (HØST and HALKEN, 2004; LARA-VILLOSLADA et al., 2005; MONTI et al., 2007; RESTANI et al., 2009). Previous studies (CHIANESE et al., 2010; GUO et al., 2007; MARCONI and PANFILI, 2002; SUMMER et al., 2004) support the optimisation of infant formula milk and the production of nutraceutical compounds in donkey milk for the following reasons: (1) the lipid content in donkey milk is essentially lower than in milk from humans or cows; (2) the carbohydrate content in donkey milk is comparable with human milk but higher than in cow’s milk; and (3) the protein content in donkey milk is higher than in human milk but lower than in cow’s milk. This research is part of a larger project concerning the industrial formulation of humanised milk and nutraceutical compounds using lyophilised donkey milk. The standardisation of these commercial products is possible only if they are derived from ingredients characterised by standard parameters.
Groups have analysed the triacylglycerol (TAG) composition to identify the fatty acids in the glycerol backbones (GASTALDI et al., 2010), but the analytical methods used for this aim are not suitable for routine industrial quality control. Some authors also reported comparative results for the fatty acid and TAG compositions of various milks species (BLASI et al., 2008; BRECKENRIDGE and KUKSIS, 1967; CHIOFALO et al., 2011; COSSIGNANI et al., 2011; DUGO et al., 2005; GANTNER et al., 2015GASTALDI et al., 2010; JENSEN, 1999; MARTEMUCCI and D’ALESSANDRO, 2012; ZOU et al., 2013). There is often not ideal peak resolution in TAG analysis using high performance liquid chromatography with an evaporative light scattering detector (HPLC/ELSD) (ZOU et al., 2013) and there are difficulties with TAG analysis when using HPLC/atmospheric pressure chemical ionisation (APCI)/mass spectrometry (MS) techniques with correction factors to estimate the proportion of the different TAGs in each type of milk (GASTALDI
et al., 2010).
Various authors reported comparative results concerning the fatty acid composition and TAG distribution of the fatty acids in the glycerol backbone of various milk species, but the analytical methods used for TAG analysis are not useful for routine quality control (BLASI et al., 2008; BRECKENRIDGE and KUKSIS, 1967; CHIOFALO et al., 2011; COSSIGNANI et al., 2011; DUGO et al., 2005; GANTNER et al., 2015; GASTALDI et al., 2010; JENSEN, 1999; MARTEMUCCI and D’ALESSANDRO, 2012; ZOU et al., 2013).
This paper discusses the advantages of adopting a rapid gas-chromatography (GC) method based on the identification sequence of peaks, with each one representing the total carbon number (CN) of a single TAG, in order of increasing molecular weight.
The triglyceride composition of lyophilised donkey milk products available on the Italian market was compared and the characterisation of donkey milk by this easy method was useful for the purposes of industrial quality control and to determine the fat variability composition in these lyophilised donkey milk.
2. MATERIALS AND METHODS 2.1. Experimental design
A method that was able to produce a complete pattern of TAGs by direct injection was first reported in the Commission Regulation (EC) No 213/2001 to determine the genuineness of butter. Then, the Authors modified the operative conditions to produce the first repeatability data (BONONI et al., 2001) and adopted the modified method for the identification of synthesised TAGs used as support in butter flavours (TATEO and BONONI, 2003). The same method was also applied for quality control of vegetable and animal fats (TATEO and BONONI, 2002; TATEO and BONONI, 2004).
Some Authors (LOZADA et al., 1995; MOLKENTIN and PRECHT, 1994; MOLKENTIN and PRECHT, 1995) quantitatively determined the TAG composition of milk using capillary columns. In the present paper, we used a Petrocol capillary column with bonded phase, hydrogen as the carrier gas, optimised operative conditions for an on-column injector (OCI), and programmed oven temperatures. The optimisation of the chromatographic conditions was necessary strictly to obtain repeatability data that were useful for various quality control aims.
We used the proposed method to analyse a mass sample of donkey milk from a traditional farming Area of Martina Franca in Apulia (Italy) and the TAG data were compared with milk samples from humans, cows, sheep and goats obtained with the same method.
The lyophilised donkey milk from the farming area of Martina Franca was compared with other lyophilised donkey milk products available from the specialised Italian market.
2.2. Milk samples from different species
First, five samples of milk from different species were compared to highlight the significant differences in the TAG composition of the fat fractions using the proposed method (described below). These samples were:
a) Donkey milk from an autochthonous breed from the Apulia region (Martina Franca), produced by donkeys bred using a semi-extensive method at the farm “Masseria Lamacarvotta” in Laterza (Italy);
b) Cow, sheep, and goat milk selected from Italian farms and collected at the mid lactation stage;
c) Human milk kindly provided by the Neonatology Unit (Milkbank) at the Santa Chiara Hospital in Trento (Italy).
All five samples were stored at 4°C strictly during the time to the laboratory and then were immediately frozen at -20°C before lyophilisation. Subsequently, the samples of milk were lyophilised using a ScanVac CoolSafe 110-4 Pro Freeze Dryer (Labogene) at -105°C.
2.3. Lyophilised, commercially available donkey milk
Four samples of lyophilised donkey milk, commercially available in Italy, were compared with the donkey milk produced from the Martina Franca breed and lyophilised in our pilot equipment, and also with a donkey milk available in Italy that was lyophilised in our laboratory using the same conditions adopted for the liquid samples presented in Table 1. This liquid donkey sample was sterilized by uperisation.
2.4. GC analysis of triglycerides
For the analysis of the TAG profiles in donkey, human, cow, sheep, and goat milk fat, ~5 mL of water was added to ~1-2 g of the lyophilised sample. The sample was vortexed for 1 min, and then sonicated in an ultrasonic bath for 5 min with 2 mL of isooctane (Sigma Aldrich). The mixture was centrifuged at 4000 rpm for 5 min. The isooctane phase (2 mL) was introduced manually in the on-column injector (OCI) at 40°C. The TAG analyses were performed on a HRGC 5160 Mega Series (Carlo Erba Instruments) equipped with a bonded phase poly (dimethyl siloxane) Petrocol EX 2887 capillary column (Supelco) with dimensions of: 5 m x 0.53 mm i.d. and 0.1 "m film thickness. The oven temperature program was 150°C, increased to 200°C at a rate of 10°C min-1 and then increased to 340°C
at a rate of 5°C min-1 (held for 30 min). The detector temperature (FID) was 350°C and the
carrier gas was H2 at 20 kPa pressure. An anhydrous butter fat standard certified by the
Community Bureau of Reference (CRM 519) was used for peak identification.
Table 1. Triacylglycerol composition (TAG expressed as % of peaks identified with total carbon number) of
donkey milk produced in farm “Masseria Lamacarvotta” (Laterza, Italy) compared with human, cow, sheep and goat milk samples.
TGA Donkey Human Cow Sheep Goat
C22 0.01 n.d. 0.07 0.06 n.d. C24 0.49 0.34 0.56 0.65 0.36 C26 0.21 n.d. 0.46 0.85 n.d. C28 0.65 n.d. 0.86 1.80 0.38 C30 1.65 n.d. 1.27 2.93 0.89 C32 2.72 n.d. 2.33 4.35 1.72 C34 3.44 0.20 5.30 6.05 3.59 C36 4.57 0.56 10.04 8.69 5.80 C38 6.13 1.11 12.44 13.15 8.21 C40 7.82 2.24 9.67 13.62 9.22 C42 10.15 4.26 6.17 8.77 9.75 C44 12.49 7.39 5.75 7.25 10.16 C46 9.83 11.17 6.55 6.40 10.02 C48 6.90 12.68 8.59 5.57 9.60 C50 8.76 17.79 12.50 6.81 11.75 C52 16.22 32.71 12.08 8.46 15.23 C54 7.59 9.12 5.35 4.60 3.33 C56 0.37 0.42 n.d. n.d. n.d. 3. RESULTS
The mean TAG compositions (Table 1) were derived from three replicate GC-OCI analyses of samples of donkey milk from the Martina Franca farm and of samples from other species. Examples of the GC-OCI traces of milk from donkey, human, cow, sheep and goat are shown in Fig. 1.
Figure 1. Examples of GC-OCI traces produced for fat fraction of milk of different species and expressed as
total carbon number (CN).
The NMKL Procedure No. 5 (Nordic Committee on Food Analysis, 1997) was used to evaluate the relative Repeatability Standard Deviation (RSDr) using three samples for each milk species, and the following results were obtained: 0.022 (donkey milk), 0.032 (human milk), 0.018 (cow milk), 0.034 (sheep milk), and 0.011 (goat milk).
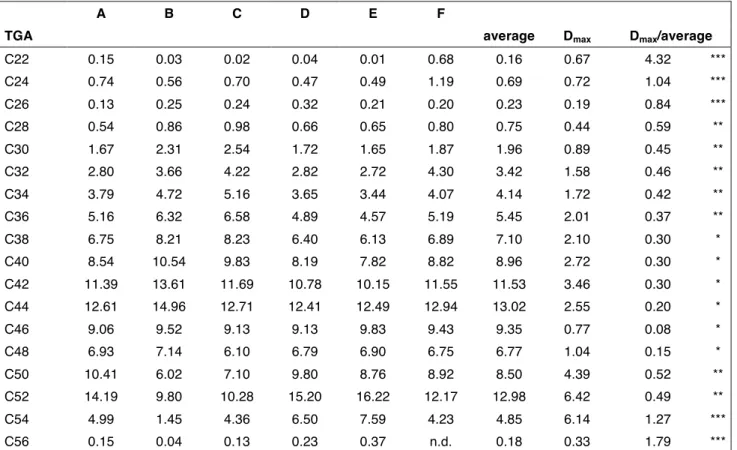
The TAG composition (Table 2) of four lyophilised samples present on the Italian market were compared with two lyophilised samples produced from the reference liquid donkey milk of Martina Franca and from the liquid donkey milk distributed in Italy. From these
the Dmax values are simply derived from the minimum and maximum values identified in
Table 2. To estimate the variability from the mean values, we defined three ranges (<0.3, 0.3-0.6, and >0.6) deduced from the ratio “Dmax/mean” that identify TAG classes with low,
medium, and high variability.
Table 2. TAG composition of the fat fraction of four lyophilised donkey milk products distributed in Italy
(A-D) compared with the Martina Franca donkey milk (E) and a donkey milk distributed in Italy (F) lyophilised in laboratory pilot equipment.
A B C D E F
TGA average Dmax Dmax/average
C22 0.15 0.03 0.02 0.04 0.01 0.68 0.16 0.67 4.32 *** C24 0.74 0.56 0.70 0.47 0.49 1.19 0.69 0.72 1.04 *** C26 0.13 0.25 0.24 0.32 0.21 0.20 0.23 0.19 0.84 *** C28 0.54 0.86 0.98 0.66 0.65 0.80 0.75 0.44 0.59 ** C30 1.67 2.31 2.54 1.72 1.65 1.87 1.96 0.89 0.45 ** C32 2.80 3.66 4.22 2.82 2.72 4.30 3.42 1.58 0.46 ** C34 3.79 4.72 5.16 3.65 3.44 4.07 4.14 1.72 0.42 ** C36 5.16 6.32 6.58 4.89 4.57 5.19 5.45 2.01 0.37 ** C38 6.75 8.21 8.23 6.40 6.13 6.89 7.10 2.10 0.30 * C40 8.54 10.54 9.83 8.19 7.82 8.82 8.96 2.72 0.30 * C42 11.39 13.61 11.69 10.78 10.15 11.55 11.53 3.46 0.30 * C44 12.61 14.96 12.71 12.41 12.49 12.94 13.02 2.55 0.20 * C46 9.06 9.52 9.13 9.13 9.83 9.43 9.35 0.77 0.08 * C48 6.93 7.14 6.10 6.79 6.90 6.75 6.77 1.04 0.15 * C50 10.41 6.02 7.10 9.80 8.76 8.92 8.50 4.39 0.52 ** C52 14.19 9.80 10.28 15.20 16.22 12.17 12.98 6.42 0.49 ** C54 4.99 1.45 4.36 6.50 7.59 4.23 4.85 6.14 1.27 *** C56 0.15 0.04 0.13 0.23 0.37 n.d. 0.18 0.33 1.79 ***
The variability classes for TAG are expressed as the total carbon number (CN). Data for all samples were derived from five replicates.
Dmax/average
* < 0.3 little variability ** from 0.3 to 0.6 medium variability *** > 0.6 high variability
The TAGs characterised by the lower variability are included in six TAG classes from C38 to C48. In each donkey milk sample, the classes with lower variability represented more than 50% of the total fat fraction. In particular, for five samples, the TAGs with lower variability represented 53-58% of the total TAG content, and for sample B they represented 64% of the total fat.
The TAGs characterised by the higher variability are included in four TAG classes (C24, C26, C54, and C56) that represented 5-9% of the total fat fraction for five samples and 2% of sample B, while the TAGs with medium variability (C28, C30, C32, C34, C36, C50, and C52) represented 34-39% of the total fat fraction.
Considering the identification of donkey milk fatty acids on glycerol backbone (GASTALDI et al., 2010) and data in Table 2, we deduced Table 3 that shows the TAGs composition of three variability classes. Table 4 reports fatty acid symbols and names used in Table 3.
Table 3. TGA % composition with lower, medium and higher variability classes in six donkey milk samples
of Italian market.
Lower variability
TGA A B C D E F
C38 6.75 8.21 8.23 6.40 6.13 6.89 Bu-P-Ln, Cy-C-Me, C-Po, Co-P-P, C-P, La-La-M
C40 8.54 10.54 9.83 8.19 7.82 8.82 C-La-Ln, Co-P-Ln, Cy-M-Ln, C-La-O, C-M-P, Cy-P-P
C42 11.39 13.61 11.69 10.78 10.15 11.55 Cy-P-Ln, C-M-Ln, La-Ln-Ln, Cy-P-O, C-Po-P, C-P-P C44 12.61 14.96 12.71 12.41 12.49 12.94 Cy-Ln-L, Cy-Ln-O, C-P-Ln, Cy-O-O, C-P-O,
La-P-P
C46 9.06 9.52 9.13 9.13 9.83 9.43 C-Ln-Ln, C-Ln-L, C-Ln-O, C-L-O, La-P-Ln, C-O-O, La-P-Pl, La-P-O-, M-P-P
C48 6.93 7.14 6.10 6.79 6.90 6.75 La-Ln-O, La-L-O, Mo-P-L, M-P-L, M-Po-O, M-P-O, M-P-S, P-P-P Σ 55.28 63.98 57.69 53.70 53.32 56.38 Medium variability TGA A B C D E F C28 0.54 0.86 0.98 0.66 0.65 0.80 Cy-Cy-La C30 1.67 2.31 2.54 1.72 1.65 1.87 Cy-C-La C32 2.80 3.66 4.22 2.82 2.72 4.30 C-C-La
C34 3.79 4.72 5.16 3.65 3.44 4.07 Cy-Cy-Ln, C-C-M, Cy-C-P, C-La-La C36 5.16 6.32 6.58 4.89 4.52 5.19 Cy-Cl-Ln, Cy-C-Ln, Cy-C-O, Cy-La-P C50 10.41 6.02 7.10 9.80 8.76 8.92 M-Ln-Ln, Po-P-Ln, P-P-Ln, P-P-L, Po-P-O,
P-P-O, P-P-S
C52 14.19 9.80 10.28 15.20 16.22 12.17 P-Ln-Ln, P-Ln-L, Po-Ln-O, P-L-L, P-Ln-O, Po-L-O, P-L-O, Po-O-O, P-O-O-, P-O-S Σ 38.56 33.69 36.86 38.74 38.01 37.32 Higher variability TGA A B C D E F C22 tr. tr. tr. tr. tr. tr. C24 0.74 0.56 0.70 0.47 0.49 1.19 Bu-Bu-P C26 0.13 0.25 0.24 0.32 0.21 0.20 Cy-Cy-C
C54 4.99 1.45 4.36 6.50 7.59 4.23 Ln-Ln-L, Ln-L-L, Ln-Ln-O, Ln-L-O, L-L-O, Ln-O-O, L-O-O, O-O-O, O-O-S, P-O-Ga, O-S-S C56 0.15 0.04 0.13 0.23 0.37 n.d. P-O-Er
Table 4. Fatty acid symbols used in Table 3.
Symbol Notation Fatty acid
Bu C4:0 Butyric acid Co C6:0 Capronic acid Cy C8:0 Caprylic acid Cl C10:1 Decenoic acid C C10:0 Capric acid La C12:0 Lauric acid Mo C14:1 Myristoleic acid M C14:0 Myristic acid Po C16:1 Palmitoleic acid P C16:0 Palmitic acid Ln C18:3 Linolenic acid L C18:2 Linolei acid O C18:1 Oleic acid S C18:0 Stearic acid Me C20:3 Eicosatrienoic acid Ga C20:1 Eicosaenoic acid Er C22:2 Docosaenoic acid 4. CONCLUSIONS
The determination of the amount of TAG, free fatty acids, and phospholipids in milk from various species has been the objective of many studies (CLAEYS et al., 2014; GANTNER et
al., 2015; JENSEN et al., 1990) and the distribution of fatty acids in triglycerides and the
glycerol backbone affects the assimilation and consequently the biochemical and the nutritional value (EMKEN et al., 2004; FILER et al., 1969; GASTALDI et al., 2010). Therefore, the influence of the TAG composition is confirmed.
From an analytical point of view, a simple method based on the identification of TAG, expressed as CN, is very useful. The GC method described in this paper for the study of TAG content, expressed as CN, is optimised for the quantitative characterisation of TAG profiles and is useful for industrial quality control of donkey milk. Also, the GC-OCI profiles reported in this paper demonstrated there is a clear differentiation between different species of milk and the TAG pattern may be considered a fundamental characteristic of milk from all species. In this paper, the TAG fraction of donkey milk from the Martina Franca breed was compared with human, cow, sheep, and goat milk samples, and the proposed GC-OCI method produced good reproducible results and permitted an easy characterisation and comparison.
Concerning the TAG composition of donkey milk, previous studies used different methods but not always included the TAG composition. Therefore, this paper gives a contribute to define the extremes of natural variability for donkey milk. We determined the variability of TAG composition, expressed as CN, in lyophilised donkey milk using our optimised method and we detected three degrees of variability for the different TAG classes.
ACKNOWLEDGEMENTS
The Authors thanks Eurolactis Group SA for providing the donkey milk of its production.
REFERENCES
Barłowska J., Szwajkowska M., Litwińczuk Z. and Król J. 2011. Nutritional value and technological suitability of milk from various animal species used for dairy production. Compr. Rev. Food Sci. F. 10:291-302.
Blasi F., D. Montesano, De Angelis M., Maurizi A., Ventura F., Cossignani L., Simonetti M.S. and Damiani P. 2008. Results of stereospecific analysis of triacylglycerol fraction from donkey, cow, ewe, goat and buffalo milk. J. Food Compos. Anal. 21:1-7.
Bononi M., Fossati A., Lubian E., Tateo F. and Fasan S. 2001. Caratterizzazione di trigliceridi di sintesi con funzione di solvente/supporto in aroma burro. Riv. Ital. Sostanze G. 78:465-469.
Breckenridge W.C. and Kuksis A. 1967. Molecular weight distributions of milk fat triglycerides from seven species. J. Lipid Res., 8:473- 478.
Chianese L., Calabrese M.G., Ferranti P., Mauriello R., Garro G., De Simone C., Quarto M., Addeo F., Cosenza G. and Ramunno L. 2010. Proteomic characterization of donkey milk “caseome”. J. Chromatogr. A 1217:4834-4840.
Chiofalo B., Dugo P., Bonaccorsi I.L. and Mondello L. 2011. Comparison of major lipid components in human and donkey milk: new perspectives for a hypoallergenic diet in humans. Immunopharm. Immunot. 33:633-644.
Claeys W.L., Verraes C., Cardoen S., De Block J., Huyghebaert A., Raes K., Dewettinch K. and Herman L. 2014. Consumption of raw or heated milk from different species: An evaluation of the nutritional and potential health benefits. Food Control 42:188-201.
Commission Regulation (EC) No 213/2001 of 9 January 2001 laying down detailed rules for the application of Council Regulation (EC) No 1225/1999 as regards methods for the analysis and quality evaluation of milk and milk products and amending Regulation (EC) No 2771/1999 and (EC) No 2799/1999. Official Journal of the European Communities L 37/1- L 37/99.
Cossignani L., Blasi F., Bosi A., D’Arco G., Maurelli S., Simonetti M.S. and Damiani P. 2011. Detection of cow milk in donkey milk by chemometric procedures on triacylglycerol stereospecific analysis results. J. Dairy Sci. 78: 335-342. do Nascimento Rangel A.H., Bezerra Galvão J.G., Alves Simplício A., Bezerri Freire R.M. and Patto Novaes L. 2015. Aspectos composicionais e nutricionais do leite de jumenta: uma revisao. Rev. Inst. Laticinios Cândido Tostes, Juiz de Fora 70:160-171.
Dugo P., Kumm T., Lo Presti M., Chiofalo B., Salimei E., Fazio A., Cotroneo A. and Mondello L. 2005. Determination of triacylglycerols in donkey milk by using high performance liquid chromatography couplet with atmospheric pressure chemical ionization mass spectrometry. J. Sep. Sci. 28:1023-1030.
Emken E.A., Adlof R.O., Duval S.M., Shane J.M., Walker P.M. and Becker C. 2004. Effect of triacylglycerol structure on absorption and metabolism of isotope-labeled palmitic and linoleic acids by humans. Lipids 39:1-9.
Filer L.J., Mattson F.H. and Fomon S.J. 1969. Triglycerides configuration and fat absorption by the human infants. J. Nutrition 99:293-298.
Gantner V., Mijić P., Baban M., Škrtić Z. and Turalija A. 2015. The overall and fat composition of milk of various species. Mljekarstvo 65:223-231.
Gastaldi D., Bertino E., Monti G., Baro C., Fabris C., Lezo A., Medana C., Baiocchi C., Mussap M., Galvano F. and Conti A. 2010. Donkey’s milk detailed lipid composition. Front. Biosci. E2: 537-546.
Guo H.Y., Pang K., Zhang X.Y., Zhao L., Chen S.W., Dong M.L. and Ren F.Z. 2007. Composition, physiochemical properties, nitrogen fraction distribution, and amino acid profile of donkey milk. Int. Dairy J. 90:1635-1643.
Høst A. and Halken S. 2004. Hypoallergenic formulas – when, to, whom and how long: after more than 15 years we know the right indication! Allergy 59:45-52.
Jensen R.G. 1999. Lipids in Human Milk. Lipids, 34:1243-1271.
Lara-Villoslada F., Olivares M. and Xaus J. 2005. The balance between caseins and whey proteins in cow’s milk determines its allergenicity. J. Dairy Sci. 88:1654-1660.
Lozada L., De La Fuente M.H., Fontecha J. and Juarez M. 1995. Consideration of the quantitative aspect of the determination of milkfat triglycerides with split PTV and on-column injection. J. High Res. Chromatog. 18:771-775. Malissiova E., Arsenos G., Papademas P., Fletouris D., Manoursa A., Aspri M., Nikolopoulou A., Giannopoulou A. and Arvanitoyannis I.S. 2016. Assessment of donkey milk chemical, microbiological and sensory attributes in Greece and Cyprus. Int. J. Dairy Technol. 69:143-146.
Marconi E. and Panfili G. 1998. Chemical composition and nutritional properties of commercial products of mare milk powder. J. Food Compos. Anal. 11:178-187.
Martemucci G. and D’Alessandro A.G.. 2012. Fat content, energy value and fatty acid profile of donkey milk during lactation and implications for human nutrition. Lipids Health Dis. 11:113-126.
Martini M., Altomonte I. and Salari F. 2014. Amiata donkeys: fat globule characteristics, milk gross composition and fatty acids. Ital. J. Anim. Sci. 13:123126.
Molketin J. and Precht D. 1994. Comparison of packed and capillary columns for quantitative gas chromatography of triglycerides in milk fat. Chromatographia 39:265-270.
Molketin J. and Precht D. 1995. Development of a precise capillary GC method for rapid triglyceride analysis of milk fats. Fat Sci. Technol. 97:43-49.
Monti G., Bertino E., Muratore M.C., Coscia A., Cresi F., Silvestro L., Fabris C., Fortunato D., Giuffrida M.G. and Conti A. 2007. Efficacy of donkey’s milk in treating highly problematic cow’s milk allergic children: An in vivo and in vitro study. Pediatr. Allergy Immu. 18:258-264.
Nordic Committee on Food Analysis. 1997. Estimation and expression of measurement uncertainty in chemical analysis. NMKL Procedure No.5.
Polidori P. and Vincenzetti S. 2013. Use of donkey milk in children with cow’s milk protein allergy. Foods 2:151-159. Restani P., Ballabio C., Di Lorenzo C., Tripodi S. and Fiocchi A. 2009. Molecular aspects of milk allergens and their role in clinical events. Anal. Bioanal. Chem. 395:47-56.
Salimei E., Fantuz F., Coppola R., Chiofalo B., Polidori P. and Varisco G. 2004. Composition and Characteristics of ass’s milk. Anim. Res. 53:67-78.
Salimei E. 2011. Animals that Produce Dairy Foods - Donkey. Encyclopaedia of Dairy Sciences (Second Edition), 365-373. Salimei E and Fantuz F. 2012. Equid milk for human consumption. Int. Dairy J. 24:130-142.
Summer A., Sabbioni A., Formaggioni P. and Mariani P. 2004. Trend in ash and mineral element content of milk from Haflinger nursing mares throughout six lactation months. Livest. Prod. Sci. 88: 55-62.
Tateo F. and Bononi M. 2002. Guida all’analisi chimica degli alimenti – Latte e derivati. Ars Edizioni Informatiche. Tateo F. and Bononi M. 2003. The repeatability test in GC analysis of triglycerides. Ind. Aliment. 42:500-504.
Tateo F. and Bononi M. 2004. Guida all’analisi chimica degli alimenti – Oli e grassi vegetali. Ars Edizioni Informatiche Zou X., Huang J., Jin Q., Guo Z., Liu Y., Cheong L., Xu X. and Wang X. 2013. Lipid composition analysis of milk fats from different mammalian species: potential for use as human milk fat substitutes. J. Agr. Food Chem. 61:7070-7080.