Trends in the Seasonality of Births
and Deaths of European Noblemen
from the 14
th
to the 20
th
Century
*H E R B E R T S T O Y A N a, D I E T R I C H S T O Y A N b aUniversität Erlangen-Nürnberg, Institut für Informatik
bTU Bergakademie Freiberg, Institut für Stochastik
1. Introduction. Historical knowledge on the seasonal pattern of births and deaths
is valuable as it gives insight into the everyday life of the observed population. For example, rules of life imposed by religious institutions, seasonal influences on access to food and (room) temperature, seasonal diseases and social events like wars play an important role. There are studies of seasonality for births, e.g. Régnier-Lolier (2010), Régnier-Régnier-Lolier and Rohrbasser (2011), as well as for deaths, e.g. Biraben (1977), Breschi and Livi Bacci (1986), Fornasin, Breschi and Manfredini (2010), Hollingsworth (1975), Zao (1997) and Rau (2007).
Up until now, larger data sets containing births and deaths for Europe seemed
to be available only for the time from the 17thcentury onwards, with the exception
of smaller particular populations of certain towns or regions. So it remains largely
unknown how the birth patterns before the 17th century look, while for the time
from the 17thcentury onwards Régnier-Lolier and Rohrbasser (2011) provide
valu-able data for France.
The present paper aims to investigate further into the past, yet limited to a par-ticular social class, namely noblemen. It uses the possibility given by a new dataset, which reaches back to the beginning of the second millennium. However, the data
is analysed here only from the 14thcentury onwards, because only this dataset is
suf-ficient to perform a reliable statistical analysis. The dataset concerns noblemen from the geographical area which today roughly comprises the European Union plus Liechtenstein, Montenegro, Norway, Russia, Serbia and Switzerland, and con-siders this noble class as a unique European population. The paper analyzes the sea-sonality of both births and deaths.
Since noblemen formed a higher class in their respective societies, the authors had expected some deviations from the birth pattern presented in Régnier-Lolier and Rohrbasser (2011), which included all classes of the area considered. And indeed, the seasonality of births observed here is greater than that for the noblemen – perhaps in agreement with the assumption that changes in fertility and mortality patterns start within the upper classes, see Burström and Bernhardt (2001), Haines
*The authors are grateful to Professor Alessio Formasin for valuable comments on an earlier ver-sion of this paper. They thank an anonymous reviewer for many helpful and constructive com-ments and Professor Guido Alfani for his kind support in the revision of the original manuscript. The authors also thank Professor Arnaud Régnier-Lolier for the permission to use the data for Figure 4.
(1985), Preston and Haines (1991), Woods (1984) and Woods, Watterson and Woodward (1988). In relation to the death seasonality the authors had expected a pattern showing the usual peak in March and without differences between the sexes. They were surprised when the result showed clear differences between the
sexes and a significant change of the pattern for men since the 18thcentury.
2. Sources and methods
The information system WW-Person. The statistical analyses of this paper are based
on the information system WW-Person. This system was initiated by H.S. in 1994 in the early times of the world wide web. As the name shows, the original aim was more ambitious than to consider only noblemen, namely to consider people and pop-ulations in general. However, it turned out that already the study of noblemen alone poses a big problem. Therefore the actual goal of the WW-Person project has been describing members of Europe’s noble classes under various aspects: life data, biogra-phies, relations to other people (including parents, spouses and children), coats-of-arms, properties, portraits, autographs, seals, houses or castles, and tombs or epi-taphs. In the beginning the idea was that the set of noblemen could be collected in one or two years and then class-relevant characteristics could easily be added.
However, genealogy is a difficult topic based on a huge amount of data, which is not easy to obtain. While all relevant data were once known and open to all inter-ested people, they now are fixed in written form, yet incomplete. Because human beings are notoriously unreliable, there is now a large amount of books, journal publications, table collections, genealogical notes and note papers in archives, which sustain as well as contradict each other. Therefore, the sub-project of col-lecting descriptions of people, their life data and biographies and their family rela-tions turned into an approach to apply knowledge-management techniques to genealogy of the noble class.
The state of genealogy is quite various for different European countries. Whereas, for example, the English part seems to be in a good state as there are multi-volume books of complete peerages, there are countries like Spain or France where such sources do not exist at all.
In WW-Person, persons, their names, titles, life data and family relations have been collected from the best sources available. For each of the European countries these sources are different. The primary sources used were printed books focused on nobility genealogy such as Fernandez de Bethencourt (1882-1884), Burke (1953), von Ehrenkrook, von Huck, Franke (1953-2012), Ikonnikov (1956-1961), Litta (18111902), Perthes (18111942) and Schwennicke (19772011). Addi -tionally, journal papers were used if known and useful. For families without known publications, material from various archives was chosen (e.g. Euler,1995). Up to now H.S. has consulted archives in Barcelona, Besançon, Brandenburg, Dresden, Florence, Karlsruhe, Madrid, Magdeburg, Munich, Münster, Nuremberg, Salzburg, Strasbourg, Toledo, Trier, Vienna, Würzburg and Zurich, and he plans to extend this work. The internet has been only sporadically used because its genealogical pages usually do not show the sources and are often unreliable. By the
way, up to now not all relevant printed sources have been taken into consideration; neither are all related special publications known.
WW-Person uses a detailed source management – which is a new application within the field of genealogy. This means that all used data sources are stored at the relevant data part and are accessible for interested users.
The best case for acquisition of genealogical data for WW-Person is given if there is a table (a page with horizontally or vertically ordered person-related text boxes) covering a set of families. In the first step of data input, such tables are keyed into the computer via a special structural notation. This enables transformation of the content of a table to a series of personal records. If they have the correct fami-ly structure then life data and biographical information are added. The second step is then to find the corresponding spouses, which is not a simple task, even if their families are already in WW-Person: often, women (daughters) and dead infants are not included in the genealogies. Additionally, multiple marriages of the same per-son may be not registered.
WW-Person may contain doublets, i.e. two (or even more) persons’ records for the same person, with perhaps different names and dates. In such cases automatic doublet removal cannot be carried out. Therefore, some life data may be included more than once in our analysis.
Until now, the third step of data input – including all life data available – has not yet been accomplished for all sources. A second work-through of all sources and data check as well as completion of data acquisition will improve the quality of WW-Person. However, the authors assume that the actual state of WW-Person is completely sufficient for the present paper and does not influence its results – why should the above discussed faults in the files have their own seasonality? Surely they are uniformly distributed over the year.
A complicated problem is the definition of the intended set of people, the
noble-men. The term ‘European nobility between 700 and today’ sounds easy – but it is of
course rather difficult. Setting aside the definition of ‘Europe’, the definition of nobil-ity changes from country to country. For some countries, for example Spain or Bavaria, it is indeed easy: a family is ‘noble’ if the king accepted them as such. In other coun-tries, however, it is a mixture of blood inheritance and royal creation. In Germany, there are the old families (‘Edelherren’) which were nobles before 1000 and the new families (‘paper nobles’) which were made noble people by royal patent.
In France, there was a constant struggle between the royal nobility-control and ambitious families for this classification. Nobles were freed of taxes – a good reason for everybody to claim noble parents. Controllers from Paris roamed the country to increase the king’s tax income. They asked for proof of nobility and refused wrong classifications. (When they left a county, all declassed families started anew.) The rev-olution of 1789 brought a new wave of disorder and ambitions. Today, there is a group of persons in France that are able to prove their nobility, while the members of anoth-er group, in size similar, considanoth-er themselves as noble but cannot prove nobility.
In this difficult situation, the following literature-based definition of noblemen was used.
Noblemen are persons who are accepted in the genealogical literature as noble-men, i.e. appear in the books mentioned above or in Perthes (1811-1942), Libro della
nobiltà, Genealogisches Handbuch, Burke’s peerage – and do not appear in books on
bogus nobility.
Despite the fact that in our time nobility plays a much less significant role, mod-ern false nobility claims and title fraud are not rare.
A second problem, which, however, does not much matter in WW-Person and the presented analysis but in the publication of data about this set of historical per-sons is the distribution of noblemen over the countries. While the border between England and Scotland changed once or twice, borders on the continent have per-sistently changed (and may continue to do so). An example is the French-German borderline, which moved forth and back many times in the course of history, start-ing with the fight of the French against the Germans over Charlemagne’s inheri-tance after his death in 814.
A further point of concern is citizenship. Today, people have citizenships and thus their assignation to a country appears to be clear. However, citizenship may change in the lifetime of an individual. Was Albert Einstein a Swiss, a German or a US citizen? (He was probably all of those, but not a nobleman.) Should we assume the last citizenship – held at the moment of death – to be the correct one? It was easily possible to be a follower of the Emperor of the Holy Roman Empire and the King (Roi) of France simultaneously. Are the Dauphins of Vienne (near Lyon) German or French? It is safe that they were princes of the Holy Roman Empire. Are the inhabitants of Besançon before 1670 German or French? As it seems, they spoke a Roman dialect. What about Strasbourg (Alsace) in around 1700? The French king ruled there, but the whole of Germany regarded it as a German town. Therefore, all these indications of uncertainty are reasons for the fact that citizen-ship and nationality do not play a role in WW-Person and are consequently ignored in this paper too. An intersection-free classification would cause a large set of ques-tionable decisions. This holds true for regions of Spain, France, Netherlands, Belgium, Luxemburg, Germany, Austria, Italy, Hungary, Czech and Slowak Republics and the Balkans.
To give the reader an impression, here are approximate numbers of noblemen included in WW-Person. The total number is about 900.000, and there are 86.000 from the British islands, 58.000 Frenchmen, 50.000 Spaniards, 4.000 Portugueses, 86.000 Italians, 66.000 Russians, 16.000 Hungarians, 5.000 Polish, 4.000 Greek, Romanians, Serbs, Montenegrines and Albanians. The big rest includes international families, Germans, Dutch, northern Europeans (Scandinavians) and Czech.
Another problem might be the selection of persons. The following influence fac-tors can be stated: first, the selection of sources, second, the selection of families from the sources made by the authors of the sources, and third, the selection of family members, again by the same authors. For the project, the sources were select-ed by quality and by accessibility.
One of the goals of WW-Person is completeness. So it aims to overcome the restrictions mentioned above. At present, in the middle of the project, a lot of
important material has not yet been properly analysed. Authors of files might have ignored family lines they considered less important; e.g. in many Russian genealo-gies women are completely ignored. In extenso sources which contain data of all children who died in infancy are very rare. However, the authors do not see any sys-tematic influence on the distribution of dates of births and deaths through these complicated selection circumstances.
For the present paper the data in a proper sense, the day and its relation to month and year play an important role. The modern system was not always the rul-ing method. The Romans had reference days in the months (Idus, Kalendes), the years would be taken from the consulate of some people (Emperors). In medieval Europe reference days were days associated with important saints or major holi-days. From about 800 AD onwards, the years were counted from a fictitious year of Christ’s birth. However, also the duration of the reign of a king was an often used scheme. A special point in the year’s definition was the year’s end, for which in
Europe different definitions applied. The beginning of the year on the 25th of
December was very popular, but Easter was also common – even if it was in a dif-ferent month each year – and there were also other dates. Sometimes it happened that two neighbouring towns applied different definitions. England had set Easter as the beginning of the year until 1700. In genealogical books one finds dates like our modern dates simultaneously with dates related to year-beginning in spring time. (One for the original year and one for the year in modern numbering – fortu-nately they differ only by 1. For example, for February 22 in 1222: 22.2.1221/1222.) The mess got even worse when the Roman church introduced the new dating rule in 1582: the Gregorian calendar. The reformed churches did not follow – why should they obey the pope? For the next 150 years there is a general ‘date mess’ in central Europe. All catholic countries (or sub-countries) changed to Gregorian in 1582, while reformed countries (of many different definitions) gradually followed later. The eastern Greek-orthodox countries adopted the Gregorian calendar as late as 1918 only! No wonder that it is a difficult task to find out the effective birth date of a person in Europe back then: one has to consult church records to find out in which historical country the corresponding town or village was located, and in a next step find out when the place accepted the Gregorian calendar.
One of the top publications, the 1904 Ahnentafel-Atlas by Stephane Kekulé von Stradonitz (1898-1904), was revised in the 1950s and 1960s by French genealogists, who worked through a group of ruling German families to find out their correct life data. However, alas, the resulting books are not free of errors! A complicated sys-tem of corrections and corrections of corrections is included – not for the last vol-ume, though. And these books are in French! The first names were systematically translated to French and the German notation variants were removed. So, there is both, progress and backlash in one publication – as it is usual in our world and in science. Fortunately, for the present paper the first names play no important role.
Finally, remember the restricted memory again. What to do if two well accept-ed sources provide different data for the same event? One has to accept that many historical data are of a fuzzy nature; often only intervals of days are safe. This even
holds true for historically well-accepted events! For the present paper, only rela-tively simple data were used: the numbers of births and deaths in months over the centuries. (Note that many death data before 1000 are definite in day and month but open in year. We did not use them. Other data are definite in year and month but inconclusive in day – neither did we use those.)
Data analysis. The data from WW-Person were analysed only in situations where
the datasets were large enough for obtaining reliable statistical results. This had an influence on the centuries included in the analysis. Only centuries where the num-bers of events (births or deaths) were ‘large enough’ were considered, what means that they had to be so large that the (false) statistical null hypothesis of uniform
dis-tribution of events over the year is rejected by the classical 2goodness-of-fit test, with
12 classes, for the 12 months. (Note that for small samples this hypothesis may be accepted, simply because the sample is small.) This led to the decision to consider
births only from the 15thcentury and female deaths only from the 16thcentury.
A second question was discrimination of female and male births. The
Brandt-Snedecor 2test for 2 × k contingency tables was applied (with k = 12) to test the
hypothesis that the birth patterns of females and males were equal. As expected this hypothesis was accepted in all centuries and so the numbers of women and men were pooled.
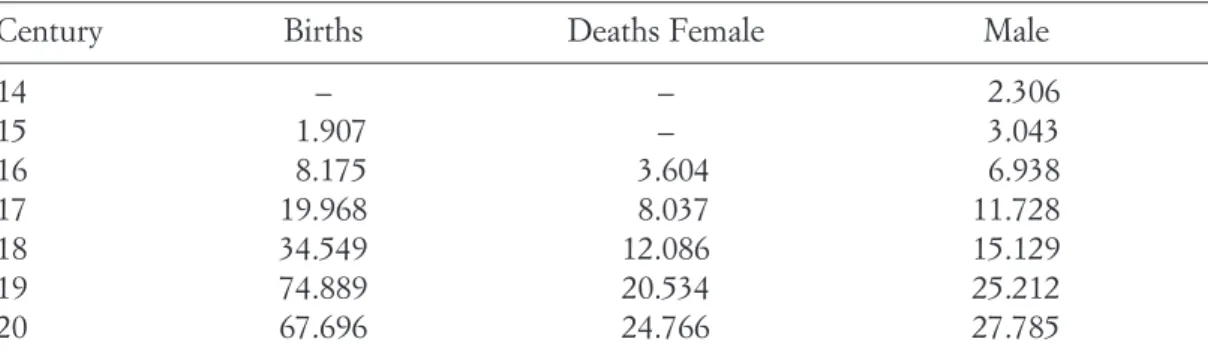
Table 1 gives an impression of the size of the datasets analysed eventually. The analysis of the data is simple: the numbers of events per month were deter-mined for all centuries. These values were modified by uniforming month lengths, and finally the corresponding 100-indices were determined (Rau 2007) and plotted in the figures below. For example, a value of 100 for one month means that in this month the number of events equals the modified month’s average.
Tab. 1. Numbers of births and deaths in the centuries from WW-Person analysed in the present
paper
Century Births Deaths Female Male
14 – – 2.306 15 1.907 – 3.043 16 8.175 3.604 6.938 17 19.968 8.037 11.728 18 34.549 12.086 15.129 19 74.889 20.534 25.212 20 67.696 24.766 27.785 Source: WW-Person. 3. Results
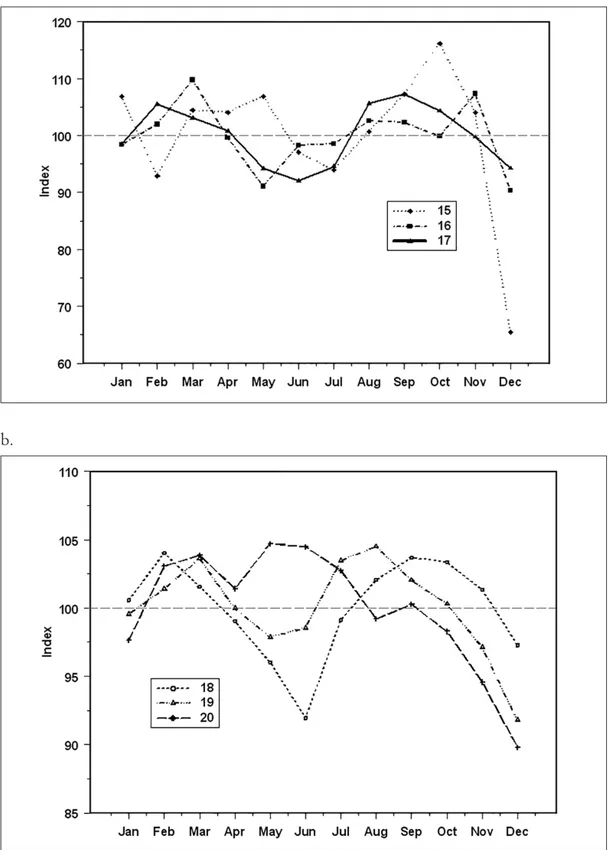
Seasonality of births. Figure 1 shows the seasonality of births for the periods 15th
-17thcentury and 18th-20thcentury. There are, more or less clear, in all centuries
Fig. 1. Seasonal pattern of births of noble people (male and female) (a) from the 15thto 17th
cen-tury and (b) from the 18thto 20thcentury (100-indices)
Source: WW-Person. a.
There is a general tendency towards uniformity, i.e. the differences of birth num-bers in in all months across the year become smaller. The strong fluctuations in the
15thcentury (with maximum in October and minimum in December) result probably
from the smallness of the sample – there are only 1907 births recorded in
WW-Person. Remarkably, the fluctuations in the 20thcentury are stronger than in the 19th.
Seasonality of deaths. Figures 2 and 3 show the seasonality of deaths for women for
the period from the 16thto the 20thcentury and for men for the periods between
the 14thand 17th, and from the 18thto the 20thcentury. (The curves for noblemen
were presented in two figures since one figure showing all curves would be too complex.) There are clear differences between the early and the late male patterns on the one hand, and the female patterns on the other.
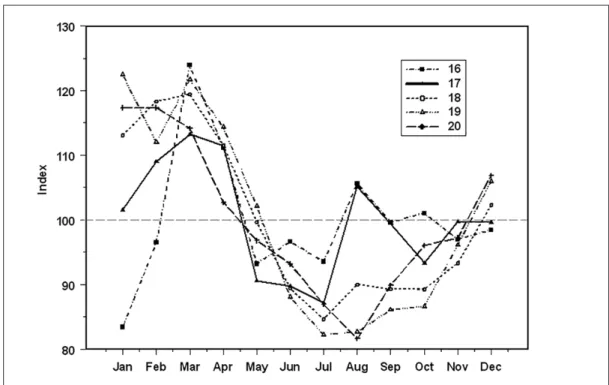
Considered through all centuries, most noblewomen died in March, which is the end of winter and a period of many births; compare with Figure 1. Furthermore,
there is a relative maximum of deaths in August in the 16th, 17th and 18th century,
which is perhaps related to the relative birth maximum in August, or perhaps to summer diseases. The general female death seasonality is retained over the centuries and there is only a weak tendency towards uniformity. (As with the births in
December of 15thcentury, we see the January minimum of deaths of women in the
16th century as a statistical artefact – also here the total number of persons
includ-ed is small, only 3.604.) In the 18th and 19th century, a relative maximum can be
located in August, which, however, is not related to births, but perhaps to summer diseases.
Fig. 2. Seasonal pattern of deaths of noblewomen from the 16thto the 20thcentury (100-indices)
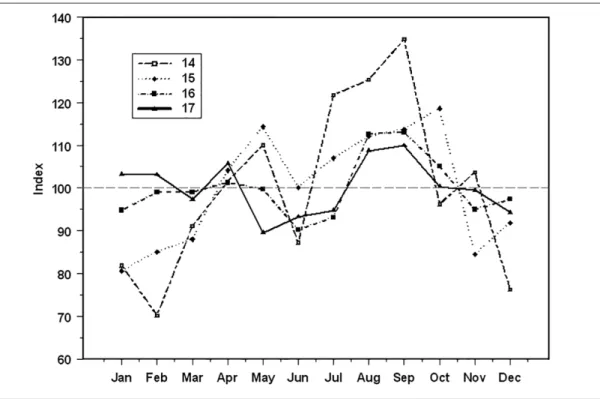
Fig. 3. Seasonal pattern of deaths of noblemen (a) from the 14thto 17thcentury and (b) from the
18thto 20thcentury (100-indices)
Source: WW-Person. a.
From the 14thto the 17thcentury, the majority of noblemen died in the summer
half-year, between May and September, see Figure 3a. Over the centuries the
fluc-tuations become smaller: while in the 14th century there is a huge maximum of
death numbers in summer time, in the 17thcentury the death distribution is already
nearly uniform.
This pattern is completely different from the death pattern of noblewomen and thus can hardly be explained by summer diseases. So, there must be a difference in the mode of life of noblemen in comparison to that of noble women.
This pattern clearly contrasts with the pattern of noblemen’s deaths in the
sec-ond period between the 18thand 20th century, shown in Figure 3b. After a
transi-tional century, the 17th, the change is so abrupt and clear like a physical phase
tran-sition. Suddenly, the maximum of death numbers has shifted to the year’s first quar-ter, while in summer and early autumn the numbers of deaths have declined con-siderably. The pattern is now similar to that of noblewomen, perhaps a bit more uniform across the course of the year.
4. Discussion
Births. There are remarkable differences between the curves in Figure 1, and figure
1 in Régnier-Loilier and Rohrbasser (2011), which shows the seasonal pattern of
births in France from the 17thto 20thcentury, based on Dupâquier (1976). This
fig-ure is reproduced here as Figfig-ure 4. It shows a clear tendency towards uniformity, i.e. of reduction of the fluctuations of month values for all social classes. In contrast,
Fig. 4. Seasonal pattern of births in France from the 17thto 20thcentury (100-indices)
for the noblemen such a clear and beautiful pattern cannot be confirmed. An expla-nation may be a greater geographical homogeneity of the selected French
popula-tion, which for the 17th century is restricted to northern France. Furthermore,
because of the general tendency towards uniformity, this can be seen also as an example for changes in the fertility and mortality patterns, changes which are believed to have started in the upper classes, see Burström and Bernhardt (2001), Haines(1985), Preston and Haines (1991), Woods (1984) and Woods, Watterson and Woodward (1988).
However, the main minima (December and June) and maxima (March, August)
coincide, with exception of the 20th century. The explanations given in
Régnier-Loilier and Rohrbasser (2011) are probably also valid for the WW-Person data: the minimum in December is related to the period of Lent; the minimum in June is related to the time before Christmas (Advent); the maximum in March can be explained by the resumption of sexual relations after Easter.
Figure 1 in Manfredini (2007) indicates remarkable differences for the 19th
cen-tury between Italy and WW-Person. While for the latter the birth maximum is in May-June (where in Italy it is a minimum), in Italy the maximum is in March.
Deaths. The death statistics based on WW-Person shows some relation to social
fac-tors, which are perhaps clearer than for the births. The large numbers of deaths in March have been observed by many authors and discussed thoroughly in Rau (2007). In the case of women, the fact that March is a time of increased child-bearing might play a role. A similar explanation may be used for the maximum of deaths for women in August (Figure 2.6 in Rau 2007, shows that seasonal mortali-ty in Ancient Rome has a maximum in September for both sexes. A comparable sit-uation is described in Dalla Zuanna and Rosina 2011).
Obviously, since the 18thcentury a big difference in life conduct between
noble-men and noblewonoble-men has faded. This becomes visible in similar death patters of
both sexes since the 18thcentury.
It is interesting to compare Figure 3b with figure 6 in Fornasin, Breschi and Manfredini (2010). In that paper the mortality of cardinals as a small subset of the upper class is studied. The overall pattern of seasonality (for the time interval 1850-1900) is quite similar to that in Figure 3b. However, the influence of winter is stronger, the index attains a maximum of 140 in February. The minimum 100-index appears in June (below 60, smaller than for the noblemen data) and in August there is a temporal maximum of 100, as for the noblemen. Fornasin, Breschi and Manfredini (2010) compared the seasonal mortality of cardinals with those of the elderly male population of Lazio (the Italian county of which Rome is the capital) for 1873-1878. The pattern is similar to that for the cardinals, but it is a bit more uniform.
Also, figure 2.8 in Rau (2007) is quite similar to figure 3b of the present paper. This figure, based on Wrigley et al. (1997), shows the seasonality of deaths for England between 1580 and 1837 for both sexes. It appears particularly interesting
that the curve for 1580-1649 as well as that for the 17th century in figure 3a both
However, what may be the explanation for change of the death pattern between
the 17thand 18thcentury? Since it is observed only for men, it cannot be explained
by a climatic change (which happened in this time; the so-called ‘Little Ice Age’ began) or by diseases. The authors explain it with tremendous changes in the ‘busi-ness of war’. In the early centuries the majority of noblemen had their main job as knights with horses and knaves, and their castles often played a military role. In those times, military actions were preferably carried out during the summer and early autumn; while during winter the nobles retreated to their winter residencies.
From the 16thcentury onwards, larger armies of soldiers (‘lansquenets’) who were
often ruled by central powers or sovereigns appeared, and they became the stan-dard during absolutism. Thus a large percentage of noblemen ceased to take part in military actions and died in peace at home, a place that now had morphed from castle to modest manor house. Thus, the decline of the noble class is reflected in the shift of the male death maximum.
Bibliography
F. Fernandez de Bethencourt 1882-1884,
Annuario de la nobleza de España, Est. Tip.
de Fortanet, Madrid.
J.-N. Biraben 1977, La mortalité des éveques
siégeant entre 1220 et 1458 sur le territoire actuel de la France, «Population», 32, hors
série, 467-480.
M. Breschi, M. Livi Bacci 1986, Saison et climat
comme contraintes de la survie des enfants.
L’expérience italienne au XIXe siécle,
«Population», 41, 1, 9-35.
B. Burke 1953, A Genealogical History of the
Peerages and Knightages of the British Empire, Harrison and Sons, London.
B. Burström, E. Bernhardt 2001, Social
Differentials in the Decline of Child Mortality in Nineteenth Century Stockholm, «Eu
-ropean Journal of Public Health», 11, 1, 29-34.
G. Dalla Zuanna, A. Rosina 2011, An Analysis
of Extremely High Nineteenth-Century Winter Neonatal Mortality in a Local Context of Northeastern Italy, «European
Journal of Population», 27, 1, 33-55. M. Dupâquier 1976, Le mouvement saisonner
des naissances en France (1953-1973), PhD
Thesis, Université de Paris 1 (Pantheon-Sorbonne).
H.F. von Ehrenkrook, W. von Huck, C. Franke 1953-2012, Genealogisches Handbuch
des Adels, Band I-CXXIV, Starke, Limburg
an der Lahn.
F.W. Euler 1995, Genealogische Sammlungen, Institut für Personengeschichte, Bensheim. A. Fornasin, M. Breschi, M. Manfredini 2010,
Mortality Patterns of Cardinals (Sixteenth-Twentieth Centuries), «Population», 65,
631-652.
M.R. Haines 1985, Inequality and Child
Mortality: a Comparison of England and Wales, 1911, and the United States, 1900,
«Journal of Economic History», 45, 4, 885-912.
T.H. Hollingsworth 1975, A Note on the
Medieval Longevity of the Secular Peerage, 1350-1500, «Population Studies», 29, 1,
155-159.
N. Ikonnikov 1956-1961, La Noblesse de
Russe. Copie des livres généalogiques de l’Union de la noblesse russe, A1-Z2,
Bibliothèque slave, Paris.
S. Kekulé von Stradonitz 1898-1904,
Ahnentafel-Atlas. Ahnentafeln zu 32 Ahnen der Regenten Europas und ihrer Gemahlinnen,
J.A. Stargardt, Berlin.
P. Litta 1819-1902, Famiglie celebri italiane, Presso Paola Emilio Giusti stampadore, Milano (rist. anast. 1977, Forni, Bologna). M. Manfredini 2009, Birth Seasonality in
Present-Day Italy, 1993-2005, «Human
Ecology», 37, 2, 227-234.
J. Perthes 18111942, Gothaische Genea
-logische Taschenbücher der Fürstlichen Häuser, Verlag Justus Perthes, Gotha.
S.H. Preston, M.R. Haines 1991, Fatal Years:
America, Princeton University Press, Prin
-ceton.
R. Rau 2007, Seasonality in Human Mortality.
A Demographic Approach, Springer,
Berlin-Heidelberg.
A. Régnier-Lolier 2010, Changes in the
Seasonality of Births in France from 1975 to the Present, «Population», 65, 1, 145-186.
A. Régnier-Lolier, J.-M. Rohrbasser 2011, Is
there a Childbearing Season?, «Population
and Societies», 474, 1-5.
D. Schwennicke (herausgegeben von) 1977-2011, Europäische Stammtafeln. Stammtafeln
zur Geschichte der europäischen Staaten,
Neue Folge, band I-XXVIII, Klostermann, Frankfurt am Main.
R. Woods 1984, Social Class Variations in the
Decline of Marital Fertility in Late Nineteenth-Century London, «Geografiska
Annaler», Series B, Human Geography, 66, 1, 29-38.
R.I. Woods, P.A. Watterson, J.H. Woodward 1988, The Causes of Rapid Infant Mortality
Decline in England and Wales, 1861-1921,
Part I, «Population Studies», 42, 3, 343-366.
E.A. Wrigley, R.S. Davies, J.E. Oeppen, R.S. Schofield 1997, English Population History
from Family Reconstitution, 1580-1837,
Cambridge University Press, Cambridge. Z. Zao 1997, Mortality Patterns in Chinese
History: Evidence from a Recorded Clan Population, «Population Studies», 51, 2,
Riassunto
Le tendenze nella stagionalità di nascite e decessi dei nobili europei tra il XIV e il XX secolo
Questo studio utilizza dati tratti da WW-Person, un sistema informatico che fornisce informazioni sulle vite dei nobili europei adatte a un’analisi demografico-statistica a partire dal XIV secolo. L’analisi statistica fornisce informazioni sul numero mensile di nascite e morti per secoli. Il comportamento delle nascite è simile a quello evidenziato da altre statistiche già note: i valori massimi sono toccati in marzo e agosto e quelli minimi in giugno e dicembre. Tuttavia, questa stagionalità è meno chiara in questo caso, rispetto alle popolazioni che non consistono solo di nobili…
Il comportamento delle morti mostra un pattern più complesso: (i) vi sono grandi differenze tra i sessi e (ii) vi è un notevole mutamento nel pattern relativo agli uomini tra il XVII e il XVIII secolo. Mentre nel periodo più antico il massimo di morti maschili è osservato tra agosto e settembre, a partire dal XVIII secolo il massimo si sposta a marzo, mentre per le donne il massimo si colloca su marzo durante tutto il periodo. Pertanto, si può ipotizzare che vi sia una relazione con le modalità di conduzione delle guerre.
Summary
Trends in the Seasonality of Births and Deaths of European Nobleman from the 14thto the 20thCentury
This study uses data from WW-Person, an information system for life-time data of European noblemen, which contains data feasible for demographical statistical analysis beginning with the 14thcentury.
The statistical analysis yields information on monthly numbers of births and deaths per century. The behaviour of birth numbers is similar to already known statistics: there are maxima in March and August and minima in June and December. However this seasonality is less clear than in populations which consist not only of members of the noble class…
The death numbers show a more complex pattern: (i) there are big differences between the sexes and (ii) there is a tremendous change in the pattern for men between the 17th and 18thcentury. While in early times men’s maximum death numbers are observed in August-September, from the 18th century onwards the maximum has shifted to March, while for women the maximum consistently lies in March. So the authors suggest that there is a relationship to the way of conducting wars.
Parole chiave
Nobili; Europa centrale; Nascite; Decessi; Stagionalità; Differenze tra i sessi.
Keywords