Università Politecnica delle Marche
Ph.D. in Agriculture, Food and Environmental Sciences
XXX cycle
Application of infrared spectroscopy
technique for the assessment of solid
biofuels quality
Ph.D. Thesis
Manuela Mancini
Tutor: Co-tutor:
Prof. Giuseppe Toscano Prof. Åsmund Rinnan
I
Preface
This Ph.D. thesis, titled ‘Application of infrared spectroscopy technique for the assessment of solid biofuels quality’, is submitted as a requirement for obtaining the Ph.D. Degree from the Ph.D. School of Agriculture, Food and Environmental Sciences (Università Politecnica delle Marche), with the further mention of Doctor Europaeus.
The work presented in this Ph.D. thesis has been carried out during the three-years research activities conducted by the author, Manuela Mancini, at the Department of Agriculture, Food and Environmental Sciences, Università Politecnica delle Marche (Ancona), under the supervision of Prof. Giuseppe Toscano. Part of the work has been done at the Department of Food Science (Chemometrics and Analytical Technology Section), University of Copenhagen, under the supervision of Prof. Åsmund Rinnan.
Manuela Mancini Ancona, November 2017
Acknowledgements
II
Acknowledgements
First of all, I would like to give a special thank to all the research group. In particular, it is a pleasure to thank Prof. Giuseppe Toscano who trusted me and gave me the opportunity to perform these three years research. He encouraged me in trying and working, always showing great enthusiasm and strongly believing in the successful of our research. I am really grateful to all the Biomass Lab group who teaches me not only about science and laboratory analysis, but also the priceless value of a good cooperation between colleagues. Thank you for all the laughs during the lunch time, for all the suggestions and for always giving me help. I would like to give a huge “Tak” to Prof. Åsmund Rinnan who has been my supervisor during my six-months stay at the Chemometrics & Analytical Technology section (CAT) of the Department of Food Science (University of Copenhagen). He has introduced me to the marvellous, crazy world of chemometrics and I am very much grateful not only for the pleasure to work together, but also for going on with the collaboration and for being always carried away with new research ideas. I would like to thank also all the CAT section for the nice moments and for all the friends and nice people that gave me the opportunity to meet. I never expected such a friendly and welcoming atmosphere well mixed with high quality science.
These acknowledgment will be not complete without mentioning my friends. Some are close also by distance, others just by mind. In any case, all of them are just so wonderful in a thousand of different ways and I can not ask for more than that.
Finally, my deepest acknowledgment belongs to my family. Absolutely not normal, sometimes over the top, but I would not change for anything. Thank you for always being there, for making me laugh and keep my thoughts out away. I dedicate this thesis to my grandparents, that even if they are no more with me, they still are my roots and my force.
III
List of publications
Paper I
Duca, D., M. Mancini, G. Rossini, C. Mengarelli, E. Foppa Pedretti, G. Toscano and A. Pizzi (2016). "Soft Independent Modelling of Class Analogy applied to infrared spectroscopy for rapid discrimination between hardwood and softwood." Energy 117: 251-258.
Paper II
Duca, D., A. Pizzi, G. Rossini, C. Mengarelli, E. Foppa Pedretti and M. Mancini (2016). "Prediction of Hardwood and Softwood Contents in Blends of Wood Powders Using Mid-Infrared Spectroscopy." Energy & Fuels 30(4): 3038-3044.
Paper III
Toscano, G., Å. Rinnan, A. Pizzi and M. Mancini (2017). "The Use of Near-Infrared (NIR) Spectroscopy and Principal Component Analysis (PCA) To Discriminate Bark and Wood of the Most Common Species of the Pellet Sector." Energy & Fuels 31(3): 2814-2821.
Paper IV
Mancini, M., Å. Rinnan, A. Pizzi and G. Toscano (2018). "Prediction of gross calorific value and ash content of woodchip samples by means of FT-NIR spectroscopy." Fuel Processing Technology 169: 77-83.
Paper V
Mancini, M., Å. Rinnan, A. Pizzi and G. Toscano, "Use Of FT-NIR Spectroscopy For The Detection Of Residues From Wood Processing Industry In The Pellet Sector". 2017. Conference proceedings submitted in: ICNIRS 2017 DENMARK – Copenhagen 11-15 June 2017.
List of publications
IV Paper VI
Mancini, M., Å. Rinnan, A. Pizzi, C. Mengarelli, G. Rossini, D. Duca and G. Toscano (2017). "Near infrared spectroscopy for the discrimination between different residues of the wood processing industry in the pellet sector". Fuel. Manuscript under review.
Paper VII
Mancini, M., G. Toscano and Å. Rinnan. “Study of the scattering effects on NIR data for the prediction of ash content using MSC correction factors”. Manuscript draft.
Other publications
Toscano, G., D. Duca, E. Foppa Pedretti, A. Pizzi, G. Rossini, C. Mengarelli and M. Mancini (2016). "Investigation of woodchip quality: Relationship between the most important chemical and physical parameters." Energy 106: 38-44.
Duca, D., A. Pizzi, M. Mancini, G. Rossini, C. Mengarelli, A. Ilari, G. Lucesoli, G. Toscano and E. Foppa Pedretti (2016). "Fast measurement by infrared spectroscopy as support to woody biofuels quality determination." Journal of Agricultural Engineering 47(1): 5.
Pizzi, A., G. Toscano, E. Foppa Pedretti, D. Duca, G. Rossini, C. Mengarelli, A. Ilari, A. Renzi and M. Mancini (2017). "Energy characteristics assessment of olive pomace by means of FTNIR spectroscopy." Energy. Manuscript under review.
Pizzi, A., E. Foppa Pedretti, D. Duca, G. Rossini, C. Mengarelli, A. Ilari, M. Mancini and G. Toscano (2017). "Emissions of heating appliances fuelled with agropellet produced from vine pruning residues and environmental aspects." Renewable Energy. Manuscript under review.
V
Foppa Pedretti, E., D. Duca, G. Toscano, C. Mengarelli, G. Rossini, A. Pizzi, M. Mancini, D. Tesei and A. Ilari (2017). "Validity of the mechanical threshing of onion seeds from the point of view of seed quality." Agriculture. Manuscript accepted for publication.
Conference proceedings: M. Mancini, A. Pizzi, Å. Rinnan, C. Mengarelli, D. Duca, G. Rossini, E. Foppa Pedretti, A. Ilari and G. Toscano (2016). “Spettroscopia nel vicino infrarosso e analisi multivariata dei dati come supporto per la determinazione della qualità del pellet”. In: Proc. NIR ITALIA 2016 ATTI DEL SIMPOSIO. 7 Simposio italiano di Spettroscopia NIR. Milano, Ottobre 2016. ISBN 978-88-941-1531-4.
Abstract in conference proceedings: Mancini M., A. Pizzi, C. Mengarelli, G. Rossini, E. Foppa Pedretti, G. Toscano, A. Renzi and D. Duca (2016). “Energy characteristics assessment of residues by means of infrared spectroscopy.” In: Mechanization and new technologies for the control and sustainability of agricultural and forestry systems MECHTECH 2016 Conference, Alghero, Italy, 29th May-1st June 2016. ISBN 979-12-200-1098-6.
Author’s contribution
VI
Author’s contribution
Paper I: Dr. Andrea Pizzi and Dr. Daniele Duca had the main responsibility for planning the work, interpretation of the results and writing the publication under the supervision of Prof. Giuseppe Toscano and Prof. Ester Foppa Pedretti. The author performed the laboratory work and the infrared analysis with the help of Dr. Chiara Mengarelli, Dr. Giorgio Rossini and Dr. Andrea Pizzi. The author assisted and helped in the multivariate data analysis and in the writing process.
Paper II: the author had the main responsibility for planning the work, interpretation of the results and writing the publication under the supervision of Prof. Ester Foppa Pedretti. The author performed the laboratory work and infrared analysis with the help of Dr. Chiara Mengarelli, Dr. Giorgio Rossini and Dr. Andrea Pizzi. The author with the help of Dr. Andrea Pizzi had the main responsibility for the multivariate data analysis and infrared analysis. Dr. Duca assisted and helped in the organization of the experimental work and in the writing process.
Paper III: the author was responsible for planning the work, interpretation of the results and writing the publication under the supervision of Prof. Åsmund Rinnan and Prof. Giuseppe Toscano. The laboratory work and infrared analysis were performed by the author and Dr. Andrea Pizzi. The author and Prof. Åsmund Rinnan had the main responsibility for the multivariate data analysis.
Paper IV: the author had the main responsibility for planning the work, interpretation of the results and writing the publication together with Prof. Åsmund Rinnan. The author carried out the laboratory analysis and infrared analysis together with Dr. Andrea Pizzi and under the supervision of Prof. Giuseppe Toscano.
Paper V: the author had the main responsibility for planning the work, interpretation of the results and writing the publication under the supervision of Prof. Åsmund Rinnan and Prof. Giuseppe Toscano. The laboratory work and infrared analysis were performed by the author and Dr. Andrea Pizzi. The author with the help of Prof. Åsmund Rinnan had the main responsibility for the multivariate data analysis.
VII
Paper VI: the author was responsible for planning the work, interpretation of the results and writing the publication under the supervision of Prof. Åsmund Rinnan and Prof. Giuseppe Toscano. The author performed the laboratory work and the infrared analysis with the help of Dr. Andrea Pizzi. Prof. Åsmund Rinnan assisted in the modelling studies. Dr. Chiara Mengarelli and Dr. Giorgio Rossini assisted and helped in the organization of the experimental work and Dr. Daniele Duca in the writing process.
Paper VII: the author was responsible for planning the work, interpretation of the results and writing the publication together with Prof. Åsmund Rinnan. The author and Prof. Åsmund Rinnan had the main responsibility for the multivariate data analysis and infrared analysis. The work was carried out under the supervision of Prof. Giuseppe Toscano.
List of abbreviations
VIII
List of abbreviations
Ac Ash content
EMSC Extended Multiplicative Signal Correction
FT Fourier transform
GCV Gross calorific value
iPLS interval Partial Least-Squares
IR Infrared
LV Latent variable
Mc Moisture content
MIR Medium infrared
MVA Multivariate data analysis
NIR Near infrared
OT Overtone
PC Principal Component
PCA Principal Component Analysis PLS Partial Least Squares regression
PLS-DA Partial Least Squares - Discriminant Analysis
Q2 Coefficient of determination (calculated on predicted / cross-validated values)
R2 Coefficient of determination (calculated on calibration values)
RMSE Root Mean Square Error (calculated on calibration values) RMSECV Root Mean Square Error of Cross Validation
IX
ROC Receiver Operating Characteristic
rPLS recursive weighted Partial Least Squares regression SIMCA Soft Independent Modelling of Class Analogy VIP Variables Important in Projections
Abstract
X
Abstract
Energy production is one of the main important causes of greenhouse gases emission and it can be a huge problem considering the continuous worldwide increase in energy demand. Aware of the importance of finding new ways of clean energy production and of the necessity to limit the dependency on fossil fuels, European policy currently promotes renewable energy sources. Among the different types, solid biofuels - in the form of pellet, woodchip, briquettes and others – are some of the most promising alternative.
The fast growth of the biofuels market highlights the problem of product quality, which has strong repercussions for technical, environmental, and economic aspects. Moreover, the variability of the material characteristics leads to the need to check its quality in order to ensure a good product and make it competitive with the other fuels. In this context, infrared spectroscopy aims to be a new method of quality control. Considering the economic returns of the sector, conventional laboratory analyses are simply too costly. Furthermore, they are long, complex and require skilled operator, not matching the real necessities of the market that needs to have the results as fast as possible.
This Ph.D. project focused on developing an alternative low cost method of biomass quality control based on infrared spectroscopy. Indeed, the first part of the thesis includes four studies of application of infrared spectroscopy to investigate the qualitative parameters of biofuels. In particular, the first and second studies concern the discrimination between hardwood and softwood samples and the subsequent prediction of hardwood/softwood content in blend samples. The third and fourth studies are related to the discrimination between virgin wood and residues from wood processing industries, i.e. bark and treated wood.
The second part of the project shows examples of application of near infrared spectroscopy for the prediction of the quantitative parameters of biofuels, in particular ash content, gross calorific value and moisture content. The studies were performed using both a laboratory spectrophotometer and an
on-XI
line instrument customized for laboratory analysis. A deepening was carried out on the influence of scattering effect for the ash content prediction.
The results are preliminary, but really promising. The outcomes of this Ph.D. project confirm the possibility to use infrared spectroscopy, coupled with chemometrics, as a screening tool for getting information about the main parameters of biomass, ensuring a more effective and extensive monitoring of the quality control, especially in the crucial steps of the bioenergy chain.
1
Table of contents
Preface ... I Acknowledgements ... II List of publications ... III Author’s contribution ... VI List of abbreviations ... VIII Abstract ... X
Table of contents ... 1
1. Introduction ... 3
1.1 Background and aim ... 3
1.2 Outline of the thesis ... 5
2. Biomass quality ... 7
2.1 Biomass: general remarks ... 7
2.2 Current biomass quality control system ... 9
2.3 Toward a new system of biomass control ... 14
3. Infrared spectroscopy and chemometrics ... 17
3.1 Fundamentals of infrared spectroscopy ... 17
3.2 Spectrophotometers ... 21
3.3 Chemometrics ... 23
3.3.1 Principal Component Analysis (PCA) ... 26
3.3.2 Partial Least Square regression (PLS) ... 28
3.3.3 Soft Independent Modelling of Class Analogy (SIMCA) ... 30
3.3.4 Variable selection methods ... 30
4. Infrared spectroscopy for qualitative analysis of biomass ... 34
4.1 Discrimination between hardwood and softwood samples (Paper I) ... 35
4.2 Prediction of softwood/hardwood contents in blends (Paper II) . 45 4.3 Discrimination between bark and wood (Paper III) ... 51
Table of contents
2
4.4 Discrimination between treated and virgin wood (Paper V and Paper
VI) ... 60
5. Infrared spectroscopy for quantitative analysis of biomass ... 72
5.1 Prediction of gross calorific value and ash content of woodchip samples (Paper IV) ... 72
5.2 Influence of the scattering effects for the prediction of ash content (Paper VII) ... 80
5.3 Laboratory customized on-line measurements for the prediction of the key-parameters of biomass ... 87
5.3.1 Materials and methods ... 87
5.3.2 PCA results... 89
5.3.3 PLS results ... 90
6. Conclusions and perspectives ... 94
3
1.
Introduction
1.1
Background and aim
Currently, biomass is the third largest primary energy resource in the world after coal and oil (Purohit, Tripathi et al. 2006) and can include different types of material: plant forest, residues from agricultural and forest production and organic waste from industry, humans and animals. Biomass contributed approximately 5.7% to the European Union’s energy consumption in 2008 (European Union 2009), predominately through heat and power applications. Considering the concern about greenhouse gas emissions, the increasing energy demand, the decreasing availability of fossil fuels and the variability of their price, European public policy promotes the energy production from renewable resources. One of the targets is that 20% for the share of energy consumption has to come from renewable sources by 2020 (EU Directive 2009/28/CE).
Solid biofuels as pellets, woodchips, briquettes and others can contribute significantly to this aim with a growing market in the last years (Proskurina, Heinimö et al. 2015, Eurostat Accessed: March 2015). Considering their increasing utilization, European standards for solid biofuels (EN ISO 17225-series) are continuously under development by CEN technical committee 335 in order to ensure the biomass quality. The biofuels quality control is an important tool to trace type and provenance of feedstock and its physical and chemical characteristics, which affect the efficiency of energy conversion systems and the related emissions (Toscano, Duca et al. 2014, Gehrig, Pelz et al. 2015). The chemical composition of biofuels drives the choice of conversion technology and process control in the selected energy conversion pathway (Fagan, Everard et al. 2011).
According to EN ISO 17225-series standards, a biomass is classified in a class of quality rather than in another one, according to a number of chemical-physical characteristics and quality features (i.e. origin and source) that have to
Introduction
4
meet specified limits. Some quality parameters, such as type of wood (hardwood/softwood), presence of bark or residues from wood processing industry, are difficult to be achieved by conventional analysis or microscopy techniques because time- and money-consuming. As consequence, such methods don’t match the real needs of bioenergy operators that often have to take decisions in a short time. This is especially true for densified biomass such as pellets. For these kind of biofuels, traceability is particularly complex since wood is milled, loosing original structure, and different materials can participate to their blend in a concealed way, causing unpleasant effects in terms of combustion efficiency and related emissions.
A valid help comes by infrared spectroscopy, a rapid, cheap and non-destructive technique that can represent an efficient alternative to the long and expensive standard methods. Thanks to this, both qualitative (origin and source) and quantitative (chemical-physical parameters) features of the raw material might be defined simultaneously with a single and fast measurement. It is a relatively new technique, widely used due to its potential to predict a broad variety of attributes in several sectors, e.g. food, pharmaceutical and agricultural industries.
Only a limited number of studies has also investigated the application of infrared (IR) spectroscopy to the field of biomass control. Some of the most relevant are reported in this chapter and in the following ones of this Ph.D. thesis. Fagan et al. (Fagan, Everard et al. 2011) examined the possibility to employ near infrared (NIR) spectroscopy and chemometrics to predict moisture, ash, carbon contents and calorific value of two dedicated bioenergy crops (Miscanthus and short rotation coppice willow) showing that moisture and calorific value prediction models had excellent accuracy, while carbon and ash models were fair and poor, respectively. Gillespie et al. (Gillespie, Everard et al. 2015) also predicted the parameters of moisture, ash, carbon contents and calorific value of different pellet with hyperspectral imaging instrument. Moisture and gross calorific value prediction models had good and excellent accuracy, respectively, while the ash and carbon models were deemed good and fair, respectively. Everard et al. (Everard, McDonnell et al. 2012) determined the accuracy of visible and NIR spectroscopy to predict gross calorific value of dedicated bioenergy crops.
Huang et al. (Huang, Han et al. 2009) have looked at the use of NIR as an alternative method to predict the carbon, hydrogen, and nitrogen contents and the calorific value of straw. Liu et al. (Liu, Ye et al. 2010) developed a predictive
5
model using Fourier transform near infrared (FT-NIR) spectroscopy coupled with multivariate analysis. The aim is the chemical prediction of glucan, xylan, galactan, arabinan, mannan, lignin, and ash concentration in two types of biomass feedstocks (corn stover and switchgrass).
Some studies were referred also to the real time prediction of biomass parameters during conversion processes. Lestander et al. (Lestander, Johnsson et al. 2009) investigated the usefulness of online NIR spectroscopy in a pelletizing process for predicting moisture content, sawdust blends and energy consumption of the pellet press. Lestander et al. (Lestander, Finell et al. 2012) tested NIR spectroscopy also in a newly-constructed pellet plant. The factors analysed were species composition and moisture content of the dried wood particles before pelletizing.
Infrared spectroscopy and chemometrics have been also used to get qualitative information about wood, but the number of studies is limited and only few papers can be found for the solid biofuels sector. While several authors investigated the possibility to discriminate between hardwood and softwood samples (Lestander, Johnsson et al. 2009, Chen, Ferrari et al. 2010, Russ and Fiserova 2011, Lestander, Finell et al. 2012, Yang, Lu et al. 2012), no study has been carried out on bark determination in wood samples in the biomass sector or to detect residues from wood processing industry in wood powder for pelletizing process.
Summarizing, literature research shows that IR spectroscopy was already used to investigate some aspects of biomass quality control, but the number of studies is limited in comparison to other research fields. Some aspects have been already developed, but many others still have to be taken into account. In particular, the assessment of the biomass quality should focus on qualitative information concerning the origin and source of the material and the main quantitative parameters (e.g. ash content). The overall aim of this Ph.D. research activity was to assess the biomass quality using IR spectroscopy coupled with chemometrics. The study has been especially focused on the possibilities and the limitations in applying IR spectroscopy for detailed biomass control.
1.2
Outline of the thesis
The thesis is mainly based on six articles either published or under review for publication by peer-reviewed journals and one manuscript under finalization.
Introduction
6
The main focus is the development of an innovative analytical methodology based on infrared spectroscopy and chemometrics to characterize solid biofuels from a chemical-physical and qualitative point of view.
A brief description of the outline of this thesis follows.
First of all an overview of the state-of-art of the biomass sector is presented (Chapter 2). In particular, the current system of quality control, its problems and bottle-necks are described.
In Chapter 3, infrared spectroscopy is presented as a possible solution to the problems explained in the previous chapter. The fundamentals of medium infrared (MIR) and near infrared (NIR) spectroscopy technique are provided. Furthermore, the chapter describes how information from spectral data can be got using multivariate data analysis and chemometrics. The main multivariate analysis techniques used in this thesis will be described shortly.
Chapters 4 and 5 illustrate the experimental results of applying infrared spectroscopy in the biomass sector. The main quality key-parameters of solid biofuels, such as calorific value, ash content and moisture content, and the origin and source of the material, as defined by the standards EN ISO 17225-series, have been considered.
Finally, Chapter 6 contains a summary of the reached results and perspectives and ideas for future research.
The main manuscripts written during the three-years Ph.D. are appended at the end of this book. Paper VII is not included since it has not been submitted at present time.
7
2.
Biomass quality
2.1
Biomass: general remarks
Biomass covers organic, non-fossil material of biological origin, which can be converted to fuel – or more precisely biofuel considering the origin of the material – for heat and electrical generation and therefore is considered a potential renewable energy source (EN ISO 17225-1:2014). As consequence it can include products, by-products and residues from agriculture, forestry and relative industries, as well as the non-fossil, biodegradable parts of industry and municipal solid waste, planted biomass and aquatic biomass (Long, Li et al. 2013). Biomass can be divided into several categories according either to their traded forms or their origin and source. The latter divides biomass into woody biomass, herbaceous biomass, fruit biomass, aquatic biomass and blends and mixtures (EN ISO 17225-1:2014). Table 2-1 gives a categorization of biomass resources according to their origin and source.
The components of lignocellulosic biomass are mainly three polymers: cellulose, hemicellulose and lignin. Cellulose and hemicellulose are polysaccharides. In detail, cellulose (C6H10O5)n is composed of hundreds of linked glucose molecules. The cellulose chains are connected together by hydrogen and van der Waals bonds causing the cellulose to be packed into microfibrils. Microfibrils are covered by hemicellulose and lignin. The cellulose consists in crystalline and amorphous cellulose, characterized by a well-ordered structure and a randomly ordered structure, respectively (Xu, Yu et al. 2013, Bajpai 2016). Hemicellulose contains a much more complicated structure and linkages than cellulose, consisting of more than one type of monosaccharide unit. Depending on the variety of biomass, hemicellulose may contain xyloglucan, xylan, glucomannans, galactoglucomannans, etc. (Xu, Yu et al. 2013, Bajpai 2016). Lignin has a very complicated and large molecular structure, too. It is made of phenolic polymers that consist of three types of phenylpropane units: p-coumaryl alcohol, coniferyl alcohol, and sinapyl alcohol (Xu, Yu et al. 2013, Bajpai 2016).
Biomass quality
8
Table 2-1: categorization of origin-based solid biofuels. Table adapted from (EN ISO 17225-1:2014). Categories Materials
Woody biomass Forest, plantation and other virgin wood
By-products and residues from wood processing industry
Used wood
Blends and mixtures
Herbaceous biomass Herbaceous biomass from agriculture and horticulture By-products and residues from food and herbaceous processing industry
Blends and mixtures
Fruit biomass Orchard and horticulture fruit
By-products and residues from food and fruit processing industry
Blends and mixtures Aquatic biomass Algae
Water hyacinth Lake and sea weed Reeds
Blends and mixtures Blends and mixtures Blends
Mixtures
The amount and composition of these constituents in the feedstock can vary greatly due to the complex and heterogeneous nature of the biomass and this influences the choice of the optimum energy conversion technology for each type of material (McKendry 2002, Sluiter, Ruiz et al. 2010). Indeed, the inherent variability of the lignocellulosic biomass deals to the problem of verifying the properties before its use.
Among the different types of lignocellulosic feedstock, this thesis will focus mainly on pellet and woody biomass because of their widespread use as biofuels, the limited weather-related dependencies and several advantages compared to the other biomasses.
Woody biomass is present more or less everywhere, is available in many forms (dedicated and residual biomass) and can be easily stored (Spinelli, Nati et al. 2011, González, Riba et al. 2015). In particular, woodchip is really appreciated
9
because it consists of homogeneous particles with a specific size and it guarantees benefits in terms of increased load density and handling quality (Manzone 2016). In different European countries, and in Italy as well, the number of power plants fuelled with woodchip is increasing and accordingly also the demand for wood fuels (Toscano, Duca et al. 2016).
Pellet is one of the most competitive among the different biofuels, because it presents a higher energy density, a reduced transportation and storage cost and it is durable. Different materials can participate to its blend making it adaptable to different location and feedstock (Obernberger and Thek 2010, Mola-Yudego, Selkimäki et al. 2014). The pelletizing process creates a product with regular cylindrical shape and low moisture content, making possible its use not only in heat and power plants, but also for automatic feeding in small-scale applications (Selkimäki, Mola-Yudego et al. 2010). Moreover, pellet ensures a clean burning and a reduction in ashes and emissions. For all these reasons, pellet is becoming more and more used in different countries, especially in Europe, where the market is increasing rapidly. Italy is the third largest European producer (0.77 million tonnes), but the domestic supply side doesn’t cover the demand: its consumption in 2009 was 1.1 million tonnes (Sikkema, Steiner et al. 2011).
2.2
Current biomass quality control system
The identification and characterization of the chemical-physical composition of a solid fuel is the most important step during the investigation and application of such fuel. This composition is a unique code that characterizes and determines the properties, quality, application perspectives and environmental problems related to any fuels (Vassilev, Baxter et al. 2010).
In fact, it is known that there is an inherent variability in the properties of lignocellulosic material that is influenced by many factors (Dare, Gifford et al. 2001, Hames, Thomas et al. 2003) and this leads to the need to employ standards in order to check the quality of the product. Moreover, considering the increase in biomass demand, the quality could experience a decrease and need to be analysed (Toscano, Duca et al. 2016). Pellet is an example of that. As a results of the rapid growth of pellet market, different raw materials can be used to make up the product apart from woody biomass, making its traceability particularly complex. While, in the past, pellets were mainly made up by pure wood (sawdust, chips or shavings), nowadays - especially in some countries - the supply of pure
Biomass quality
10
wood is no more sufficient and other raw materials were used (Toscano, Riva et al. 2013), causing unpleasant effects and influencing the combustion behaviour and the related emissions. As consequence, it is very important to analyse its quality, as it has strong implications for environmental, technical and economic aspects (Toscano, Riva et al. 2013).
Biofuel quality control might then be an important tool to trace composition, provenance, chemical-physical characteristics of the raw materials, which in turn affect the efficiency in energy conversion systems and the related emissions.
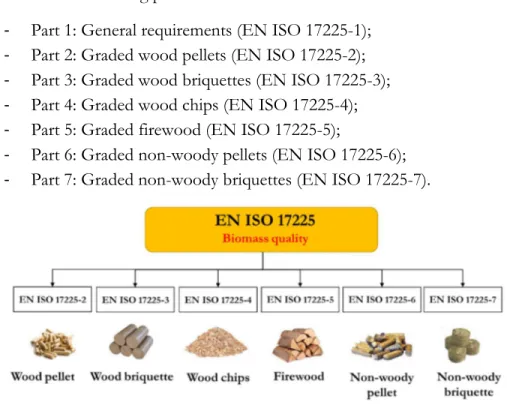
CEN/TC 335 has established a number of standards (EN ISO 17225 series) relating to different solid biofuels, to ensure their quality (Figure 2-1). EN ISO 17225 under the general title “Solid biofuels – Fuel specifications and classes” consists of the following parts:
- Part 1: General requirements (EN ISO 17225-1); - Part 2: Graded wood pellets (EN ISO 17225-2); - Part 3: Graded wood briquettes (EN ISO 17225-3); - Part 4: Graded wood chips (EN ISO 17225-4); - Part 5: Graded firewood (EN ISO 17225-5);
- Part 6: Graded non-woody pellets (EN ISO 17225-6); - Part 7: Graded non-woody briquettes (EN ISO 17225-7).
Figure 2-1: standards EN ISO 17225 series relating to different solid biofuels.
The standards divide the biomass in different quality classes – for example A1, A2 and B for woody pellet – indicating specific limits of chemical-physical parameters and defining attributes like the origin and source of the material.
11
Setting out ranges for several chemical-physical parameters that are relevant to assess biomass quality, the standards indicate also the procedures to determine them. These features are normally achieved by conventional laboratory analysis. In order to ensure the accuracy of the analysis performed and of the returned results, a sampling procedure is required. Hence, a good quality control is straightly linked to a sampling process, especially when considering large bulk of biomass (e.g. plant biomass pile, biomass shipload, feedstock supply in pelletizing/power plant). Standard EN ISO 18135:2017 – Sampling of solid biofuels (EN ISO 18135:2017) – describes the procedure for performing sampling plans and taking samples representative of the whole lot of interest to be delivered to laboratories for quality control. First of all, it is necessary to collect a number of sub-samples depending on the mass of the lot and the heterogeneity of the material. Obviously, a higher number of sub-samples is needed with increasing mass of the lot and degree of heterogeneity. The sub-sample extraction must be carried out with suitable instruments, able to take one sub-sample at a time with specific volumes. The standard defines also the points where to collect the sub-samples and these are often hard to be reached by the operators, such as in big biomass pile. The sub-samples are then collected together to form a sample which is immediately closed in a sealed container in order not to alter the characteristics to be analysed.
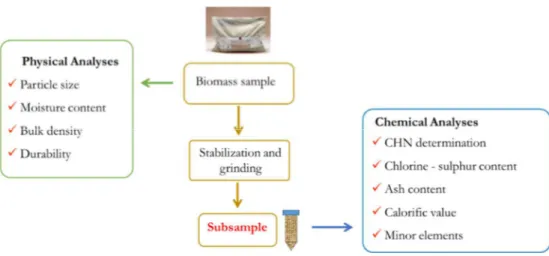
Once arrived at the lab, the biomass sample needs to follow a specific workflow in order to define the right quality class. A summary of the crucial steps to be performed is presented in Figure 2-2.
Figure 2-2: workflow of laboratory analyses for the control of biomass quality. Physical analyses are performed on the biomass sample as received at the lab and chemical analyses on the stabilized and ground material.
Biomass quality
12
First of all, according to UNI EN 14780:2011 standard, part of the material is stabilized at 45 °C for 24 h then ground down to 1 mm of particle size. It is important that the representativeness of the sample, as arrived at the lab, shall not be changed during the sample reduction phase. The sample preparation phase is necessary before the samples are tested for chemical analyses, instead physical analyses are performed on the sample as arrived at the lab without any previous preparation. Some of the main physical analyses consist of particle size, moisture content, bulk density and durability. The moisture content (Mc) is the most important physical characteristic of wood fuels, it depends on different factors (Spinelli, Ivorra et al. 2011) and it influences the net calorific value.
Regarding chemical analyses, the most relevant parameters taken into consideration in the biofuel sector are ash content (Ac) and gross calorific value (GCV). The ash content is one of the most important parameter. It influences combustion efficiency and may cause cleaning and combustion problems, such as slagging in furnaces, fouling of heat exchanger surfaces (Kortelainen, Jokiniemi et al. 2015), corrosion in the combustion device (Werkelin, Skrifvars et al. 2010) and fly ash emissions (Narodoslawsky and Obernberger 1996). The calorific value is a property of a fuel, which determines the energy value of it, and it is relatively constant for wood fuels in their dry status (Erol, Haykiri-Acma et al. 2010). It is an essential parameter for the planning and control of power plants using biomass fuel (Posom, Shrestha et al. 2016). It is important for setting the price of the product and its value is influenced by the moisture content.
The analytical methodologies adopted for the determination of GCV, Ac and Mc refer to the standards EN ISO 14918:2010, EN ISO 18122:2015 and EN ISO 18134-2:2015, respectively. In particular, Mc is calculated from the loss in mass of the sample after it was dried at temperature of 105 ± 2 °C in air atmosphere until constant mass is achieved. The Ac is determined incinerating the sample to a controlled temperature of 550 ± 10 °C using a muffle furnace and calculating the mass of the residue remaining after the sample was heated. The gross calorific value is determined in a dynamic mode at 25°C using a bomb calorimeter.
Summarizing, according to EN ISO 17225, the assignment of the quality class of a biomass is based on the origin and source (qualitative information) and the chemical-physical characteristics (quantitative information) of the material. However, this current system of quality control presents some limits.
13
As already described, the chemical-physical parameters are determined with laboratory analysis and considering the procedures defined by the technical standards, but the process turns out to be tedious, long, expensive and requires specialized experts. As a result, these complex analyses are normally not in line with the real necessities of the sector operators involved in the quality control that need to have results as quick as possible in order to make their decision and ensure the biomass quality.
Getting information about the origin and source of the material is particular relevant, such as type of wood (hardwood/softwood) and presence of bark or by-products of wood processing industry (§ Table 2-1). This applies especially to the pellet sector, where the wood is unstructured and milled and different raw material could be used in the pelletizing process, causing problems with traceability and quality trend of the product. These attributes could be determined with laboratory analyses (e.g. microscopy techniques and chemical analysis) but, besides the same disadvantages already listed for the assessment of chemical-physical parameters, no standardized method exists for these features.
Furthermore, the structural and chemical complexity and the heterogeneous nature of the lignocellulosic material lead to the necessity of performing a correct sampling in order to have a proper quality characterization. As already mentioned, the standard EN ISO 18135:2017 – Sampling (EN ISO 18135:2017) – shows the procedure to perform a correct sampling plan and to obtain a sample representative of the whole lot of interest. The principle is based on the fact that every particle in the lot or sub-lot should have the same probability to be included in the sample. This procedure is normally quite long and hardworking and the quality parameters of interest, e.g. calorific value, moisture and ash contents, are determined using only some grams of material compared to the tons of biomass transported by ship or trucks or in input in a biomass plant. Moreover, it is important to point out that sampling procedure, which is the fundamental step to obtain valuable analytical results, requires specialized operators. In fact the employment of non-specialized staff might result in probable errors of the procedure. As a consequence the operators of the biofuel chain (power plants, producers or distributors) have two possibilities: i) to train their own personnel, ii) to assign the sampling at an external laboratory, with an increase in analytical costs. In any case, both solutions are expensive and long.
Biomass quality
14
2.3
Toward a new system of biomass
control
In summary, the current system of biomass quality control is based on specific ranges of chemical-physical parameters and qualitative attributes (origin and source) of the material defined by the international technical standards EN ISO 17225. However, this system presents some limits:
- there are no good standardized procedures set by the standards to determine information about the origin and source of the material with laboratory analyses;
- laboratory analyses that are used to define the chemical-physical parameters required by the technical standards are long and expensive; - biomass exhibits an inherent variability, so it is difficult to perform a
correct sampling and be representative of the total biomass.
As a consequence, a technique that is rapid, economic and simple is necessary. A good candidate could be the infrared spectroscopy which is already widely used for quantitative and qualitative purposes in different fields, such as the agricultural, food, pharmaceutical and industrial sectors. The methodology is shortly described in the following chapter (§ Chapter 3). IR spectroscopy is a suitable technique to overcome the biomass sampling and the related problems with its representativeness. In fact, it could be applied directly in the production line providing continuous measurements and giving back the quality trend of the product and the possible critical points, in real time. Beside on-line/in-line measurements, infrared technique could be used also off-line or at-line. The former includes sampling and a sample transfer to the lab that will return results after the infrared analysis, reducing in this way time and cost compared to the conventional analysis, but losing real-time knowledge about the process. The at-line measurements also require a sampling, but the sample is analysed close to the process reducing the time delay of lab analysis. To take into account that even if these techniques are still based in sampling, the problem of the representativeness is overpassed since multiple samples can be analysed thanks to the low cost and the high speed of the infrared analysis.
In general it can be concluded that IR spectroscopy technique offers different benefits. First of all, contrary to the regular analysis, it is fast, can help to achieve cost-savings and does not require skilled operators, once the method
15
has been developed. And more importantly, it could be considered the first methodology able to provide rapid responses about biomass traceability (origin and source). All these features allow to overpass the limits of the current system of quality control.
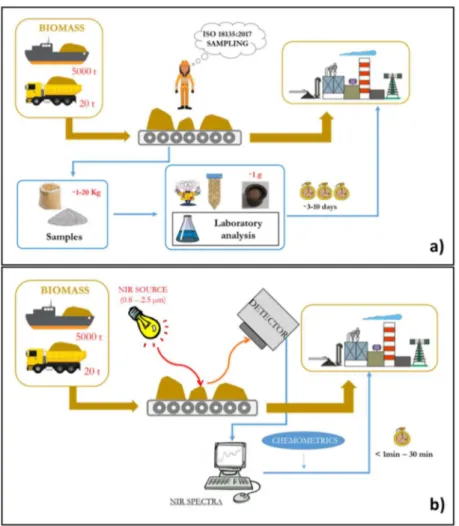
A schematic representation of the two different approaches in solid biofuels analysis is reported in Figure 2-3: the current system of biomass quality control based on conventional analysis and the infrared system.
Paper I, Paper II, Paper III, Paper V and Paper VI aim at collecting information about the origin and source of the biomass. Instead, Paper IV aims at predicting two quantitative characteristics of woodchip samples: gross calorific value and ash content. In particular, Paper VII focuses on the prediction of ash content and investigates if scattering effects the prediction of such parameter. A preliminary study was also carried out in order to predict the quantitative characteristics of the lignocellulosic material directly in the production line using an on-line spectrophotometer (§ Chapter 5.3). More precisely the parameters considered are moisture content on woodchip, ash content and gross calorific value on pellet samples.
Going into detail, the purpose of Paper I is the discrimination between softwood and hardwood samples. Once achieved this objective, Paper II aims at predicting hardwood and softwood contents in blend samples. Paper III and Paper V and VI investigate other issues related to the origin and source of the biomass: the discrimination between bark and wood samples and between treated and virgin wood, respectively.
Biomass quality
16
Figure 2-3: different approaches of solid biofuels control: the current system of quality control based on conventional analysis (a) and the infrared system (b).
17
3.
Infrared
spectroscopy
and chemometrics
3.1
Fundamentals of infrared spectroscopy
Spectroscopy is an analytical technique that studies the interaction between matter and different frequency components of the electromagnetic spectrum. Infrared spectroscopy is the spectroscopy that deals with the infrared region of the electromagnetic spectrum. In detail, the infrared region is typically divided into the NIR – near infrared (12,500-4,000 cm-1), the MIR – medium infrared (4,000-400 cm-1) and the FAR – far infrared region (400-100 cm-1) (Figure 3-1) (Pavia, Lampman et al. 2001). This thesis will focus on the NIR and MIR regions because of their utility and application in the sector.
In the NIR region absorption bands correspond mainly to overtones and combinations of the fundamental vibrations of molecules observed in the MIR region (Blanco and Villarroya 2002, Siesler 2007).
When infrared radiation strikes a sample, the molecules can absorb energy from the electromagnetic radiation and convert it into energy of molecular vibration. The vibrational energy refers to an oscillation of atoms through their molecular bonding. Chemical bonds of the molecule vibrate at different energy levels depending on the molecular structure, chemical composition or physical properties of the surface measured. There are two types of vibrational mode, consisting in an elongation of the chemical bonds (stretching) and/or in a deformation of the angle of the chemical bonds (bending).
The absorbance of light by the molecular vibrations is linked with a change in the polarity of the bonds (dipole moment). In fact, the transfer of energy occurs only if the electric dipole of the vibrating bond changes at the same frequency of the incoming radiation (Siesler 2007).
Infrared spectroscopy and chemometrics
18
Figure 3-1: the electromagnetic spectrum. Illustration adapted from (Department of Chemistry and Biochemistry 2002).
The key-point of the spectroscopic measurements lies in the association between the frequency of the radiant energy and the frequencies of molecular motions. Since only certain light frequencies or wavelengths can be absorbed by a specific molecular vibration, spectroscopy can be used to get qualitative information about the material analysed. Quantitative information could be also acquired using infrared spectroscopy based on the amount of light absorbed at each wavelength.
To better understand the vibration model, a chemical bond could be viewed as a spring with a given force constant (k) connecting two vibrating masses (m). According to Hook’s law, the wavenumber of the fundamental absorption band ( ), i.e. the frequency of vibration, is described as (Pasquini 2003, Siesler 2007, Jha 2016):
19 = 2 1
where k is the force constant of the chemical bond and is the reduced mass of the atoms involved in the bond, given by the following equation (Pasquini 2003, Siesler 2007, Jha 2016):
= +
in which m1 and m2 are the masses of the two bonded atoms.
In the harmonic oscillator, energy is continuous and the system undergoes cyclic conversion from potential energy to kinetic energy. In reality, the molecules do not follow the rules of the classical mechanics, instead those of quantum mechanics. That means that the transition between two energy states occurs with the absorption or emission of a ‘quantum’ of energy, i.e. a discrete packet of energy. Hence, the absorption or emission of energy by the system causes a transition between two energy levels – E1 and E2 – and the energy difference (∆ ) between two vibrational states is equal to ∆ = ℎ ∗ where h is the Planck’s constant and is the frequency (Pasquini 2003, Siesler 2007, Jha 2016). Since vibrational energies are quantized, the vibration frequencies are calculated as following (Pasquini 2003, Siesler 2007, Jha 2016):
∆ = ℎ +12
in which is the frequency, n is the vibrational level and h is the Planck’s constant (Figure 3-2) (Department of Chemistry and Biochemistry 2002). To summarize, the molecular vibration can be described by a harmonic oscillator, in which the energy levels (n) are equidistant and transitions are only allowed between neighbouring energy levels with ∆n = ±1.
Infrared spectroscopy and chemometrics
20
Figure 3-2: energy curve for a vibrating dipole molecule, classic mechanics (left) and energy constrained to quantum mechanics (right). Illustration adapted from (Department of Chemistry and Biochemistry 2002).
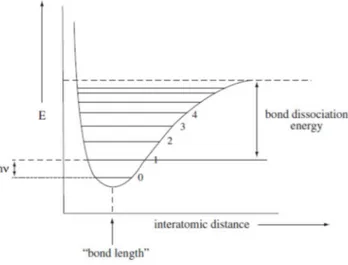
The quantum-mechanical treatment of a harmonic oscillator explains the infrared absorption bands caused by the fundamental vibration, but do not explain the overtone bands in the NIR region. The bonded atoms are compared to two masses linked by a spring, but in reality it is also necessary to consider the dissociation energy of the bonds. The distortion of the equilibrium of internuclear distance, caused by the strongly extension or compression beyond a certain point of the vibrating bond, leads to bond dissociation. Moreover, when two atoms approach, the repulsion between the two nuclei occurs and the potential energy increases more quickly than that estimated by the harmonic oscillator (Jha 2016). The harmonic oscillator becomes an anharmonic oscillator (Figure 3-3) (Department of Chemistry and Biochemistry 2002).
Figure 3-3: energy curve of an anharmonic oscillator. Illustration adapted from (Department of Chemistry and Biochemistry 2002).
21
In the case of NIR spectroscopy the position of an overtone is multiple of that of the fundamental vibration, as consequence n > 1. For this reason, the position of the overtones can be found as described in the formula:
= 1 − ℵ
in which is the wavenumber of the overtone corresponding to the vibrational quantum number (n), is the frequency of vibration and ℵ is the anharmonicity constant (Eskildsen 2016).
3.2
Spectrophotometers
Spectrophotometers are the instruments used to collect spectra, normally visualized in a graph of infrared light absorbance on the vertical axis and wavelength on the horizontal axis. The components of the instrumentation include a radiation source, a dispersing element (or wavelength selector), a detector and a data processing unit. The dispersing element is used to define the wavelength selection, the way in which light is spectrally modulated or selected. Different technologies are available, making it a crucial component in the choice of the infrared system (Blanco and Villarroya 2002, Xu, Yu et al. 2013). Mainly all the instruments are grouped into dispersive and interferometric.
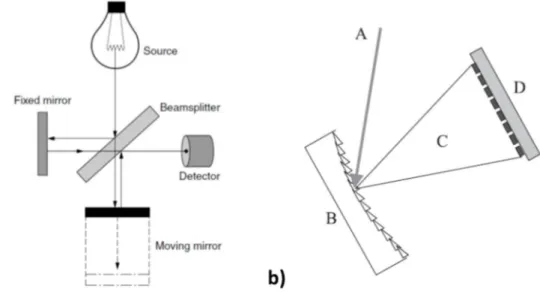
In Paper I and in Paper II, Nicolet iS 10 (Thermo Fisher Scientific Inc, USA) equipped with an attenuated total reflectance accessory (mod. Smart iTR, Thermo) was used for obtaining MIR measurements. In Paper III, in Paper IV and in Paper VII, Antaris II (Thermo Fisher Scientific Inc, USA) was used for obtaining NIR measurements. In Paper V and Paper VI, Nicolet iS 10 (Thermo Fisher Scientific Inc, USA) equipped with a diffuse reflectance accessory (mod. Smart Near-IR upDRIFT, Thermo) was used for obtaining NIR measurements. All the spectrophotometers are based on the use of the interferometer as wavelength selector system and on Fourier transform (FT) principle. The Michelson interferometer consists of two mutually perpendicular plane mirrors, one of which moves along its axis at a common velocity, and a beamsplitter (Figure 3-4 a) (McCarthy and Kemeny 2007). The energy of the source is collimated and directed into the beamsplitter, generating two equal beams. One beam is reflected towards the fixed mirror and the other beam toward the moving mirror. Light is reflected from the two mirrors back to the beamsplitter and part
Infrared spectroscopy and chemometrics
22
of the light passes into the sample and the detector records the signal. However, there is a difference in the optical path length of the two beams (retardation) because of the continuous change caused by the motion of the moving mirror. The result is an interferogram where the absorbance values are recorded in the time-domain since the signal is recorded by the detector for various values of the retardation. The application of Fourier transform principle allows the transformation of the interferogram into the familiar frequency-domain spectrum (normal spectrum) (Pavia, Lampman et al. 2001).
The interferometer is an efficient method to enable measurements of all infrared frequencies simultaneously, rather than individually. They include the best characteristics in terms of wavelength precision and accuracy, high signal-to-noise ratio and scan speed (Pavia, Lampman et al. 2001, Pasquini 2003), essential also for in-line applications.
A part from interferometric, the other common technology used to produce IR spectra is the dispersive optics-based instrument. These instruments are based on diffraction gratings and thanks to recent evolution in sensors production technology, they allow a higher scan speed than the past. That is because it is now possible to construct linear arrays of PbS and InGaAs sensors containing up to 256 independent elements. The procedure is simple: the incoming radiation is dispersed by a diffraction grating that separates the wavelengths of light and directs each wavelength individually through an array of detector elements (Figure 3-4 b). The pros of this technology is the high scan speed, in fact thanks to the detector array it is possible to scan an entire spectrum in a few milliseconds, and the absence of moving parts, allowing the installation for in-line applications (Pasquini 2003, Jha 2016).
In this thesis an on-line NIR spectrophotometer loaned by Büchi (NIR-Online; Büchi Labortechnik AG, Flawil, Switzerland), based on diode-array technology, was used for collecting NIR spectra in order to investigate the possibility to predict the biomass quality parameters directly in the production line (§ Chapter 5.3).
23
Figure 3-4: a) Michelson interferometer (McCarthy and Kemeny 2007); b) dispersive optic-based spectrophotometer. A, incoming radiation; B, concave grating; C, dispersed radiation, and D array of detectors (Pasquini 2003).
3.3
Chemometrics
Spectroscopy measurements are very easy and rapid to perform and allow you to get thousands of data points in few seconds, but the spectra obtained are quite difficult to interpret, even if they are very rich in inherent information. Especially the overtone and combination bands of the NIR region are weak, very broad and overlap heavily, leading to spectra really complex to interpret and with spectral differences between samples very minimal and difficult to find by naked eye (Blanco and Villarroya 2002, Lavine 2003, Hindle 2007).
The interpretation of the spectral information is possible using chemometric techniques. Chemometrics is the science of extracting information from chemical systems by using several mathematical and statistical methods based on multivariate data analysis (MVA).
First of all, one must consider the fact that the absorption signal is not only affected by the chemical properties of the sample, but also by the physical properties. In fact, a typical physical phenomenon during spectra acquisition consists in the deviation of light from a straight trajectory by one or more paths with no absorption. This is called scattering and it is viewed in infrared
Infrared spectroscopy and chemometrics
24
spectroscopy as offset and slope differences. When physical properties are not of interest, it is necessary to remove this baseline shift using pre-processing methods on the spectral data prior to data analysis. A description of the most important pre-processing methods is carried out by Rinnan et al. (Rinnan, Berg et al. 2009). Pre-processing techniques can be divided in two categories: scatter correction methods and spectral derivatives.
The first group includes Multiplicative Scatter Correction (MSC) and Standard Normal Variate (SNV). The MSC correction is achieved by regressing a measured spectrum against a reference spectrum and then correcting the measured spectrum using the correction coefficients (slope and intercept) of this reference spectrum. In most applications, the average spectrum of the calibration set is used as the reference spectrum. Practically, the MSC technique consists in:
x = x −
in which xcorr is the spectrum corrected with MSC, xorg is the measured spectrum, b is an additive correction factor (intercept) and a is a multiplicative correction factor (slope). a and b are found by the regression of xorg onto xref, where the latter is the reference spectrum.
SNV is a weighted normalization, i.e. not all points contribute to the normalization equally. In SNV correction, the average value of the spectrum is subtracted from the absorbance for every data point and the result is divided by the standard deviation. Hence, the entire sample is normalized by the standard deviation. Different vector-norms could be used for the scatter-correction computation, but surely standard deviation is the most applied.
SNV uses the same signal-correction concept as MSC, but a reference signal is not required, so each observation is computed on its own, isolated from the rest of the dataset. In any case, MSC and SNV are the same for most practical applications and the results are similar (Lavine 2003, Rinnan, Berg et al. 2009).
The basic idea behind MSC has been extended into more elaborate augmentations, one of the most common is the Extended Multiplicative Signal Correction (EMSC). This pre-processing method is used for eliminating uncontrollable path length or scattering effects and is particular useful in minimizing wavelength-dependent light scattering variation (Martens and Stark 1991).
25
This extension includes both second-order polynomial fitting to the reference spectrum (MSC normally uses the first-order polynomial fitting, i.e. the linear regression), fitting of a baseline on the wavelength axis, and the inclusion of a priori knowledge from the spectra of interest or spectral interferents (Rinnan, Berg et al. 2009). This last extension is not always possible since, in many practical cases, reference spectra for wanted or unwanted constituents are not available. Wavelength-axis dependency considers most often a second-order polynomial fitting on the wavelength axis to the spectra.
As a consequence, the basic equation of MSC can be expanded to include any other appropriate corrections, not only the intercept and slope already considered by MSC, but also the correction factors according to ith order of the reference and the ith order wavelength-axis dependency. It is thus clear that EMSC is nothing else that an expansion of the original form of MSC.
EMSC is particularly used because of its flexibility in performing a more selective correction for various types of scattering and other unwanted variations. Moreover, it is a reliable pre-treatment in the field of IR spectroscopy for the correction of additive baseline effects, multiplicative scaling effects, and interference effects (Afseth and Kohler 2012).
The spectral differentiation has the capability to remove both additive and slope effects in the spectra. The first derivative removes only the baseline; the second derivative removes both baseline and linear trend. During the differentiation, a smoothing of the spectra is performed in order to decrease the detrimental effect on the signal-to-noise ratio that conventional finite-difference derivatives would have (Rinnan, Berg et al. 2009). In this thesis, Savitzky-Golay polynomial derivative filter (Savitzky and Golay 1964) was used.
After performing the right pre-treatments, MVA methods are applied in order to extract the desired chemical information from absorbance, transmittance, or reflectance data. There are several MVA methods which have been extensively described in the literature and have been classified according to their purpose and the algorithms or computational procedures that they use.
The main categories of analysis techniques are:
- exploratory analysis: Principal Component Analysis (PCA) is the main widespread unsupervised approach. It simply “looks” at the data to
Infrared spectroscopy and chemometrics
26
explore the overall statistical variance with the goal of clustering the samples, according to the spectral differences, and detecting outliers; - classification and discrimination: allow to discriminate between groups and
classify samples in different class memberships. It can be applied when some prior information about the samples is available. Partial Least Square Discriminant Analysis (PLS-DA) and Soft Independent Modelling of Class Analogy (SIMCA) are two of the most used techniques in different fields;
- regression: allows the prediction of the characteristics and properties of unknown samples comparing blocks of data. The most used technique is Partial Least Square regression (PLS).
A brief description of the chemometric techniques included in this Ph.D. thesis is provided in the following sections.
3.3.1
Principal Component Analysis (PCA)
Spectral data are collected in a matrix (X) with size N x K, where N are rows (observations) and K are columns (spectral variables). In spectroscopy, it is normally to work with huge datasets, considering a number from several hundreds to thousands of variables. PCA, invented by Karl Pearson in 1901 (Pearson 1901) and developed and named by Harold Hotelling in 1933 (Hotelling 1933), is an exploratory analysis that allows the reduction of the dimensionality of the dataset (X) by transforming the original variables (K) into a set of new uncorrelated variables called principal components (PCs). Each of these new variables retains a part of the original variance (i.e. information) and they are ordered on the base of the amount of explained variance.
Basically, it uses orthogonal transformations to search for the direction of maximum variability and it projects the variable with the greatest variance, i.e. the first principal component (PC1), on the first axis. The variable with the next highest degree of variance in the dataset is the second principal component (PC2) and is set orthogonal to PC1. The third PC (PC3) is the best rank after the first two principal components and has the constrain to be orthogonal to the first two PCs. The procedure continues till all the systematic variation in the X matrix is explained. Normally, the relevant information for the system is gathered in a reduced number of variables making the data easier to explore and visualize.
27
The outcomes of the PCA decomposition are the scores matrix (T), the loading matrix (P) and the residuals matrix (E). The decomposition by PCA is described by the following equation:
= +
where T and P represent the structure part of spectral information and E the noise part.
The intrinsic information contained in the X-matrix can visually summarized by plotting the scores matrix. The resulting graph (scores plot) allows to visualize one principal component versus another one (e.g. PC1 versus PC2 or PC1 versus PC3). This is a very informative plot used for looking at similarities or dissimilarities among the samples and for the detection of clustering or outlier samples. Samples with similar characteristics have similar scores values and are close to each other, while samples that lie in the opposite part of the plot have very different characteristics and, accordingly, different scores values.
The loading matrix is represented by using a two dimensional-plot in which each loading vector (or at least the most relevant) is plotted against the wavelength number. This plot is used for interpretation purposes since it describes the way in which the original variables are linearly combined with the new variables (PCs). The loading plot explains why samples are grouped in a certain way in the scores plot and which variables are responsible for such separation.
A schematic representation of PCA structure is reported in Figure 3-5.
Figure 3-5: schematic representation of PCA model. T and P represent the scores and loading matrices, E is the residual matrix. X is the spectral matrix with the size N x K (samples x spectral variables). n is the number of Principal
Infrared spectroscopy and chemometrics
28
3.3.2
Partial Least Square regression (PLS)
Partial Least Square regression (PLS) is a multivariate technique applied in spectroscopy for quantitative analysis (Wold, Sjöström et al. 2001). It finds the relationship between a Y-value – the parameter to be quantified – and the spectral data matrix (X), maximizing the covariation between X and Y scores. In short, PLS finds components in such a way that the score values in X and in Y have maximum covariance. The model is then built only using the Y-related variance in X.
As for PCA, PLS finds a new smaller set of variables, called latent variables (LVs), that are linear combinations of the spectral data and relevant for the determination of the parameters of interest.
PLS decomposition could be written with the following equations:
= +
= +
where X is the spectral data matrix (matrix of predictors) and Y is the parameter to be quantified (vector of response), T and U are the X scores and the Y scores matrices, respectively, P and Q are the X and Y loading matrices, respectively, and E and F represent the residuals.
After building a PLS model (calibration phase), it must be validated in order to evaluate its prediction performance (validation phase). The validation computations can be made on a separate set of data (test set) or on the calibration data themselves simulating a prediction testing. The former procedure is called external validation and the latter cross-validation. It is based on deleting a sample or groups of samples (g), building a model with the remaining N – g samples, estimating the coefficients of the equation and predicting the deleted sample/s. In order to estimate the uncertainty of the model RMSE (Root Mean Square Error) is calculated. It is the square root of the average sum of squares of the differences between measured values and the model estimated values for the calibration samples. The validation phase allows the computation of RMSECV (Root Mean Square Error of Cross-Validation) if using cross-validation and RMSEP (Root Mean Square Error of Prediction) if using external validation. It is the most important error measure to estimate the performance of the regression model and is nothing else than the average error that it can be get during