Analysis of factors affecting the variability of a
quantitative suspension bead array assay
measuring IgG to multiple Plasmodium
antigens
Itziar Ubillos1, Ruth Aguilar1☯, Hector Sanz1☯, Alfons Jime´nez1,2, Marta Vidal1, Aida Valmaseda1, Yan Dong3, Deepak Gaur4,5, Chetan E. Chitnis4, Sheetij Dutta6, Evelina Angov6, John J. Aponte1, Joseph J. Campo1¤, Clarissa Valim7,8‡, Jaroslaw Harezlak3‡, Carlota Dobaño1
*
1 ISGlobal, Hospital Clı´nic—Universitat de Barcelona, Barcelona, Catalonia, Spain, 2 CIBER Epidemiology and Public Health (CIBERESP), Barcelona, Spain, 3 Department of Biostatistics, RM Fairbanks School of Public Health, Indianapolis, IN, United States of America, 4 Malaria Group, International Centre for Genetic Engineering and Biotechnology (ICGEB), New Delhi, India, 5 Laboratory of Malaria and Vaccine Research, School of Biotechnology, Jawaharlal Nehru University, New Delhi, India, 6 U.S. Military Malaria Vaccine Program, Walter Reed Army Institute of Research (WRAIR), Silver Spring, Maryland, United States of America, 7 Department of Osteopathic Medical Specialties, Michigan State University, East Lansing, MI, United States of America, 8 Department of Immunology and Infectious Diseases, Harvard T.H. Chen School of Public Health, Boston, MA, United States of America
☯These authors contributed equally to this work.
¤ Current address: Antigen Discovery Inc., Irvine, CA, United States of America ‡ These authors also contributed equally to this work.
Abstract
Reducing variability of quantitative suspension array assays is key for multi-center and large sero-epidemiological studies. To maximize precision and robustness of an in-house IgG multiplex assay, we analyzed the effect of several conditions on variability to find the best combination. The following assay conditions were studied through a fractional factorial design: antigen-bead coupling (stock vs. several), sample predilution (stock vs. daily), tem-perature of incubation of sample with antigen-bead (22˚C vs. 37˚C), plate washing (manual vs. automatic) and operator expertise (expert vs. apprentice). IgG levels against seven P.
falciparum antigens with heterogeneous immunogenicities were measured in test samples,
in a positive control and in blanks. We assessed the variability and MFI quantification range associated to each combination of conditions, and their interactions, and evaluated the mini-mum number of samples and blank replicates to achieve good replicability. Results showed that antigen immunogenicity and sample seroreactivity defined the optimal dilution to assess the effect of assay conditions on variability. We found that a unique antigen-bead coupling, samples prediluted daily, incubation at 22˚C, and automatic washing, had lower variability. However, variability increased when performing several couplings and incubating at 22˚C vs. 37˚C. In addition, no effect of temperature was seen with a unique coupling. The exper-tise of the operator had no effect on assay variability but reduced the MFI quantification range. Finally, differences between sample replicates were minimal, and two blanks were
a1111111111 a1111111111 a1111111111 a1111111111 a1111111111 OPEN ACCESS
Citation: Ubillos I, Aguilar R, Sanz H, Jime´nez A, Vidal M, Valmaseda A, et al. (2018) Analysis of factors affecting the variability of a quantitative suspension bead array assay measuring IgG to multiple Plasmodium antigens. PLoS ONE 13(7): e0199278.https://doi.org/10.1371/journal. pone.0199278
Editor: Takafumi Tsuboi, Ehime Daigaku, JAPAN Received: March 23, 2018
Accepted: May 28, 2018 Published: July 2, 2018
Copyright: This is an open access article, free of all copyright, and may be freely reproduced, distributed, transmitted, modified, built upon, or otherwise used by anyone for any lawful purpose. The work is made available under theCreative Commons CC0public domain dedication. Data Availability Statement: All relevant data are within the paper and its Supporting Information files.
Funding: This work received support from the Instituto de Salud Carlos III,http://www.eng.isciii. es/(PI11/00423, PI14/01422) (CD); National Institute of Health-National Institute of Allergy and Infectious Diseases,https://www.niaid.nih.gov/ (NIH-NIAID R01AI095789) (CD); PATH Malaria Vaccine Initiative,http://www.malariavaccine.org/ (CD); the Agency for Management of University
sufficient to capture assay variability, as suggested by the constant Intraclass Correlation Coefficient of three and two blanks. To conclude, a single coupling was the variable that most consistently reduced assay variability, being clearly advisable. In addition, we suggest having more sample dilutions instead of replicates to increase the likelihood of sample MFIs falling in the linear part of the antigen-specific curve, thus increasing precision.
Introduction
The identification of antibody biomarkers of antigen immunogenicity and protection against certain infectious diseases is particularly challenging when dealing with complex microbial pathogens likePlasmodium falciparum, with a proteome of over 5,000 proteins (www.
plasmodb.org) and some polymorphic proteins [1]. In this context, sero-epidemiological stud-ies and vaccine trials need to evaluate different immune responses with medium to high throughput standardized and robust assays. The enzyme-linked immuno-sorbent assay (ELISA) has been a widely used tool to evaluate biomarkers in life sciences research, clinical diagnostics, biosurveillance, and food safety. However, ELISA requires a relatively large amount of sample, and the surface area of the wells and potential hydrophobic binding of anti-bodies can lead to non-specific bindings [2]. More importantly, ELISA can only measure one analyte at a time. Also, other antigen-antibody interaction measurement techniques, such as AlphaScreen1 (Perkin Elmer, Waltham, MA), have been recently developed [3–6]. However, there are limitations regarding the protein purity and size, as well as the buffer composition (terbium or europium chelates), which may affect the signal quality and add significant costs to the assay [7]. Protein microarrays can analyze thousands of analytes but at considerable cost, and the protein conformation, noise or measurement error may be difficult to calibrate [8]. Microsphere quantitative suspension array technology (qSAT), also known as Luminex or multiplex bead suspension array technology, represents an excellent alternative to ELISA and protein arrays, with high sensitivity and specificity [9]. qSAT is a flow cytometric assay that allows to test simultaneously up to 500 different analytes in a single reaction, reducing sample volume, labor, cost and enabling higher throughput [10]. qSAT bead-based assays use fluores-cently encoded microspheres for capturing and detecting target molecules [9]. This platform is FDA-approved for diagnostics, has a high sensitivity, is versatile, and is amenable to screening large numbers of specimens [11,12].
A challenge of any immunoassay is its precision and robustness [13]. Notable sources of deviation may be run-to-run variability caused by differences in the test conditions and opera-tor’s expertise. However, factors affecting assay performance have not been thoroughly and systematically evaluated. Classically, the assessment of the impact of variables in assay perfor-mance has been done in a series of one-factor-at-a-time experiments [14]. This sort of strategy is not capable of finding interactions between assay parameters that may affect both assay robustness and precision [15]. A more efficient approach to assay optimization is to utilize experimental designs to investigate the effects of several factors at once [16]. Fractional facto-rial designs of experiments are especially efficient during assay development because they can identify factors affecting assay performance and their interactions with a limited number of experiments [15].
In this study, we aimed to optimize assay parameters to maximize precision and robustness of an IgG qSAT assay developedin-house [17] against a multiplex panel ofP. falciparum anti-gens. We analyzed variability considering the following assay factors, with two conditions
and Research Grants,http://agaur.gencat.cat/en/ lagaur/index.html(AGAUR 2014SGR991) (CD). ISGlobal is a member of the CERCA Programme, Generalitat de Catalunya,http://cerca.cat/en/. JC receives support in the form of salary from Antigen Discovery Inc.; however, he was not affiliated with Antigen Discovery Inc. at the time of the study. The funders had no role in study design, data collection and analysis, decision to publish, or preparation of the manuscript.
Competing interests: JJC receives support in the form of salary from Antigen Discovery Inc.; however, he was not affiliated with Antigen Discovery Inc. at the time of the study. This does not alter our adherence to PLOS ONE policies on sharing data and materials.
each: coupling of the antigens to beads, sample predilution, temperature of incubation of sam-ples with antigen-bead coupled, plate washing and operator expertise. We performed a frac-tional factorial design with the different assay conditions and measured IgG levels against seven antigens of different immunogenicities. We assessed the variability measured as median absolute deviation (MAD) for a combination of factors for each antigen and sample type. We also assessed the effect of combination of conditions on the MFI quantification range, and the potential interaction between conditions. We finally evaluated the minimum number of repli-cates for test samples, positive control and blanks to achieve good replicability.
Materials and methods
Study design
We assessed the effect of five qSAT assay conditions on assay variability. Assay conditions tested were selected based on our previous experience in the laboratory: beads coupled to anti-gens, performed once and stocked for the whole study (stock) vs. three different coupling sets performed during the study (several); sample predilution, frozen stock prepared at the begin-ning of the study (stock) vs. freshly prepared every assay day (daily); temperature of incubation of samples with antigen-bead, at 37˚C vs. at 22˚C; plate washing, automatic vs. manual; and operator expertise, expert vs. apprentice. Experiments were set up following a fractional facto-rial design including four factors (beads coupling, sample predilution, temperature of incuba-tion and washing) with two condiincuba-tions each. We performed a total of 64 assays (plates) (S1 Table). The operator expertise (expert vs. apprentice) was later included in the analysis. The experiments were conducted over three months.
Samples and controls
We selected nine individual plasma samples of malaria-exposed donors from the ISGlobal repository based on data from previous field studies performed in the Manhic¸a District, South-ern Mozambique [18]. Eight samples were from semi-immune adults with life-long exposure to malaria [19], and one sample from a child with clinical malaria [20]. We prepared a positive control with pooled plasma from 12 hyper-immune adults from Manhic¸a who participated in a clinical trial of intermittent preventive treatment conducted between 2003–2005 [21]. The immunological analysis of the samples was covered under human subject protocols approved by the National Mozambican Ethics Committee (117/CNBS/05, 85/CNBS/05 and 99/CNBS/ 05) and the Hospital Clı´nic of Barcelona Ethics Committee (CEIC 2008/4097). Written informed consent was obtained from all participants or their parents/guardians before collec-tion of plasma samples used in research. All data were fully anonymized before we accessed them. To assess the MFI quantification range of the assay, we used an additional positive con-trol consisting on a WHO reference standard prepared with pooled plasma from hyper-immune Kenyan adults [22]. Twenty-serial dilutions of the WHO reference standard against the study antigen panel were fitted in a non-linear regression model [23].
Plate design
S1 Figshows an example of plate design. Each assay plate included nine test samples assayed in 4 serial dilutions (1/100; 1/500; 1/20,000; 1/500,000), to ensure that at least one dilution would lay in the linear part of the antigen-specific titration curve. To assess the need of replicates, we duplicated samples in alternated dilutions (S1 Fig). We assayed the positive control in 8 serial dilutions (2.5 fold) starting at 1/50 and replicated it in alternated dilutions. Finally, 3 multiplex
blanks (beads with the antigenic panel) were also included to measure the non-specific back-ground reactivity.
Recombinant proteins
We selected a panel of sevenP. falciparum antigens with heterogeneous immunogenicities to ensure we accounted for variability in a wide range of antibody responses: the fragment 2 of region II of the 175 kDa erythrocyte binding protein (EBA-175 or PfF2) [24] and reticulocyte binding-like homologue protein 5 (Rh5) [25,26] expressed inEscherichia coli at ICGEB; the apical membrane antigen 1 (AMA-1) [27,28] and the merozoite surface protein 1 (MSP-142), both from the FVO strain [27,29] and expressed inE. coli at WRAIR; the liver-stage antigen 1 (LSA-1) [30,31] and the sporozoite surface protein 2 (SSP2 or TRAP) [32,33] expressed in Pichia Pastoris, purchased from Protein Potential, LLC (Rockville, Maryland, USA); and a pep-tide with 48 aminoacids from the VAR2CSA inter domain 1 region, synthesized by GL Bio-chem (Shangai, China) [34]. Based on the readout of the positive control immunogenicities were considered high for AMA-1 and MSP-142, medium for EBA-175 and Rh5 and low for LSA-1 and SSP2 [35,36].
Microsphere covalent coupling
The assays were performed using the Luminex xMAP™ technology and a Luminex xMAP1 100/200 analyzer (Luminex Corp., Austin, Texas), which can analyze up to 80 MagPlex1 microsperes. We calculated the amount of beads to be coupled to each antigen assuming the use of 1,000 beads/well/antigen for test samples, positive control and blanks. We washed Mag-Plex1 6.5μm COOH-microspheres twice with 250μL of distilled water using a magnetic sepa-rator, and re-suspended them to a final concentration of 10,000 beads/μL by short vortexing and sonication for 20 sec. Microspheres were re-suspended in 80μL bead activation buffer (100 mM Monobasic Sodium Phosphate, pH 6.2, Sigma, Tres Cantos, Spain) by vortexing and sonication for 20 sec, and activated using 10μL of 50 mg/mL Sulfo-NHS (N-hydroxysulfosucci-nimide) and 10μL of 50 mg/mL EDC (1-Ethyl-3-[3-dimethylaminopropyl] carbodiimide hydrochloride) (Thermo-fisher Scientific Inc., MA, USA) simultaneously added to the reaction tubes. We mixed reaction tubes by vortex and incubated for 20 min, at room temperature (RT), in a rotary shaker and protected from light. We washed microspheres twice with 250μL 50 mM MES (morpholineethane sulfonic acid) (Sigma, Tres Cantos, Spain) pH 5.0 for AMA-1, MSP-142, Rh5 and VAR2CSA, or phosphate buffered saline (PBS) pH 7.4 for EBA-175, LSA-1 and SSP2, and resuspended to a LSA-10,000 beads/μL concentration by vortexing and sonication for 20 sec. A prior selection of the optimal buffer and protein concentration for the coupling of each antigen was performed testing both buffers and serial concentrations of the proteins (10, 30, 50, 100μg/mL) and assaying the coupled beads against a hyperimmune plasma. Conditions giving coupling saturation were selected (data not shown). Finally, to coat the beads with anti-gens, we added the appropriate concentration of the corresponding protein (10μg/mL SSP2; 20μg/mL AMA-1, MSP-142, EBA-175 and LSA-1; 30μg/mL Rh5; and 1,760 μg/mL
VAR2CSA) to each reaction tube in 500μL MES pH 5.0 or PBS pH 7.4 (10,000 beads/μL), depending on the antigen. Reaction tubes were left at 4˚C on a rotatory shaker overnight and protected from light. Next day, microspheres were blocked with 250μL PBS-BN (PBS with 1% Bovine serum albumin [BSA] [Santa Cruz] and 0.05% sodium azide [Sigma, Tres Cantos, Spain]) in agitation during 30 min at RT and protected from light. We centrifuged and washed the beads twice with 250μL of PBS-BN and resuspended in 500μL of PBS-BN to be quantified on a Guava PCA desktop cytometer (Guava, Hayward, CA, USA). To create our multiplex antigen panel, we combined equal amounts of each coupled-bead-protein in tubes at 2,500
beads/μL, and aliquoted and stored them at 4˚C protected from light. Antigen-coupled beads were stored during the study period, being stable for at least three months.
qSAT assay procedure
All samples were prediluted at double concentration of the final assay dilution with PBS-BN. Stock prediluted samples were stored at -80˚C for a maximum of 3 months and freshly predi-luted samples were prepared each day by thawing the corresponding sample and diluting it with PBS-BN. We added antigen-coupled beads to a 96-wellμClear1 flat bottom plate (Grei-ner Bio-One) in multiplex (1,000 microspheres/analyte/well) and resuspended them in a vol-ume of 50μL of PBS-BN. Next, we added 50 μL of test samples and positive control serial dilutions to multiplex wells. We filled blank wells with PBS-BN. Plates were incubated for 1 h at 22˚C or 37˚C (depending on the study group the plate had been assigned to) in a rotatory shaker at 600 rpm and protected from light. After incubation, we washed plates three times with 200μL/well of wash buffer (PBS-Tween 20 0.05%, Sigma, Tres Cantos, Spain) with 1 min lapse in between, using a magnetic washer, manual (Millipore, ref. 40–285) or automatic (Bio-Plex Pro II Wash Station, BioRad) set up with the same procedure as manual washing, depend-ing on the group the plate had been assigned to. Afterwards, we added 100μL of biotinylated anti-human IgG (Sigma, Tres Cantos, Spain) diluted 1:2,500 in PBS-BN to all wells, and incu-bated 45 min, at RT, in agitation at 600 rpm and protected from light. The plate was washed three times as before, and 100μL of streptavidin-R-phycoerythrin (Sigma, Tres Cantos, Spain) diluted 1:1,000 in PBS-BN were added to all wells and incubated 25 min, at RT, 600 rpm and protected from light. We washed plates three times and wells were resuspended in 100μL/well of PBS-BN. Plates were then covered protected from light and stored at 4˚C overnight to be read the next day using the Luminex xMAP1 100/200 analyzer, and at least 50 microspheres per analyte were acquired per sample.
Antigen-specific serial dilution curves were prepared in a separate experiment using the WHO reference standard [22], and were fitted using a non-linear 4-parameter log-logistic (4-PL) function with data points log10transformed via [23]:
f x; b; c; d; eð Þ ¼c þ d c 1 þ 10bðx eÞ;
where “b” is the slope at the inflection point, “c” is the lower asymptote, “d” is the upper asymptote and “e” is the concentration at the inflection point.
Finally, data files including crude median fluorescent intensity (MFI) and bead counts for each analyte and well were exported.
Statistical analysis
The distributions of MFIs of test samples, positive control dilutions and blanks were compared through t-test. We conducted exploratory graphical analysis using spaghetti plots of the log10MFI against dilution series for the antigen-specific positive control curves. These plots were stratified by each one of the 2x2 conditions combinations.
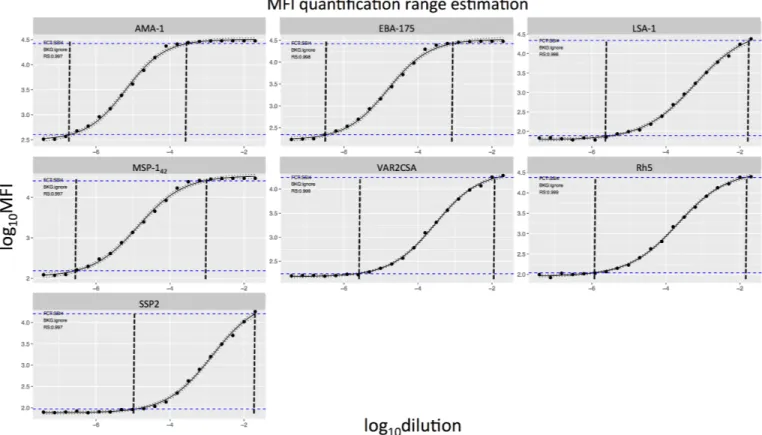
The assessment of the MFI quantification range was performed using the curves generated with 20 serial dilutions of the WHO reference standard, and was based on the coefficient of variation method for estimating the limits of quantification using a cutoff of 20% [37,38].
To assess the variability associated with each factor and combination of factors, we calcu-lated the MAD for each dilution point and antigen, for test samples, positive control and blanks. To assess factors that could impact assay variability, we fitted linear regression models for each combination of conditions to measure variability as log10MAD of log10MFI or MFI
quantification range with each of the factors of interest as predictor, separately and jointly, and interaction terms were also assessed. Replicates for each type of sample and antigen were assessed using the Intraclass Correlation Coefficient (ICC) [39] and Bland-Altman graphs [40]. P-values were considered significant if < 0.05 and p-values between 0.05 and 0.10 “mar-ginally” significant. When appropriate, p-values were corrected for multiple testing (desig-nated here as p-adjusted [p-adj]) by Benjamini & Hochberg method [41]. All the analyses were performed in R software version 3.2.2.
Results
Impact of assay conditions on variability depends on antigen
immunogenicity and sample concentration
Differences in the distribution of overall MFIs between assay conditions and operator experi-ence, taking all antigen data and serial dilutions together, were analyzed for positive control, test samples, and blanks (Fig 1). The MFI distribution of test samples changed significantly depending on the antigen-bead coupling (p-adj = 0.01), sample predilution (p-adj < 0.001), temperature of incubation of samples with antigen-bead (p-adj < 0.001) and plate washing (p-adj < 0.001). The distribution of blank MFIs varied depending on the operator expertise, having higher background signal when the operator was an apprentice (p-adj = 0.035). No dif-ferences between assay conditions were found for the positive control. The assay MFI quantifi-cation range was different depending on the antigen, as shown by the antigen-specific curves prepared in another set of experiments with serial dilutions of the WHO reference standard
Fig 1. Boxplots of log10MFI distribution comparing pairwise assay conditions. Conditions compared were: antigen-bead coupling, prepared once for the whole study (stock) vs. three times along the study (several); sample predilution prepared once for the whole study (stock) vs. daily performed (daily); temperature of sample-beads incubation (22˚C vs. 37˚C); plate washing (Automatic vs. Manual) and operator expertise (Expert vs. Apprentice). All antigens and sample serial dilutions were included in the analysis. P-values were estimated through t-test and adjusted for multiple testing by Benjamini & Hochberg. Only significant p-values are shown.
(Fig 2). Therefore, we analyzed the data taking into consideration each antigen MFI quantifica-tion range.
Positive control serial dilution curves showed different MFI variability across dilutions and antigens. A single coupling of antigens to the beads (stock), incubation at 37˚C, automatic washing and assay performed by an expert operator resulted in reduced MFI dispersion at more concentrated sample dilution in low immunogenic antigens, such as VAR2CSA and LSA-1, and at less concentrated sample dilution in high immunogenic antigens, such as MSP-142or AMA-1 (Fig 3andS2 Fig).
Evaluation of assay variability associated to combined assay conditions
To quantify and compare the variability associated with each assay condition, we calculated the MAD of log10MFI for the positive control serial dilutions and test samples against each antigen and at each dilution point. Variability associated to single assay conditions varied across antigens and dilutions (S3 Fig). In addition, results on single assay conditions could be affected by other conditions, thus this analysis did not allow us to conclude which conditions reduced variability. On the other hand, the fractional factorial design allowed us to assess the optimal combination of conditions with the minimum assay variability. By merging all combi-nations of conditions (coupling, predilution, temperature and washing) we obtained 16 possi-ble combinations (Fig 4). Highly immunogenic antigens such as MSP-142showed higher variability, measured as MAD levels, at more diluted concentrations of the positive control (Fig 4A) or test samples (Fig 4B). Inversely, low immunogenic antigens such as VAR2CSA had more variability at higher concentrations of the positive control or test samples (Fig 4). Overall,Fig 2. WHO reference standard curves against each of the antigens in the multiplex panel. Horizontal blue dashed lines represent the MFI quantification range (where the coefficient of variation is below 20%). The vertical black dashed lines encompass more reliable values of the assay output.
the highest assay variability for each antigen lied on the linear part of its antigen-specific posi-tive control titration curve, which was marked by the curve MFI quantification range (Fig 2). Therefore, antigens with different immunogenicities had dilution-dependent variability at the analyzed conditions.
To evaluate the impact of each combination of conditions per antigen, we estimated the mean MAD of all positive control serial dilutions and ranked them (Fig 5A). Five out of the 7 antigens showed that the combination of assay conditions that resulted in less variability was stock coupling with daily sample predilution and automatic washing (DSA) (Fig 5A). However, the combination resulting in largest assay variability varied by antigen. Nevertheless, when per-forming the analysis for all antigens together, doing several couplings, daily samples predilution, sample-beads incubation at 22˚C and automatic washing (22DCA), showed the highest variabil-ity (Fig 5B); but, a unique coupling, daily samples predilution, samples-beads incubation at 22˚C and automatic washing (22DSA) showed the lowest variability. All together, the combina-tions of assay condicombina-tions giving the highest and lowest variability differed only by the bead cou-pling (unique vs. several), suggesting that this factor is an important source of variability.
Impact of assay conditions and paired combinations on assay variability
We next assessed the impact of assay conditions and their combination in pairs on assay vari-ability, measured as log10MAD of log10MFI, by linear regression models with single or com-bined conditions as predictors. Separate regression models were built for the positive control, test samples and blanks. The results in Tables1and2illustrate the effect of single assayFig 3. Antigen-specific log10MFI levels of positive control serial dilutions by assay conditions. Spaghetti plots represent examples of positive control serial dilution MFIs against different antigens and in different assay conditions: Antigen-bead coupling (stock vs. several) for LSA-1; Sample predilution (stock vs. daily) for VAR2CSA; Temperature of sample-beads incubation (22˚C vs. 37˚C) for EBA-175 and Rh5; Plate washing (automatic vs. manual) for SSP2 and operator expertise (apprentice vs. expert) for MSP-142. Grey lines correspond to data from each plate.
Fig 4. MAD of log10MFI against MSP-142, EBA-175 and VAR2CSA, in the 16 combinations of assay conditions. A) Positive control in 8 serial dilutions (2.5-fold starting at 1/50), where each line in the graphs represents one of the 16 combinations of the 4 assay conditions; B) Top: Test samples in 4 dilutions (1/100, 1/500, 1/ 20,000, 1/500,000) for each of the 16 combinations of conditions, where each line in the graphs represents one of the 9 subjects analyzed; bottom: 16 combinations of the 4 assay conditions for all test samples analyzed together, where each line in the graphs represents one of the combinations. The 16 combinations of the 4 assay conditions are designated by the numbers and letters corresponding to: temperature of incubation (37 = 37˚C and 22 = 22˚C), sample predilution (D = daily and S = stock), beads coupling (S = stock and C = three times along the study), and plates washing (A = automatic and M = manual).
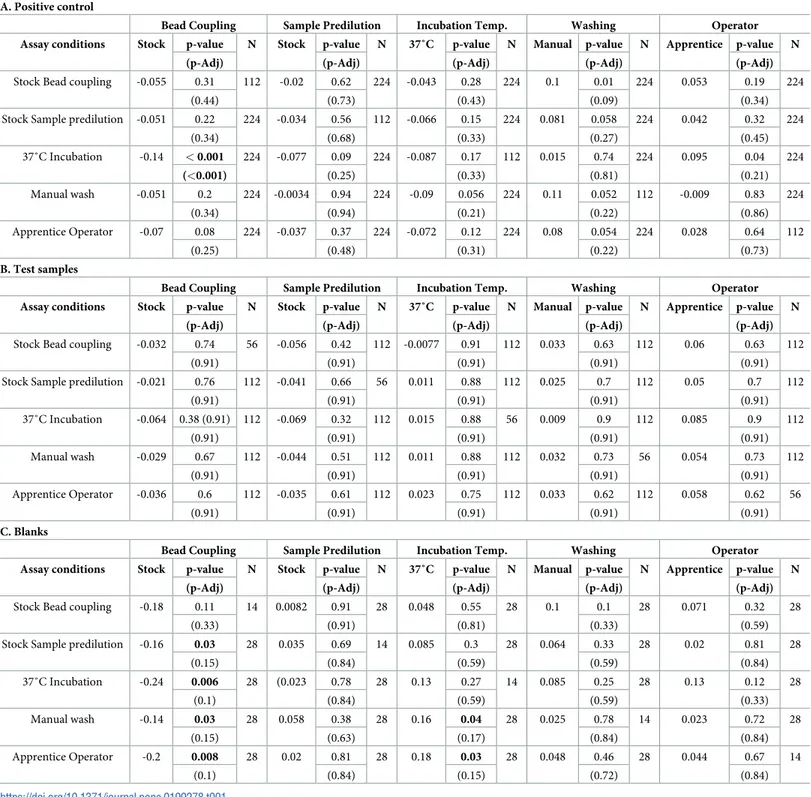
conditions and pair combinations of assay conditions on assay variability, measured as log 10-MAD of log10MFI. Tables show the regression coefficients, p-values and interaction p-values. For instance, inTable 1we are analyzing the effect of bead coupling on assay variability when using the positive control. In this model we are including 112 measurements that come from the 2 conditions of coupling [bead (stock) vs. three times along the study (several)] x 8 serial dilutions of the positive control x 7 antigens in the panel. Then, we have analyzed the effect of sample predilution on bead coupling and its combined effect on assay variability. In this model we are including 224 measurements that come from the 2 conditions of coupling [bead (stock) vs. three times along the study (several)] x 8 serial dilutions x 7 antigens x 2 condition of sample predilution [once (stock) vs. daily (daily)].
For the positive control, we found that the combination of bead couplings performed once at the beginning of the study (stock) and incubation of samples with antigen-bead at 37˚C, reduced assay variability (p<0.001) (Table 1). For the test samples we did not find any effect of single or combined conditions on assay variability (Table 1). For the blanks, we observed a weak reduction on variability if stock coupling was combined with stock predilution (p = 0.03), or blank-bead incubation at 37˚C (p = 0.006), or manual washing (p = 0.03) or apprentice operator (p = 0.008), or if incubating at 37˚C was combined with an apprentice operator (P = 0.03), or manual wash (p = 0.04). However the effect on variability of all these combinations was lost after adjusting for multiple comparisons (Table 1).
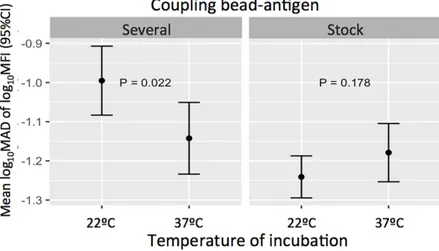
We also analyzed whether a condition could modify the variability associated with another condition. When working with the positive control, the effect of temperature of incubation on assay variability was statistically significantly different across coupling categories (p-Interaction= 0.008). Specifically, when the coupling was performed at different times during the study and the incubation was performed at 22˚C, the variability (log10MAD of log10MFI) was higher compared to incubating at 37˚C (Fig 6). Nevertheless, when using a unique coupling, the vari-ability was not different between temperatures of incubation (Fig 6).
Impact of assay conditions and paired combinations on the MFI
quantification range
We tested the impact of assay conditions and their combination in pairs on the assay MFI quantification range by linear regression models with single or combined conditions and their interactions as predictors. This analysis was done for the positive control. We found that beads coupling, sample predilution, temperature of incubation, and washing, did not affect the MFI range (Table 2). However, if an apprentice operator performed the assay, the MFI range was significantly reduced (p = 0.05), and this reduction was maintained no matter the other assay conditions. The effect of washing on the MFI quantification range was statistically significantly different across operator categories (p-Interaction= 0.04). Specifically, when the washing was manual and an apprentice performed the assay, the MFI range was reduced compared to assay performed by an expert operator.
Assessment of the minimum number of replicates required
To optimize the plate design, we assessed the advantage of using three instead of two blank controls. We also assessed whether testing duplicates of samples and positive control serial
Fig 5. Ranked log10MAD of log10MFI for the 16 combinations of the four assay conditions in the positive control. The x-axis shows the mean log10MAD of
log10MFI and 95% confidence intervals. A) By antigen and B) Combining all antigens. The y-axis shows combinations of the following conditions, ordered by the
value of the mean log10MAD: temperature of sample-bead incubation (37 = 37˚C and 22 = 22˚C), sample predilution (D = daily and S = stock), beads coupling
(S = single and C = three or more combined), and plate washing (A = automatic and M = manual). https://doi.org/10.1371/journal.pone.0199278.g005
Table 1. Linear regression models assessing the impact of combination of assay conditions on assay variability (log10MAD of log10MFI). Regression coefficients and p-values for one and two factors, all dilutions and antigens included. Bead coupling performed once at the beginning of the study (stock) or three times along the study (several); Sample predilution prepared at once (stock) or daily (daily); Sample-bead incubation temperature at 22˚C or 37˚C; Plate washing in an automated washer (auto-matic) or manually (manual); and Operator expertise, apprentice or expert. A) Positive control, 2 conditions, 8 dilutions and 7 antigens (N = 112); B) Subject samples, 2 conditions, 4 dilutions and 7 antigens (N = 56) and C) Multiplex blanks, 2 conditions and 7 antigen (N = 14). P-values adjusted for multiple testing by Benjamini & Hoch-berg (p-Adj). Significant p-values are shown in bold.
A. Positive control
Bead Coupling Sample Predilution Incubation Temp. Washing Operator Assay conditions Stock p-value N Stock p-value N 37˚C p-value N Manual p-value N Apprentice p-value N
(p-Adj) (p-Adj) (p-Adj) (p-Adj) (p-Adj)
Stock Bead coupling -0.055 0.31 112 -0.02 0.62 224 -0.043 0.28 224 0.1 0.01 224 0.053 0.19 224
(0.44) (0.73) (0.43) (0.09) (0.34)
Stock Sample predilution -0.051 0.22 224 -0.034 0.56 112 -0.066 0.15 224 0.081 0.058 224 0.042 0.32 224
(0.34) (0.68) (0.33) (0.27) (0.45) 37˚C Incubation -0.14 < 0.001 224 -0.077 0.09 224 -0.087 0.17 112 0.015 0.74 224 0.095 0.04 224 (<0.001) (0.25) (0.33) (0.81) (0.21) Manual wash -0.051 0.2 224 -0.0034 0.94 224 -0.09 0.056 224 0.11 0.052 112 -0.009 0.83 224 (0.34) (0.94) (0.21) (0.22) (0.86) Apprentice Operator -0.07 0.08 224 -0.037 0.37 224 -0.072 0.12 224 0.08 0.054 224 0.028 0.64 112 (0.25) (0.48) (0.31) (0.22) (0.73) B. Test samples
Bead Coupling Sample Predilution Incubation Temp. Washing Operator Assay conditions Stock p-value N Stock p-value N 37˚C p-value N Manual p-value N Apprentice p-value N
(p-Adj) (p-Adj) (p-Adj) (p-Adj) (p-Adj)
Stock Bead coupling -0.032 0.74 56 -0.056 0.42 112 -0.0077 0.91 112 0.033 0.63 112 0.06 0.63 112
(0.91) (0.91) (0.91) (0.91) (0.91)
Stock Sample predilution -0.021 0.76 112 -0.041 0.66 56 0.011 0.88 112 0.025 0.7 112 0.05 0.7 112
(0.91) (0.91) (0.91) (0.91) (0.91) 37˚C Incubation -0.064 0.38 (0.91) 112 -0.069 0.32 112 0.015 0.88 56 0.009 0.9 112 0.085 0.9 112 (0.91) (0.91) (0.91) (0.91) (0.91) Manual wash -0.029 0.67 112 -0.044 0.51 112 0.011 0.88 112 0.032 0.73 56 0.054 0.73 112 (0.91) (0.91) (0.91) (0.91) (0.91) Apprentice Operator -0.036 0.6 112 -0.035 0.61 112 0.023 0.75 112 0.033 0.62 112 0.058 0.62 56 (0.91) (0.91) (0.91) (0.91) (0.91) C. Blanks
Bead Coupling Sample Predilution Incubation Temp. Washing Operator Assay conditions Stock p-value N Stock p-value N 37˚C p-value N Manual p-value N Apprentice p-value N
(p-Adj) (p-Adj) (p-Adj) (p-Adj) (p-Adj)
Stock Bead coupling -0.18 0.11 14 0.0082 0.91 28 0.048 0.55 28 0.1 0.1 28 0.071 0.32 28
(0.33) (0.91) (0.81) (0.33) (0.59)
Stock Sample predilution -0.16 0.03 28 0.035 0.69 14 0.085 0.3 28 0.064 0.33 28 0.02 0.81 28
(0.15) (0.84) (0.59) (0.59) (0.84) 37˚C Incubation -0.24 0.006 28 (0.023 0.78 28 0.13 0.27 14 0.085 0.25 28 0.13 0.12 28 (0.1) (0.84) (0.59) (0.59) (0.33) Manual wash -0.14 0.03 28 0.058 0.38 28 0.16 0.04 28 0.025 0.78 14 0.023 0.72 28 (0.15) (0.63) (0.17) (0.84) (0.84) Apprentice Operator -0.2 0.008 28 0.02 0.81 28 0.18 0.03 28 0.048 0.46 28 0.044 0.67 14 (0.1) (0.84) (0.15) (0.72) (0.84) https://doi.org/10.1371/journal.pone.0199278.t001
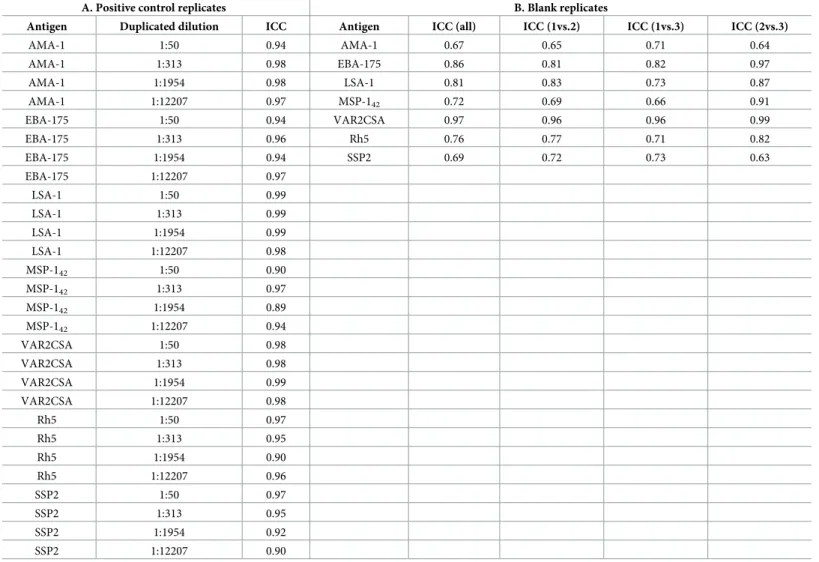
dilutions added information to the assay. Positive controls were assayed in 8 serial dilutions and samples in 4 serial dilutions with replicates in alternated positions (S1 Fig). The ICCs between replicates of a given dilution of the positive control ranged from 0.89 to 0.99
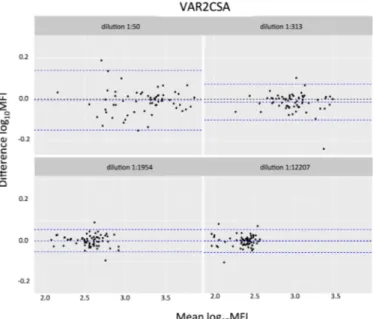
(Table 3), which is considered very good reliability [39]. To further investigate the need of rep-licates in the positive control serial dilutions, we performed Bland-Altman plots for each anti-gen (Fig 7AandS4 Fig). Considering all antigens together, 95% confidence intervals of the differences were between 0.2 and -0.2. We performed a replicate MFI ratio analysis for test samples. Results showed a minimal difference but of varying distribution along sample dilu-tions depending on antigen immunogenicity (Fig 7B), being higher on the more diluted sam-ples for high immunogenic antigens (AMA-1 and MSP-142) and lower on the more
concentrated samples for low immunogenic antigens (VAR2CSA). This minimal difference
Table 2. Linear regression models assessing the impact of combination of assay conditions on the MFI quantification range. Regression coefficients and p-values for one and two factors, all dilutions and antigens included. Bead coupling performed once at the beginning (stock) or three times along the study (several); Sample predilu-tion, prepared at once (stock) or daily (daily); Sample-bead incubation temperature at 22˚C or 37˚C; Plate washing in an automated washer (automatic) or manually (man-ual); and Operator expertise, Apprentice or Expert. Regression models for positive control, 2 conditions, 8 dilutions and 7 antigens (N = 112). P-values adjusted for multiple testing by Benjamini & Hochberg (p-Adj). Significant p-values are shown in bold.
Bead Coupling Sample Predilution Incubation Temp. Washing Operator Assay conditions Stock p-value N Stock p-value N 37˚C p-value N Manual p-value N Apprentice p-value N
(p-Adj) (p-Adj) (p-Adj) (p-Adj) (p-Adj)
Stock Bead coupling -0.07 0.15 112 0.02 0.75 448 -0.06 0.18 448 -0.07 0.12 448 -0.12 0.01 448
(0.22) (0.84) (0.24) (0.22) (0.05)
Stock Sample predilution -0.07 0.15 448 0.01 0.81 112 -0.07 0.15 448 -0.07 0.15 448 -0.13 <0.01 448
(0.22) (0.84) (0.22) (0.22) (0.05) Incubation 37˚C -0.07 0.18 448 0.01 0.81 448 -0.07 0.15 112 -0.07 0.15 448 -0.15 <0.01 448 (0.24) (0.84) (0.22) (0.22) (0.05) Manual Wash -0.07 0.12 448 0.01 0.81 448 -0.07 0.15 448 -0.07 0.15 112 -0.13 <0.01 448 (0.22) (0.84) (0.22) (0.22) (0.05) Operator apprentice -0.05 0.34 448 0 0.92 448 -0.1 0.047 448 -0.08 0.1 448 -0.13 <0.01 112 (0.42) (0.92) (0.09) (0.22) (0.05) https://doi.org/10.1371/journal.pone.0199278.t002
Fig 6. Impact of temperatures of incubation across coupling conditions on the positive control assay variability. Variability was measured as mean log10MAD of log10MFI with 95% confidence intervals. P-values correspond to the
difference between variability associated to each temperature of incubation when beads were coupled once (stock) or three times along the study (several).
between replicates of test samples agrees with the results from the positive control ICC analy-sis. Taking together, these results suggest that duplicates in positive control and samples repli-cate very well, therefore investing in more dilutions instead of replirepli-cates may improve the assay precision by increasing the likelihood of MFIs falling in the linear part of the antigen-specific curve.
Additionally, to establish the minimum optimal number of blank replicates, we calculated the ICCs for all blanks together and each combination of blanks (Table 3). ICCs between blank replicates were lower than for positive control replicates, ranging from 0.69–0.97 and indepen-dently of antigen immunogenicity. However, the ICC of three blanks was similar to the ICC of two blanks, and the distribution of the mean and interquartile ranges of the different combina-tions of blank replicates showed no difference between using two or three replicates (Fig 7C).
Discussion
One of the major challenges of large immunological studies is to have precise and robust high-throughput techniques to generate reliable results [13]. Herein we systematically assessed potential sources of variability in operator’s performance and conditions of an IgG qSAT assay
Table 3. Interclass correlation coefficient (ICC) between replicates. A) ICC for the replicates of the positive control serial dilutions (2.5-fold starting at 1:50 with repli-cates in alternate positions); and B) ICC for the three blanks per plate. ICCs are assessed for each antigen and all dilutions combined.
A. Positive control replicates B. Blank replicates
Antigen Duplicated dilution ICC Antigen ICC (all) ICC (1vs.2) ICC (1vs.3) ICC (2vs.3)
AMA-1 1:50 0.94 AMA-1 0.67 0.65 0.71 0.64 AMA-1 1:313 0.98 EBA-175 0.86 0.81 0.82 0.97 AMA-1 1:1954 0.98 LSA-1 0.81 0.83 0.73 0.87 AMA-1 1:12207 0.97 MSP-142 0.72 0.69 0.66 0.91 EBA-175 1:50 0.94 VAR2CSA 0.97 0.96 0.96 0.99 EBA-175 1:313 0.96 Rh5 0.76 0.77 0.71 0.82 EBA-175 1:1954 0.94 SSP2 0.69 0.72 0.73 0.63 EBA-175 1:12207 0.97 LSA-1 1:50 0.99 LSA-1 1:313 0.99 LSA-1 1:1954 0.99 LSA-1 1:12207 0.98 MSP-142 1:50 0.90 MSP-142 1:313 0.97 MSP-142 1:1954 0.89 MSP-142 1:12207 0.94 VAR2CSA 1:50 0.98 VAR2CSA 1:313 0.98 VAR2CSA 1:1954 0.99 VAR2CSA 1:12207 0.98 Rh5 1:50 0.97 Rh5 1:313 0.95 Rh5 1:1954 0.90 Rh5 1:12207 0.96 SSP2 1:50 0.97 SSP2 1:313 0.95 SSP2 1:1954 0.92 SSP2 1:12207 0.90 https://doi.org/10.1371/journal.pone.0199278.t003
against sevenP. falciparum antigens with diverse immunogenicities aiming to establish the most optimal parameters. To our knowledge, this is the first time that a fractional factorial design has been used to assess the effect of several assay conditions on outcomes [16]. Frac-tional factorial design reduces the total number of experiments while determining the parame-ters that give the maximum sensitivity range with the maximum accuracy, providing valid results for multifactorial effects [42].
Fig 7. Assessment of replicates performance in the positive control, test samples and blanks. A) Bland-Altman plots showing the differences of positive control serial dilution replicates against its mean for MSP-142and VAR2CSA. Dashed blue lines show the 95% confidence interval of the differences. B) Boxplots representing the
distribution of replicate MFI ratios for the four dilutions of test samples and per antigen. C) Boxplots representing the distribution of pairs and triplets of blanks per antigen (b1 blank1, b2 blank 2, and b3 blank3). Boxplots represent the mean and interquartile range.
The qSAT multiplexed format has the advantage of allows analyzing antibody responses to up to 500 antigens in one single reaction [10], although the number of antigens that can be analyzed at a time depends on the type of microspheres, instrument and technology used. By testing MFI mean differences with pooled antigens and dilutions, we showed that among test samples there were different effects on assay variability depending on the coupling (stock vs. several), sample predilution (stock vs. daily), temperature of incubation of samples with anti-gen-bead (22˚C vs. 37˚C) and plate washing (automatic vs. manual). Also, variability of blanks was different depending on the operator expertise. However, in this crude analysis, antigen immunogenicities were not taken into account. In fact, we showed that the MFI quantification range for each antigen was different (Fig 2). As a result, the same sample or control would have different optimal working dilutions for a given antigen.
In the qSAT assays, it is common practice to extrapolate fluorescence data to concentration [43–45], but analytes at low concentration might be out of standard curve detection limits, making difficult to do the estimation. Fluorescence-based analysis have higher statistical power than concentration-based analysis, thus are a better choice for assigning statistical sig-nificance to main effects. Also, fluorescence responses are measured independently from a standard curve, reflecting actual variation, while estimated concentration values are dictated by the precision of the standard curve [44]. For all these reasons, we assessed the effect of mul-tiple assay conditions on a mulmul-tiplex qSAT assay performance on different dilutions of test and positive control samples based on crude fluorescence measurements. Using serial dilutions of a positive control to fit sigmoidal curves into a non-linear equation gives the antigen-spe-cific quantifiable ranges used to choose the optimal sample dilution, increasing the sensitivity to assess the effect of different assay conditions on assay variability. These curves could also be applied to normalize day-to-day variability. We have shown that each antigen and sample combinations have an optimal sample dilution to assess variability, which depends on antigen immunogenicity and sample immunogenic profile. Consequently, when working with multi-dimensional data, crude fluorescence measurements are limited to find an effect on assay vari-ability of different assay conditions, and this may drive to wrong conclusions. To overcome this difficulty we performed MAD by antigen and sample dilution for each condition [46].
The variability of the 16 combinations of conditions for all the positive control dilutions together and per antigen, showed that the combination with lower variability for most antigens was a unique coupling of beads with daily sample predilution and automatic plate washer. When ranking the MAD of the 16 combinations of conditions for all the positive control dilu-tions and all antigens together, the only difference between the combinadilu-tions giving the lowest and the highest variability was the antigen-bead coupling (stock vs. several, respectively), showing that stock coupling was very important to reduce variability. However, we cannot dis-card the effect on variability of one condition on another.
The linear regression models showed that when assaying the positive control, stock cou-pling and sample incubation at 37˚C resulted in less variability. Accordingly, variability increased if coupling was performed several times along the study and samples were incubated at 22˚C compared to incubating at 37˚C. Interestingly, the use of a unique coupling reduced the variability, no matter the temperature of sample incubation. Similarly, when assessing vari-ability in the blanks we observed an increase of varivari-ability when stock coupling was not in the models, suggesting that stock coupling reduces variability of background signal. The proce-dure to wash plates did not affect the variability of the assay. However, in the analysis of com-bined conditions by the MAD, automatic washing seemed to reduce variability. Given the time and resources that automatic washing needs, and knowing that manual washing does not significantly add more variability, we consider acceptable to perform manual washing if this is the only option available.
Operator expertise did not affect assay variability, but the MFI quantification range was reduced when an apprentice performed the assay. Further studies assessing the operator day-to-day and inter-laboratory variability are needed to have more accurate reproducibility measurements.
Optimizing qSAT plate design, keeping the optimal number of replicates and dilutions, is crucial to ensure assay quality, being especially relevant in large immunological studies. Repli-cate measurements of the same sample provide random error estimates and direct estimates of variability. They also reduce the number of false negatives without increasing the number of false positives [47]. Our positive control data showed that some antigens presented less dis-crepancy between replicates in the first dilution (AMA-1, EBA-175, MSP-142) and some others between replicates in the third dilution (VAR2CSA and SSP2). Thus, we cannot make any rec-ommendation with regards to replicates of specific sample dilutions because robustness was antigen-specific. However, overall differences between replicates of test samples were minimal. In addition, to increase the sensitivity of a multiplex qSAT assay we have to ensure that sample MFIs fall in the linear part of the antigen-specific curve. Thus, in assays with multiplexed anti-gens and samples with different seroreactivities, having less replicates and more sample dilu-tions may increase the likelihood of MFIs falling in the linear part of the antigen-specific curve, increasing assay precision. Finally, we also showed that two blank replicates had the same ICCs estimates as three replicates, thus two blanks per plate would be sufficient.
Our study had as main limitation that the operator expertise was later included in the analy-sis, thus the fractional factorial design did not include this variable when the study was con-ceived. Hence, some of the models might lack power to detect true differences on assay variability.
Conclusion
The qSAT is a robust assay to measure a broad range of antibody specificities against multiple antigens, giving reproducible measurements. Fractional factorial design allowed us to measure the effect of several conditions on assay variability, reducing the number of experiments and giving maximum sensitivity and accuracy. We showed that a single antigen-bead coupling for the whole study was the variable that most consistently reduced assay variability, being clearly advisable. In addition, whenever possible, prediluting samples at the beginning of the study, as well as washing plates automatically are recommended. Finally, in multiplex qSAT assays with antigens of different immunogenicities, adding more sample dilutions instead of replicates may increase the likelihood of MFIs falling in the linear part of the antigen-specific curve thus increasing assay sensitivity and precision.
Supporting information
S1 Table. Fractional factorial design of the qSAT experiments. The assay conditions
ana-lyzed were coupling of the antigens to beads (stock vs. several), sample predilution (stock, vs. daily), temperature of incubation of samples with antigen-beads (22˚C vs. 37˚C), plate washing (manual vs. automatic) and operator expertise (expert vs. apprentice).
(XLSX)
S2 Table. Study dataset. Data file with the variables described as follows: plate; type, multiplex
(mp) or singleplex (sp); antigen, the antigen analysed; Sample Type, Blank, Positive (positive controls), Standard (singleplex) or Subject; Sample Dil, number of sample dilution for each sample type; well, well on each plate; Dilution, dilution factor; Bead, coupling of the bead (stock vs. several); Predilution of the sample (stock vs. daily); Temperature of sample-beads
incubation (22˚C vs. 37˚C), Washing (automatic vs. manual) and Condition, all condition together; mfi, median fluorescence intensity; and log10_mfi.
(XLSX)
S1 Fig. Example of plate design. Each plate included nine subject samples in 4 serial dilutions
with duplicates in alternate positions (M1-M9, in blue), a positive control in 8 serial dilutions, with replicates in alternate positions (PosCtrl, in red), and three blanks with multiplex anti-gen-coupled beads (Blanks, in yellow).
(PDF)
S2 Fig. Antigen-specific log10MFI levels of positive control serial dilutions for all assay
conditions and antigens analyzed. Spaghetti plots represent examples of positive control
serial dilution MFIs against different antigens and in different assay conditions: Antigen-bead coupling (stock vs. several), sample predilution (stock vs. daily), temperature of sample-beads incubation (22˚C vs. 37˚C), plate washing (automatic vs. manual) and operator expertise (expert vs. apprentice). Grey lines correspond to data from each plate and black lines are loess fitted.
(PDF)
S3 Fig. Median absolute deviation (MAD) of log10MFI of positive control serial dilutions
for each assay condition and antigen. Conditions analyzed were: Antigen-bead coupling
(stock vs. several), sample predilution (stock vs. daily), temperature of incubation of samples with antigen-beads (22˚C vs. 37˚C), plate washing (automatic vs. manual) and operator exper-tise (experienced vs. apprentice).
(PDF)
S4 Fig. Bland-Altman plots representing the differences of positive control replicates against its mean for all antigens. Dashed blue lines show the 95% confidence interval of the
differences. (PDF)
Acknowledgments
We thank volunteers from whom samples were derived, and the clinical and laboratory teams conducting the field studies. We are grateful to Ana Mª Fonseca for design discussions, Laura Puyol and Diana Barrios for logistic support, Nu´ria Dı´ez and Nana Aba Williams for manage-ment support and Aintzane Ayestaran for statistical support.
Author Contributions
Conceptualization: Itziar Ubillos, Ruth Aguilar, Alfons Jime´nez, Marta Vidal, Aida
Valma-seda, John J. Aponte, Joseph J. Campo, Clarissa Valim, Jaroslaw Harezlak, Carlota Dobaño.
Data curation: Itziar Ubillos, Hector Sanz, Yan Dong, Jaroslaw Harezlak. Formal analysis: Hector Sanz, Yan Dong, Clarissa Valim, Jaroslaw Harezlak. Funding acquisition: Carlota Dobaño.
Investigation: Itziar Ubillos, Alfons Jime´nez.
Methodology: Hector Sanz, Marta Vidal, John J. Aponte, Joseph J. Campo, Jaroslaw Harezlak. Project administration: Ruth Aguilar, Carlota Dobaño.
Supervision: Ruth Aguilar, Clarissa Valim, Jaroslaw Harezlak, Carlota Dobaño.
Visualization: Itziar Ubillos, Hector Sanz, Yan Dong, Jaroslaw Harezlak. Writing – original draft: Itziar Ubillos, Ruth Aguilar, Carlota Dobaño.
Writing – review & editing: Hector Sanz, Alfons Jime´nez, Marta Vidal, Aida Valmaseda, Yan
Dong, Deepak Gaur, Chetan E. Chitnis, Sheetij Dutta, Evelina Angov, John J. Aponte, Joseph J. Campo, Clarissa Valim, Jaroslaw Harezlak.
References
1. Doolan DL. Plasmodium immunomics. Int J Parasitol. England; 2011; 41: 3–20.https://doi.org/10.1016/ j.ijpara.2010.08.002PMID:20816843
2. Baker HN, Murphy R, Lopez E, Garcia C. Conversion of a capture ELISA to a Luminex xMAP assay using a multiplex antibody screening method. J Vis Exp. United States; 2012;https://doi.org/10.3791/ 4084PMID:22806215
3. Yasgar A, Jadhav A, Simeonov A, Coussens NP. AlphaScreen-Based Assays: Ultra-High-Throughput Screening for Small-Molecule Inhibitors of Challenging Enzymes and Protein-Protein Interactions. Methods Mol Biol. United States; 2016; 1439: 77–98.https://doi.org/10.1007/978-1-4939-3673-1_5 PMID:27316989
4. Wang H, Zhang X-M, Tomiyoshi G, Nakamura R, Shinmen N, Kuroda H, et al. Association of serum lev-els of antibodies against MMP1, CBX1, and CBX5 with transient ischemic attack and cerebral infarction. Oncotarget. United States; 2018; 9: 5600–5613.https://doi.org/10.18632/oncotarget.23789PMID: 29464021
5. Pulido-Olmo H, Rodriguez-Sanchez E, Navarro-Garcia JA, Barderas MG, Alvarez-Llamas G, Segura J, et al. Rapid, Automated, and Specific Immunoassay to Directly Measure Matrix Metalloproteinase-9-Tissue Inhibitor of Metalloproteinase-1 Interactions in Human Plasma Using AlphaLISA Technology: A New Alternative to Classical ELISA. Front Immunol. Switzerland; 2017; 8: 853.https://doi.org/10.3389/ fimmu.2017.00853PMID:28791014
6. Yu ZTF, Guan H, Cheung MK, McHugh WM, Cornell TT, Shanley TP, et al. Rapid, automated, parallel quantitative immunoassays using highly integrated microfluidics and AlphaLISA. Sci Rep. England; 2015; 5: 11339.https://doi.org/10.1038/srep11339PMID:26074253
7. Roman DL, Ota S, Neubig RR. Polyplexed flow cytometry protein interaction assay: a novel high-throughput screening paradigm for RGS protein inhibitors. J Biomol Screen. United States; 2009; 14: 610–619.https://doi.org/10.1177/1087057109336590PMID:19531661
8. Hu H, Columbus J, Zhang Y, Wu D, Lian L, Yang S, et al. A map of WW domain family interactions. Pro-teomics. Germany; 2004; 4: 643–655.https://doi.org/10.1002/pmic.200300632PMID:14997488 9. Elshal MF, McCoy JP. Multiplex bead array assays: performance evaluation and comparison of
sensi-tivity to ELISA. Methods. United States; 2006; 38: 317–323.https://doi.org/10.1016/j.ymeth.2005.11. 010PMID:16481199
10. Lin A, Salvador A, Carter JM. Multiplexed Microsphere Suspension Array-Based Immunoassays. Meth-ods Mol Biol. United States; 2015; 1318: 107–118.https://doi.org/10.1007/978-1-4939-2742-5_11 PMID:26160569
11. Lucas JL, Tacheny EA, Ferris A, Galusha M, Srivastava AK, Ganguly A, et al. Development and valida-tion of a Luminex assay for detecvalida-tion of a predictive biomarker for PROSTVAC-VF therapy. PLoS One. United States; 2017; 12: e0182739.https://doi.org/10.1371/journal.pone.0182739PMID:28771597 12. Kettman JR, Davies T, Chandler D, Oliver KG, Fulton RJ. Classification and properties of 64 multiplexed
microsphere sets. Cytometry. United States; 1998; 33: 234–243. PMID:9773885
13. Andreasson U, Perret-Liaudet A, van Waalwijk van Doorn LJC, Blennow K, Chiasserini D, Engelborghs S, et al. A Practical Guide to Immunoassay Method Validation. Front Neurol. Switzerland; 2015; 6: 179. https://doi.org/10.3389/fneur.2015.00179PMID:26347708
14. Joelsson D, Moravec P, Troutman M, Pigeon J, DePhillips P. Optimizing ELISAs for precision and robustness using laboratory automation and statistical design of experiments. J Immunol Methods. Netherlands; 2008; 337: 35–41.https://doi.org/10.1016/j.jim.2008.05.012PMID:18572188 15. Montgomery D. Design and Analysis of Experiments. Inc JW& S, editor. 2005.
16. Altekar M, Homon CA, Kashem MA, Mason SW, Nelson RM, Patnaude LA, et al. Assay optimization: a statistical design of experiments approach. Clin Lab Med. United States; 2007; 27: 139–154.https://doi. org/10.1016/j.cll.2007.01.001PMID:17416307
17. Ubillos I, Campo JJ, Jimenez A, Dobano C. Development of a high-throughput flexible quantitative sus-pension array assay for IgG against multiple Plasmodium falciparum antigens. Malar J. England; 2018; 17: 216.https://doi.org/10.1186/s12936-018-2365-7PMID:29843713
18. Alonso PL, Sacarlal J, Aponte JJ, Leach A, Macete E, Aide P, et al. Duration of protection with RTS,S/ AS02A malaria vaccine in prevention of Plasmodium falciparum disease in Mozambican children: sin-gle-blind extended follow-up of a randomised controlled trial. Lancet (London, England). England; 2005; 366: 2012–2018.https://doi.org/10.1016/S0140-6736(05)67669-6
19. Moncunill G, Mayor A, Jimenez A, Nhabomba A, Casas-Vila N, Puyol L, et al. High antibody responses against Plasmodium falciparum in immigrants after extended periods of interrupted exposure to malaria. PLoS One. 2013/08/24. 2013; 8: e73624.https://doi.org/10.1371/journal.pone.0073624PMID: 23967347
20. Rovira-Vallbona E, Moncunill G, Bassat Q, Aguilar R, Machevo S, Puyol L, et al. Low antibodies against Plasmodium falciparum and imbalanced pro-inflammatory cytokines are associated with severe malaria in Mozambican children: a case-control study. Malar J. England; 2012; 11: 181.https://doi.org/10.1186/ 1475-2875-11-181PMID:22646809
21. Menendez C, Bardaji A, Sigauque B, Romagosa C, Sanz S, Serra-Casas E, et al. A randomized pla-cebo-controlled trial of intermittent preventive treatment in pregnant women in the context of insecticide treated nets delivered through the antenatal clinic. PLoS One. United States; 2008; 3: e1934.https:// doi.org/10.1371/journal.pone.0001934PMID:18398460
22. Bryan D, Silva N, Rigsby P, Dougall T, Corran P, Bowyer PW, et al. The establishment of a WHO Refer-ence Reagent for anti-malaria (Plasmodium falciparum) human serum. Malar J. England; 2017; 16: 314.https://doi.org/10.1186/s12936-017-1958-xPMID:28779755
23. Gottschalk PG, Dunn JR. The five-parameter logistic: a characterization and comparison with the four-parameter logistic. Anal Biochem. United States; 2005; 343: 54–65.https://doi.org/10.1016/j.ab.2005. 04.035PMID:15953581
24. Pandey KC, Singh S, Pattnaik P, Pillai CR, Pillai U, Lynn A, et al. Bacterially expressed and refolded receptor binding domain of Plasmodium falciparum EBA-175 elicits invasion inhibitory antibodies. Mol Biochem Parasitol. Netherlands; 2002; 123: 23–33. PMID:12165386
25. Reddy KS, Pandey AK, Singh H, Sahar T, Emmanuel A, Chitnis CE, et al. Bacterially expressed full-length recombinant Plasmodium falciparum RH5 protein binds erythrocytes and elicits potent strain-transcending parasite-neutralizing antibodies. Infect Immun. United States; 2014; 82: 152–164.https:// doi.org/10.1128/IAI.00970-13PMID:24126527
26. Reddy KS, Amlabu E, Pandey AK, Mitra P, Chauhan VS, Gaur D. Multiprotein complex between the GPI-anchored CyRPA with PfRH5 and PfRipr is crucial for Plasmodium falciparum erythrocyte invasion. Proc Natl Acad Sci U S A. United States; 2015; 112: 1179–1184.https://doi.org/10.1073/pnas. 1415466112PMID:25583518
27. Angov E, Hillier CJ, Kincaid RL, Lyon JA. Heterologous protein expression is enhanced by harmonizing the codon usage frequencies of the target gene with those of the expression host. PLoS One. United States; 2008; 3: e2189.https://doi.org/10.1371/journal.pone.0002189PMID:18478103
28. Kocken CHM, Withers-Martinez C, Dubbeld MA, van der Wel A, Hackett F, Valderrama A, et al. High-level expression of the malaria blood-stage vaccine candidate Plasmodium falciparum apical mem-brane antigen 1 and induction of antibodies that inhibit erythrocyte invasion. Infect Immun. United States; 2002; 70: 4471–4476.https://doi.org/10.1128/IAI.70.8.4471-4476.2002PMID:12117958 29. Angov E, Aufiero BM, Turgeon AM, Van Handenhove M, Ockenhouse CF, Kester KE, et al.
Develop-ment and pre-clinical analysis of a Plasmodium falciparum Merozoite Surface Protein-1(42) malaria vaccine. Mol Biochem Parasitol. Netherlands; 2003; 128: 195–204. PMID:12742586
30. Zhu J, Hollingdale MR. Structure of Plasmodium falciparum liver stage antigen-1. Mol Biochem Parasi-tol. Netherlands; 1991; 48: 223–226. PMID:1840628
31. Guerin-Marchand C, Druilhe P, Galey B, Londono A, Patarapotikul J, Beaudoin RL, et al. A liver-stage-specific antigen of Plasmodium falciparum characterized by gene cloning. Nature. England; 1987; 329: 164–167.https://doi.org/10.1038/329164a0PMID:3306406
32. Khusmith S, Charoenvit Y, Kumar S, Sedegah M, Beaudoin RL, Hoffman SL. Protection against malaria by vaccination with sporozoite surface protein 2 plus CS protein. Science. United States; 1991; 252: 715–718. PMID:1827210
33. Robson KJ, Hall JR, Jennings MW, Harris TJ, Marsh K, Newbold CI, et al. A highly conserved amino-acid sequence in thrombospondin, properdin and in proteins from sporozoites and blood stages of a human malaria parasite. Nature. England; 1988; 335: 79–82.https://doi.org/10.1038/335079a0PMID: 3045563
34. Fonseca AM, Quinto L, Jimenez A, Gonzalez R, Bardaji A, Maculuve S, et al. Multiplexing detection of IgG against Plasmodium falciparum pregnancy-specific antigens. PLoS One. United States; 2017; 12: e0181150.https://doi.org/10.1371/journal.pone.0181150PMID:28715465
35. Ord RL, Rodriguez M, Lobo CA. Malaria invasion ligand RH5 and its prime candidacy in blood-stage malaria vaccine design. Hum Vaccin Immunother. United States; 2015; 11: 1465–1473.https://doi.org/ 10.1080/21645515.2015.1026496PMID:25844685
36. Vidal M, Aguilar R, Campo JJ, Dobano C. Development of quantitative suspension array assays for six immunoglobulin isotypes and subclasses to multiple Plasmodium falciparum antigens. J Immunol Meth-ods. Netherlands; 2018;https://doi.org/10.1016/j.jim.2018.01.009PMID:29397157
37. Gottschalk PG, Dunn JR. Determining the error of dose estimates and minimum and maximum accept-able concentrations from assays with nonlinear dose-response curves. Comput Methods Programs Biomed. Ireland; 2005; 80: 204–215.https://doi.org/10.1016/j.cmpb.2005.08.003PMID:16256244 38. Defawe OD, Fong Y, Vasilyeva E, Pickett M, Carter DK, Gabriel E, et al. Optimization and qualification
of a multiplex bead array to assess cytokine and chemokine production by vaccine-specific cells. J Immunol Methods. Netherlands; 2012; 382: 117–128.https://doi.org/10.1016/j.jim.2012.05.011PMID: 22626638
39. Shrout PE, Fleiss JL. Intraclass correlations: uses in assessing rater reliability. Psychol Bull. United States; 1979; 86: 420–428. PMID:18839484
40. Bland JM, Altman DG. Statistical methods for assessing agreement between two methods of clinical measurement. Lancet (London, England). England; 1986; 1: 307–310.
41. Benjamini Y. and YH. Controlling the false discovery rate: a practical and powerful approach to multiple testing. J R Stat Soc. 1995; B 57: 289–300.
42. Reiken SR, Van Wie BJ, Sutisna H, Kurdikar DL, Davis WC. Efficient optimization of ELISAs. J Immunol Methods. Netherlands; 1994; 177: 199–206. PMID:7822827
43. Valekova I, Skalnikova HK, Jarkovska K, Motlik J, Kovarova H. Multiplex immunoassays for quantifica-tion of cytokines, growth factors, and other proteins in stem cell communicaquantifica-tion. Methods Mol Biol. United States; 2015; 1212: 39–63.https://doi.org/10.1007/7651_2014_94PMID:25063502
44. Breen EJ, Tan W, Khan A. The Statistical Value of Raw Fluorescence Signal in Luminex xMAP Based Multiplex Immunoassays. Sci Rep. England; 2016; 6: 26996.https://doi.org/10.1038/srep26996PMID: 27243383
45. Biancotto A, Wank A, Perl S, Cook W, Olnes MJ, Dagur PK, et al. Baseline levels and temporal stability of 27 multiplexed serum cytokine concentrations in healthy subjects. PLoS One. United States; 2013; 8: e76091.https://doi.org/10.1371/journal.pone.0076091PMID:24348989
46. Barde MP, Barde PJ. What to use to express the variability of data: Standard deviation or standard error of mean? Perspect Clin Res. India; 2012; 3: 113–116.https://doi.org/10.4103/2229-3485.100662 PMID:23125963
47. Birmingham A, Selfors LM, Forster T, Wrobel D, Kennedy CJ, Shanks E, et al. Statistical methods for analysis of high-throughput RNA interference screens. Nat Methods. United States; 2009; 6: 569–575. https://doi.org/10.1038/nmeth.1351PMID:19644458