Analysis of protein coding mutations in hiPSCs and their
possible role during somatic cell reprogramming
Sergio Ruiz1,*, Athurva Gore2,*, Zhe Li2, Athanasia D. Panopoulos1, Nuria Montserrat3, Ho-Lim Fung2, Alessandra Giorgetti3, Josipa Bilic3, Erika M. Batchelder1, Holm Zaehres4, Hans R. Schöler4, Kun Zhang2,#, and Juan Carlos Izpisua Belmonte1,3,#
1Gene Expression Laboratory, Salk Institute for Biological Studies, 10010 North Torrey Pines
Road, La Jolla, CA 92037
2Department of Bioengineering, University of California at San Diego, 9500 Gilman Drive, La
Jolla, CA, 92093, USA
3Center of Regenerative Medicine in Barcelona, Doctor Aiguader, 88, 08003 Barcelona, Spain 4Department of Cell and Developmental Biology, Max Planck Institute for Molecular Biomedicine,
Röntgenstrasse 20, 48149 Münster, Germany
Abstract
Recent studies indicate that human induced pluripotent stem cells (hiPSCs) contain genomic structural variations and point mutations in coding regions. However, these studies have focused on fibroblast-derived hiPSCs, and it is currently unknown whether the use of alternative somatic cell sources with varying reprogramming efficiencies would result in different levels of genetic alterations. Here we characterize the genomic integrity of eight hiPSC lines derived from five different non-fibroblast somatic cell types. We show that protein-coding mutations are a general feature of the hiPSC state and are independent of somatic cell source. Furthermore, we analyze a total of 17 point mutations found in hiPSCs and demonstrate that they do not generally facilitate the acquisition of pluripotency and thus are not likely to provide a selective advantage for reprogramming.
INTRODUCTION
The induction of pluripotency in human somatic cells by defined transcription factors represents a breakthrough in regenerative medicine1–5. The generation of patient-specific human induced pluripotent stem cells (hiPSCs) and their autologous cell derivatives would
Users may view, print, copy, download and text and data- mine the content in such documents, for the purposes of academic research, subject always to the full Conditions of use: http://www.nature.com/authors/editorial_policies/license.html#terms
#Correspondence should be addressed to: Kun Zhang ([email protected], Tel: 858-822-7876; Fax: 858-534-5722) and Juan
Carlos Izpisua Belmonte ([email protected]/ [email protected], Tel: 858-453-4100 ext: 1130). *These authors contributed equally to this work.
AUTHOR CONTRIBUTIONS
SR, AG, KZ and JCIB designed the experiments. SR, AG, NM, AGi, JB, ADP, ZL, HF and EMB carried out experiments. HZ and HS
HHS Public Access
Author manuscript
Nat Commun. Author manuscript; available in PMC 2013 December 09.
Published in final edited form as:
Nat Commun. 2013 ; 4: 1382. doi:10.1038/ncomms2381.
Author Manuscript
Author Manuscript
Author Manuscript
help to overcome the problems of immune rejection and tissue availability. However, the applications of cell therapies in human patients are subject to very stringent safety requirements, and there is a general concern in the field about the safety of hiPSCs. Successful generation of hiPSCs depends on the complete reprogramming of the somatic epigenome to a pluripotent state while the genome remains unchanged. Although initial reports demonstrated that human embryonic stem cells (hESCs) and hiPSCs were very similar, recent reports have uncovered striking genetic and epigenetic differences between these two pluripotent cell types6–11. It has been shown that hiPSCs display protein-coding mutations, large-scale genomic rearrangements, persistent epigenetic marks from the somatic cell type of origin and aberrant methylation patterns6, 9, 11. These findings indicated that hiPSCs contain genomic defects that could preclude their use in stem cell therapies. However, most of these studies focused on fibroblast-derived hiPSCs and a more comprehensive analysis is essential to determine whether there are specific somatic cell types that may reprogram into hiPSCs with fewer (or perhaps none) of these aberrations. Additionally, it is unclear whether the protein-coding mutations found in hiPSCs provide any functional advantage and thus, are selected for during the process of reprogramming. In this work, we characterize at single nucleotide resolution the genomic integrity of eight hiPSC lines derived from five different non-fibroblast somatic cell types with varied reprogramming efficiencies. Moreover, we functionally characterize the role of 17 point mutations found in hiPSCs for their ability to increase reprogramming efficiency. We demonstrate that the majority of these mutations do not favor the reprogramming process and suggest that most of them originated randomly or were initially present in the somatic population of origin. Our observations of the genetic abnormalities of hiPSCs will contribute to a deeper understanding of the reprogramming process.
RESULTS
hiPSC lines from varied cell types contain protein-coding mutations
We previously sequenced the protein-coding regions of 22 fibroblast-derived hiPSC lines and discovered that the hiPSCs analyzed carried between 2 and 14 point mutations in protein-coding regions6. In this study, we sought to determine if low reprogramming efficiency (and therefore a potentially higher level of selection pressure which could allow the fixation of advantageous mutations) or cell type of origin (as fibroblasts could possess a higher somatic mutation rate than other cell types) could contribute to the overall
reprogramming-associated mutational load. To this end, we performed targeted exome sequencing on eight non-fibroblast derived hiPSC lines and their five somatic cell types of origin using an in-solution hybridization capture method (Supplementary Table S1). Somatic mutations in each hiPSC line were identified via pairwise comparison with the matched somatic cell of origin and independently confirmed with capillary Sanger sequencing. We identified a total of 40 point mutations throughout all the hiPSC lines analyzed, leading to an average of 5 coding mutations per line (Table 1). As we identified ~89% of expected total single nucleotide polymorphisms at high sequencing depth in protein-coding regions, this led to a projection of 45 total mutations in protein-coding regions, or approximately 6 coding mutations per cell line. The levels of mutational load from each individual somatic
Author Manuscript
Author Manuscript
Author Manuscript
cell type were statistically indistinguishable, and within the range previously observed for fibroblast-derived hiPSC lines6 (Table 1). These results indicate that hiPSC-associated mutations cannot be avoided by using younger or potentially more genetically protected somatic cell sources as progenitor cells. Moreover, we determined that reprogramming efficiency, which varies between 0.001–3% for these cell types, did not seem to have a measurable effect on the hiPSC mutational load. Thus, reprogramming-associated point mutations appear to be a general feature of hiPSCs.
We next investigated whether mutations in hiPSCs were either enriched or depleted in protein coding-regions. To this end, we examined additional non-coding regions captured in our sequencing analysis, and found a similar mutation rate per base pair analyzed for both coding and non-coding regions (Table 2). We also investigated whether point mutations in hiPSCs tended to occur in active/ubiquitous or silent/tissue-specific genes. Among a total of 132 mutated genes (from this study and Gore et al) annotated in the TiGER Database (TIssue-specific Gene Expression and Regulation)12, 37% of these genes showed tissue-specific expression, which is very similar to the overall level of tissue tissue-specificity observed in the genes annotated in the database (34%; p=0.4975), indicating that mutations are not preferentially occurring in silent genes. We additionally checked for any potential enrichment of mutations in active or inactive transcriptional regions of the genome13. We found that mutations were not significantly enriched in the active or inactive chromatin regions of fibroblasts (p-value=0.79), hESCs (p-value=0.29), or hiPSCs (p-value=0.07). Furthermore, only one gene (NTRK3) was found mutated in more than one independent hiPSC line and mutated genes did not cluster in a specific functional pathway (Gore et al6 and results herein). These combined findings suggest that mutations in hiPSCs are spread throughout both transcriptionally active and silent regions of the genome.
hiPSC-point mutations do not favor the process of reprogramming
We previously showed that at least half of reprogramming-associated point mutations pre-exist in starting somatic cell populations at low frequency6. This leads to a hypothesis that a sub-population of somatic cells carrying certain mutations could be primed for
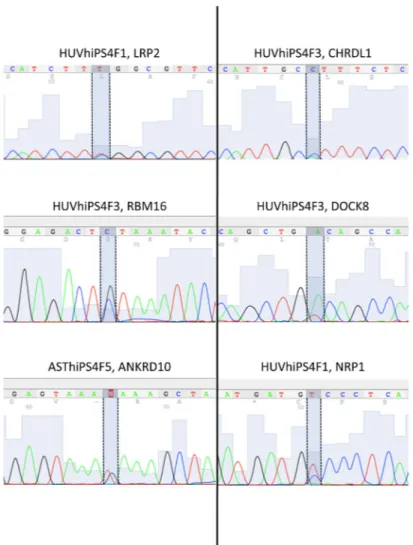
reprogramming, which would be consistent with the elite model for reprogramming14. To investigate the functional potential of these mutations during reprogramming we first assessed whether mutated alleles were expressed in the hiPSC lines. We isolated RNA from 3 hiPSC lines, reverse-transcribed it into cDNA, and sequenced a total of 6 transcripts of randomly selected genes found mutated in these hiPSC lines. We detected heterozygous expression of both mutant and wild-type alleles in all cases (Fig. 1) indicating that mutated transcripts are expressed in hiPSCs.
We next sought to determine if reprogramming-associated mutations could contribute functionally in facilitating the acquisition of pluripotency during reprogramming. From a total of 164 different genes found mutated in hiPSC lines (Gore et al6 and this study), we assayed the function of 17 candidate genes and their mutated forms during reprogramming (Supplementary Table S2). These candidate genes were selected based on the likelihood of the mutation to change protein function, the mutation type (only nonsynonymous mutations were analyzed) and whether the gene was known to be related to the maintenance and/or
Author Manuscript
Author Manuscript
Author Manuscript
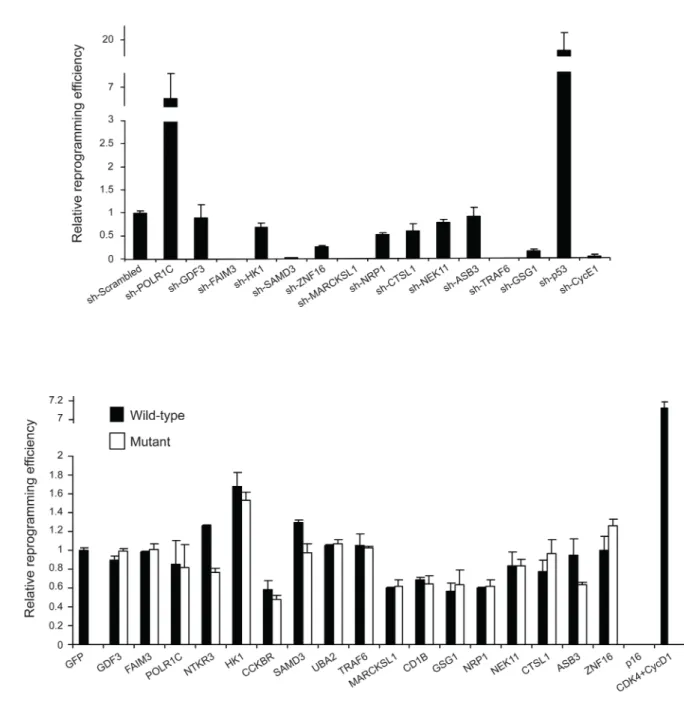
acquisition of pluripotency6 (Table 1; Supplementary Fig. S1; Supplementary Table S2). We also analyzed the expression of these 17 genes in BJ fibroblasts, human umbilical vein endothelial cells (HUVEC), hESC and hiPSC lines to ensure gene expression in at least one of the somatic cell types used in this work (Supplementary Fig. S2). Due to the difficulty in predicting the functional consequences of each specific mutation, we first performed “loss-of-function” reprogramming experiments to mimic a possible diminished activity or protein instability of the mutated form. To this end, we designed a panel of lentiviruses encoding shRNAs against the selected genes (Supplementary Fig. S3a), and co-infected each separately with retroviruses expressing OCT4, SOX2, KLF4 and cMyc (OSKC) in BJ fibroblasts (Fig. 2a). Moreover, to determine whether these effects were cell-type specific we performed similar reprogramming experiments in HUVEC (Supplementary Fig. S4a). If a genetic mutation was selected for its ability to facilitate reprogramming due to a loss of protein function, it would be expected that down-regulation of the mutated gene would increase reprogramming efficiency. A decrease in reprogramming efficiency was detected after down-regulation of FAIM3, SAMD3, ZNF16, MARCKSL1, NRP1, TRAF6, GSG1 and HK1, whereas no significant changes were detected after down-regulation of all but one of the assayed genes, POLR1C (Fig. 2a, Supplementary Fig. 4a, Supplementary Fig. S4b). Interestingly, we observed that down-regulation of POLR1C in BJ fibroblasts, but not in HUVEC, resulted in an increased reprogramming efficiency. However, it is unclear if the specific reprogramming-associated mutation in POLR1C would result in the same phenotype. Overall, our data suggest that protein-coding point mutations generally do not prime rare cells for reprogramming through the loss-of-function mechanism.
Next, we performed “gain-of-function” reprogramming experiments to determine whether expression of the mutated form facilitated cell reprogramming. To this end, we designed a panel of retroviruses encoding both the wild type form and the corresponding mutated form found in hiPSCs of each specific gene (see specific mutations in Supplementary Table S2; Supplementary Fig. S3b), and co-expressed them with OSKC in BJ fibroblasts and HUVEC (Fig. 2b, Supplementary Fig. S4c). If a mutation were selected during reprogramming due to a gain-of-function, it would be expected that expression of the mutated form would increase the reprogramming efficiency. We observed that only the expression of HK1 slightly increased reprogramming efficiency (Fig. 2b and Supplementary Fig. S4c). Importantly, we did not observe significant differences in reprogramming efficiency between cells over-expressing the mutated forms and cells over-over-expressing their respective wild-type forms (Fig. 2b), indicating that the presence of the mutated protein does not increase
reprogramming efficiency.
We have previously shown that both the mutant allele and the wild-type allele are expressed in hiPSCs (Fig. 1). However, it is possible that a similar level of expression of the wild-type and mutant protein forms is necessary in order for the mutation to influence reprogramming efficiency in a gain-of-function manner. To clarify this, we performed a reprogramming experiment where OSKC were co-expressed together with a similar total amount of retrovirus encoding either only the wild type form or both the wild-type (wt) and mutant (mut) forms of a mutated gene in an equal ratio (1:1). Using this strategy, we were able to compare the reprogramming efficiency of cells over-expressing wild-type and mutated
Author Manuscript
Author Manuscript
Author Manuscript
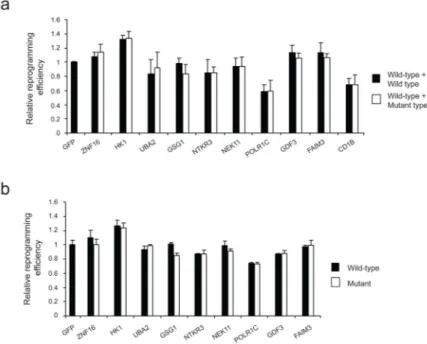
protein (wt/mut) in equal amounts with that of cells over-expressing wild-type protein alone (wt/wt). Interestingly, we did not observe any difference in reprogramming efficiency between cells over-expressing the wt/wt and wt/mut proteins (Fig. 3a). Finally, we
investigated whether silencing of retroviral transgenes during reprogramming could mask a gain-of-function effect of the mutated genes at a later stage of reprogramming. To this, we analyzed the reprogramming efficiency of cells infected with retroviruses expressing OSKC, the wild type or mutated forms of the genes evaluated in this study, and a red fluorescent protein (RFP) reporter gene to monitor transgene silencing. Reprogramming efficiency was evaluated based on the number of Tra-1-60+/RFP+ colonies present at day 14. These colonies represent putative bona-fide hiPSC colonies, as they express the stem cell marker Tra-1-60 but lack silencing of the exogenous transgenes. Thus, we only considered reprogramming events where transgene expression was still active. Importantly, we did not observe differences in reprogramming efficiency between cells over-expressing the mutated forms and cells over-expressing their respective wild-type forms (Fig. 3b). Furthermore, we also evaluated reprogramming efficiency in the same experiment at day 14 by analyzing the number of Tra-1-60+/RFP− colonies (evaluating putative bona-fide hiPSC colonies where transgene silencing occurred), and obtained a similar result (data not shown). Overall, these data suggest that most of these mutated genes do not facilitate reprogramming through a gain-of-function or loss-of-function mechanism.
DISCUSSION
Our work demonstrates that hiPSCs contain protein-coding mutations independent of the cell type of origin (as we analyzed hiPSC lines derived from five tissue types). Moreover, we determined that reprogramming efficiency, and therefore the level of selection pressure which could allow the fixation of advantageous mutations, did not to have a measurable effect on the hiPSC mutational load. Although the functional consequences of individual protein-coding mutations detected in hiPSCs remain to be characterized, these alterations could potentially contribute to the functional differences observed between hiPSC lines15–17. Two independent groups have recently reported the whole genome sequencing of human and murine iPSC lines and their corresponding somatic cell lines18–19. They identified hundreds of single nucleotide variants (SNVs) in non-coding regions as well as an average of 6–12 SNVs in coding regions18–19, which is consistent with our results6. Importantly, their data suggest that much of the genetic variation in iPSC clones pre-exists in the somatic population of origin and is fixed as a consequence of cloning individual cells during iPSC generation18–19. Although these reports supported previous observations6, they did not investigate whether identified mutations contribute functionally to facilitate the acquisition of pluripotency during reprogramming.
In this work, we show evidence suggesting that most reprogramming-associated point mutations do not provide a detectible selective advantage towards a reprogrammed state. Since inhibiting wild type POLR1C expression had a positive impact on reprogramming efficiency, we cannot rule out a potential role of the mutation found in POLR1C in facilitating reprogramming. If this is the case, the fact that down-regulation of POLR1C increases reprogramming efficiency in fibroblasts but not in HUVEC could indicate the existence of tissue-specific mutations affecting reprogramming efficiency, as PORL1CP278R
Author Manuscript
Author Manuscript
Author Manuscript
was found in one hiPSC line derived from human fibroblasts. Although it remains possible that untested mutated genes or a combination of mutations in a certain cellular context could play a role, the findings that only one gene (NTRK3) was found mutated in 2 out of 30 independent hiPSC lines, that mutated genes do not cluster in a specific functional pathway that could explain their selection during the reprogramming process, and that non-coding regions showed a similar mutational load, indicate that reprogramming-associated mutations seem to occur through a random process without selection and/or be initially present in the somatic population of origin18–19. It has been suggested that genomic alterations (i.e. duplications, deletions and mutations) are selected for during reprogramming, yet this has not been demonstrated6–11. In contrast to well-established recurrent genomic aberrations (e.g. chromosome 12 duplications) present in hESC or hiPSC lines that are functionally selected upon prolonged culture8, our results suggest that reprogramming-associated point mutations generally do not affect reprogramming efficiency although there could be exceptions. To our knowledge, the data provided herein provides for the first time a functional analysis of the role of specific genomic alterations (i.e. point mutations in coding regions) on the reprogramming process and have potential implications for the future of the hiPSC field in regenerative medicine.
METHODS
Cell cultureThe hiPSC lines ASThiPS4F4, ASThiPS4F5, HUVhiPS4F1, HUVhiPS4F3, FhiPS4F7, NSChiPS2F and FhiPS3F1 were already described6, 20–22, and obtained from existing cultures. The hiPSC lines MSChiPS4F4, MSChiPS4F8 and KhiPS4F8 show all the requirements (morphology, pluripotent gene expression, normal karyotype and in vivo differentiation by teratoma formation) to define them as hiPSC cell lines. Derived hiPSCs were cultured as described24. 293T cells and BJ human fibroblasts (ATCC, CRL-2522) were cultured in DMEM (Invitrogen) supplemented with 10% FBS and 0.1 mM non-essential aminoacids. HUVEC cells were obtained from Lonza (C-2519A) and grown with EGM-2 media (Lonza) as recommended. MSCs were kindly provided by Cécile Volle (Sanofi-Aventis) and grown in α-MEM (Invitrogen) containing 10% FBS (Hyclone), penicillin/ streptomycin, sodium pyruvate, nonessential amino acids, and L-glutamine (all from Invitrogen). Human keratinocytes were obtained and cultured as previously described23. hiPSC generation
To generate hiPSCs (KhiPS4F8, MSChiPS4F4 and MSChiPS4) or to evaluate reprogramming efficiency, experiments were performed as described with minor
modifications24. Briefly, BJ fibroblasts, keratinocytes, MSCs or HUVEC cells were infected with an equal ratio of retroviruses or retroviruses plus lentiviruses by spinfection of the cells at 1850 rpm for 1 hour at room temperature in the presence of polybrene (4 μg/ml). After one (in case of the HUVEC cells), two (in case of the BJs fibroblasts or keratinocytes) or three (in case of the MSCs) viral infections viral infections, cells were trypsinized and transferred onto fresh irradiated mouse embryonic or human fibroblasts (iMEFs or iHFs) where correspond. One day after, cells were switched to hES cell medium (DMEM/F12 or KO-DMEM (Invitrogen) supplemented with 20% Knockout Serum Replacement
Author Manuscript
Author Manuscript
Author Manuscript
(Invitrogen), 1 mM L-glutamine, 0.1 mM non-essential amino acids, 55 μM
β-mercaptoethanol and 10 ng/ml bFGF (Joint Protein Central)). Depending on the cell type of origin, colonies were stained for Nanog expression at day 18 (in the case of HUVEC-derived hiPS cells) or 24 (in the case of BJ fibroblasts-derived hiPS cells) or isolated to establish cell lines. To calculate the efficiency of reprogramming, we plated the same number of infected HUVEC or BJ fibroblasts cells on iMEFs after the infection and the relative percentage of Nanog+ colonies to the value of the number of colonies generated with HUVEC or BJ fibroblasts cells infected with pLVTHM lentiviruses or GFP-expressing retroviruses correspondingly is shown.
Plasmid construction
The reprogramming plasmids pMX-OCT4, pMX-SOX2, pMX-KLF4, pMX-cMyc together with pLVTHM were obtained from Addgene (plasmids 17217, 17218, 17219, 17220 and 12247 respectively). For the construction of pMX-NTRK3, pMX-FAIM3, pMX-POLR1C, pMX-GDF3 and pMX-HK1 (fragment corresponding to the nucleotides 277-2753), specific coding region sequences were amplified by PCR from Human ORFeome library plasmids containing the corresponding cDNAs. cDNA fragments were digested with adequate restriction enzymes, purified and subcloned into linearized pMX plasmid. For the construction of CCKBR, SAMD3, UBA2, TRAF6,
MARCKSL1, CD1B, GSG1, NRP1, NEK11, CTSL1, pMX-ASB3 and pMX-ZNF16, specific pDONR223 plasmids from Human ORFeome library containing the corresponding cDNAs were used to transfer the cDNAs to the vector pMX-GW (Addgene, 18656). The transfer was achieved by using the Gateway LR Clonase enzyme mix (Invitrogen). The plasmids pMX-p16, pMX-CDK4, pMX-CycD1, pLVTHM-CycE and pLVTHM-p53 were generated as described24, 25. The plasmid pMX-RFP was kindly provided by Dr. Guanghui Liu (Gene Expression Laboratory, The SALK Insitute, La Jolla, CA). For the introduction of specific point mutations in the coding sequences of the above genes (see Supplementary Table S2 for specific mutations) the QuickChange Site-Directed Mutagenesis kit was used (Stratagene; see Supplementary Table S3 for specific primers). For the generation of plasmids encoding shRNAs against the genes used in this study, specific oligos (see Supplementary Table S3 for specific primers) were annealed, phosphorylated with T4 kinase and ligated into MluI/ClaI-linearized pLTVHM plasmid. The design of 3 different pairs of shRNAs was carried out using the SFold software (http:// sfold.wadsworth.org/) and knockdown efficiency was assayed in 293T cells. The most efficient pairs of shRNAs were assayed in HUVEC or BJ fibroblasts cell (Supplementary Fig. S1a) and used in the corresponding experiments. All constructs generated were subjected to direct sequencing to rule out the presence of mutations.
Retroviral and lentiviral production
Moloney-based retroviral vectors (pMX and derived) and second generation lentiviral vectors (pLVTHM and derived) were co-transfected with packaging plasmids to generate viral particles in 293T cells using Lipofectamine (Invitrogen) as previously described24.
Author Manuscript
Author Manuscript
Author Manuscript
Immunostaining
Imnunofluorescence analysis for the detection of pluripotent markers in hiPSCs or for the detection of differentiation-associated markers in teratomas were performed as described22. Immunohistochemical/immunoflorescence detection of Nanog or Tra-1-60 was performed as described24.
RNA isolation and real time-PCR analysis
Total RNA was isolated using Trizol Reagent (Invitrogen) according to the manufacturer’s recommendations. cDNA was synthesized using the SuperScript II Reverse Transcriptase kit for RT-PCR (Invitrogen) or the RT Supermix M-MuLV kit (BioPioneer). Real-time PCR was performed using the SYBR-Green PCR Master mix (Applied Biosystems) in the ViiA 7 Real Time PCR System (Applied Biosystems). GAPDH expression was used to normalize values of gene expression and data is shown as fold change relative to the value of the sample control. All the samples were done in triplicate. Primers used for real time-PCR experiments are listed in Supplementary Table S3.
Whole genome library construction
Library construction was performed as previously described6, 26. Briefly, for each sample, roughly 1.5 to 3 μg of genomic DNA (in 100 μl volumes) was sheared with a Covaris AFA. The fragmented genomic DNA was end repaired, A-tailed, and ligated to sequencing adaptors, with a purification step between each process. The purified ligated products were then amplified by PCR to generate whole-genome libraries.
In-Solution Hybridization capture with DNA baits
Liquid exome capture was performed as previously described6. Consensus sequence generation and variant calling
Variant calling was performed as previously described6. Briefly, reads obtained from the Illumina Genome Analyzer were post-processed and quality filtered using GERALD, mapped to the genome using BWA, downsampled using Picard, and used to generate a consensus sequence for each sample using GATK. The consensus sequences were then compared to find candidate novel mutations in hiPSCs6. Sites where each hiPSC line showed heterozygous SNPs not observed in the progenitor line were considered as candidate mutations if no allelic content was present in the somatic progenitor and if the candidate mutation had not previously been observed in other samples or the dbSNP database. Sanger validation of candidate mutations
Genomic DNA of both the hiPSC line and its somatic progenitor (6 ng each) was amplified in separate 50 μl PCR reactions with 100 nM of specifically designed forward and reverse primers around the mutation site (primers available under request) and 25 μl of Taq 2x master mix (NEB) at 94 °C for 2 minutes, followed by 35 cycles of 94 °C for 30 seconds; 57 °C for 30 seconds; and 72 °C for 30 seconds, and final extension at 72 °C for 3 minutes. The PCR products were then purified with Qiagen Qiaquick columns, and 10 ng of purified
Author Manuscript
Author Manuscript
Author Manuscript
DNA was pre-mixed with 25 pmol of the forward primer for Sanger sequencing at Genewiz Inc.
Statistical Analysis/TiGER Database
To check for enrichment of reprogramming-associated mutations in genes that are expressed in a tissue-specific manner, the fraction of UniGene IDs corresponding to mutated genes called as “tissue-specific” in the TiGER database was identified as 49/132 (37%). As 6,699/19,526 (34%) of the genes annotated in the TiGER database are considered to be tissue-specific, a χ2 test with one degree of freedom can be used to test for equivalency of distribution. The obtained χ2 value is 0.460, indicating that the fraction of mutated hiPSC genes that are tissue-specific is not significantly different than that found in a random sample of genes (P-value = 0.4975). Reprogramming-associated mutations therefore do not appear to be enriched in tissue-specific genes.
Statistical Analysis/Active and Inactive Chromatin States
To check for enrichment of reprogramming-associated mutations in active or inactive chromatin, we utilized a χ2 test with three degrees of freedom to test for equivalency of distribution. We identified the chromatin state of each mutated gene using previously published data13. This data divided each gene into one of four categories: no trimethylation, H3K4 Trimethylation, H3K27 Trimethylation, or both. We compared the distribution of mutated genes across each of these four categories with the expected distribution for all genes in three cell types: Fibroblasts, ESCs, and iPSCs13. The obtained χ2 values were 1.03 (p-value=0.79), 3.78 (p-value=0.29), and 6.97 (p-value=0.07), respectively, indicating that the distribution of mutated hiPSC genes in each chromatin region is not significantly different than expected by random chance (alpha=0.01). Reprogramming-associated mutations therefore do not appear to be enriched in active or inactive chromatin states. Non-coding versus Coding mutations
To compare the mutation rates per base pair in coding and non-coding regions of the genome, variant calling was performed as above on non-coding regions of the genome surviving library enrichment in eight hiPSC lines and their progenitor lines. The mutation rate per base pair was then estimated by dividing the number of candidate coding and non-coding mutations by the number of exomic and non-non-coding base pairs covered. The average coding and non-coding mutation rates were compared.
Supplementary Material
Refer to Web version on PubMed Central for supplementary material.
Acknowledgments
We express our gratitude to Travis Berggren, Margaret Lutz and Veronica Modesto for their support at the Salk Institute-Stem Cell Core, to Joaquin Sebastian for critically reading the manuscript, to Guanghui Liu for sharing reagents and to the rest of the Belmonte lab. AG was supported by the Focht-Powell Fellowship and a CIRM predoctoral fellowship. Work in this manuscript was supported by grants from Fundacion Cellex, TERCEL-ISCIII-MINECO, Sanofi, National Institutes of Health and the G. Harold and Leila Y. Mathers Charitable Foundation.
Author Manuscript
Author Manuscript
Author Manuscript
References
1. Takahashi K, et al. Induction of pluripotent stem cells from adult human fibroblasts by defined factors. Cell. 2007; 131:861–872. [PubMed: 18035408]
2. Yu J, et al. Induced pluripotent stem cell lines derived from human somatic cells. Science. 2007; 318:1917–1920. [PubMed: 18029452]
3. Lowry WE, et al. Generation of human induced pluripotent stem cells from dermal fibroblasts. Proc Natl Acad Sci. 2008; 105:2883–2888. [PubMed: 18287077]
4. Meissner A, Wernig M, Jaenisch R. Direct reprogramming of genetically unmodified fibroblasts into pluripotent stem cells. Nat Biotechnol. 2007; 25:1177–1181. [PubMed: 17724450]
5. Park IH, et al. Reprogramming of human somatic cells to pluripotency with defined factors. Nature. 2008; 451:141–146. [PubMed: 18157115]
6. Gore A, et al. Somatic coding mutations in induced pluripotent stem cells. Nature. 2011; 471:63–67. [PubMed: 21368825]
7. Hussein SMI, et al. Copy number variation and selection during reprogramming to pluripotency. Nature. 2011; 471:58–62. [PubMed: 21368824]
8. Mayshar Y, et al. Identification and classification of chromosomal aberrations in human induced pluripotent stem cells. Cell Stem Cell. 2010; 7:521–531. [PubMed: 20887957]
9. Lister R, et al. Hotspots of aberrant epigenetic reprogramming in human induced pluripotent stem cells. Nature. 2011; 471:86–73.
10. Laurent LC, et al. Dynamic changes in the copy number of pluripotency and cell proliferation genes in ESCs and iPSCs during reprogramming and time in culture. Cell Stem Cell. 2011; 8:106– 118. [PubMed: 21211785]
11. Ohi Y, et al. Incomplete DNA methylation underlies a transcriptional memory of somatic cells in human iPS cells. Nat Cell Biol. 2011; 13:541–549. [PubMed: 21499256]
12. Liu X, Yu X, Zack DJ, Zhu H, Qian J. TiGER: a database for tissue-specific gene expression and regulation. BMC Bioinformatics. 2008; 9:271. [PubMed: 18541026]
13. Guenther MG, et al. Chromatin Structure and Gene Expression Programs of Human Embryonic and Induced Pluripotent Stem Cells. Cell Stem Cell. 2010; 7:249–257. [PubMed: 20682450] 14. Yamanaka S. Elite and stochastic models for induced pluripotent stem cell generation. Nature.
2009; 460:49–52. [PubMed: 19571877]
15. Feng Q, et al. Hemangioblastic derivatives from human induced pluripotent stem cells exhibit limited expansion and early senescence. Stem Cells. 2010; 28:704–712. [PubMed: 20155819] 16. Hu BY, et al. Neural differentiation of human induced pluripotent stem cells follows
developmental principles but with variable potency. Proc Natl Acad Sci U S A. 2010; 107:4335– 4340. [PubMed: 20160098]
17. Miura K, et al. Variation in the safety of induced pluripotent stem cell lines. Nat Biotechnol. 2009; 27:743–745. [PubMed: 19590502]
18. Cheng L, et al. Low incidence of DNA sequence variation in human induced pluripotent stem cells generated by nonintegrating plasmid expression. Cell Stem Cell. 2012; 10:337–44. [PubMed: 22385660]
19. Young MA, et al. Background mutations in parental cells account for most of the genetic heterogeneity of induced pluripotent stem cells. Cell Stem Cell. 2012; 10:570–82. [PubMed: 22542160]
20. Kim JB, et al. Direct reprogramming of human neural stem cells by OCT4. Nature. 2009; 461:649– 643. [PubMed: 19718018]
21. Panopoulos AD, et al. Rapid and highly efficient generation of induced pluripotent stem cells from human umbilical vein endothelial cells. Plos One. 2011; 6(5):e19743. [PubMed: 21603572] 22. Ruiz S, et al. High efficient generation of induced pluripotent stem cells from astrocytes. Plos One.
2010; 5(12):e15526. [PubMed: 21170306]
23. Aasen T, et al. Efficient and rapid generation of induced pluripotent stem cells from human keratinocytes. Nat Biotechnol. 2008; 26:1276–1284. [PubMed: 18931654]
Author Manuscript
Author Manuscript
Author Manuscript
24. Ruiz S, et al. A high proliferation rate is required for somatic cell reprogramming and maintenance of human embryonic stem cell identity. Current Biology. 2010; 21:45–52. [PubMed: 21167714] 25. Kawamura T, et al. Linking the p53 tumour suppressor pathway to somatic cell reprogramming.
Nature. 2009; 460:1140–1144. [PubMed: 19668186]
26. Quail MA, Swerdlow H, Turner DJ. Improved protocols for the illumina genome analyzer sequencing system. Curr Protoc Hum Genet. 2009; Chapter 18(Unit 18):12.
Author Manuscript
Author Manuscript
Author Manuscript
Figure 1. Mutated alleles are expressed in hiPSC lines
Sanger chromatograms showing the results of RNA Sequencing analysis performed on the indicated genes found mutated in the indicated hiPSC lines. Dashed lines highlight the point-mutated nucleotide. Note the expression of both reference and mutated alleles in all cases analyzed.
Author Manuscript
Author Manuscript
Author Manuscript
Figure 2. Evaluation of the functional effect of hiPSC mutations on reprogramming efficiency
(a, b) Human BJ fibroblasts were infected with retroviruses encoding OSKC, and either lentiviruses encoding shRNAs against the indicated proteins (a) or retroviruses encoding the wild type or mutated proteins (b). Relative reprogramming efficiencies (evaluated as percentage of Nanog+ colonies) are shown as fold change normalized to the averaged efficiency observed in pLVTHM (a) or pMX-GFP (b) infected fibroblasts. In (a) lentiviruses encoding shRNAs against CycE1 or p53 were used as controls of reduced or increased reprogramming efficiency, respectively. In (b) retroviruses encoding p16 or the pair CDK4/CycD1 were used as controls of reduced or increased reprogramming efficiency, respectively. For (a), 20,000 infected cells were plated when shRNAs against POLR1C and
Author Manuscript
Author Manuscript
Author Manuscript
p53 were used and 70,000 infected cells were plated under all other conditions. For (b), a total of 25,000 infected cells were plated under all conditions. Two independent experiments with two biological replicates were carried out. All error bars depict the standard deviation.
Author Manuscript
Author Manuscript
Author Manuscript
Figure 3. Retroviral silencing or wild-type/mutant gene ratio do not alter reprogramming efficiency
(a) HUVEC cells were infected with retroviruses encoding OSKC, and a similar total amount of retroviruses encoding only the wild type form or both, the wild-type (wt) and mutant (mut) forms of the protein in an equal proportion. (b) HUVEC cells were infected with retroviruses encoding OSKC, red fluorescence protein (RFP) and the wild type or mutated forms of the genes indicated. Relative reprogramming efficiencies (evaluated as percentage of Tra-1-60+ colonies) are shown as fold change normalized to the averaged efficiency observed in GFP-infected HUVECs. 10,000 infected cells were plated under all the conditions. Two independent experiments with two biological replicates were carried out. All error bars depict the standard deviation.
Author Manuscript
Author Manuscript
Author Manuscript
Author Manuscript
Author Manuscript
Author Manuscript
Author Manuscript
Table 1
List of protein-coding mutations in hiPSC lines
Sample Chrom. Position Gene Alleles Protein Change Mutation Type
SIFT Functional Prediction
Mutated in Cancer? ASThiPS4F4 6 31783527 LY6G6F GAC-GAt D122D Synonymous N/A Yes ASThiPS4F4 8 68087821 LRRC67 CTT-aTT L121I Nonsynonymous TOLERATED No ASThiPS4F5 11 54891946 OR4A15 CTG-CcG L4P Nonsynonymous DAMAGING No ASThiPS4F5 13 110343392 ANKRD10 AAG-AAt K225N Nonsynonymous TOLERATED Yes KhiPS4F8 1 205153901 FAIM3 TTC-aTC F67I Nonsynonymous DAMAGING Yes KhiPS4F8 5 121215932 FTMT CAC-CAt H125H Synonymous N/A Yes KhiPS4F8 14 62486817 KCNH5 GAC-aAC D386N Nonsynonymous TOLERATED No NSChiPS2F 5 79774746 ZFYVE16 TCT-TaT S823Y Nonsynonymous DAMAGING No NSChiPS2F 12 54853783 SMARCC2 CCA-CCg P538P Synonymous N/A Yes HUVhiPS4F1 2 169809670 LRP2 TCG-TtG S1070L Nonsynonymous TOLERATED Yes HUVhiPS4F1 10 33542444 NRP1 GGC-GaC G497D Nonsynonymous DAMAGING No HUVhiPS4F1 16 17139792 XYLT1 AAG-AgG K562R Nonsynonymous TOLERATED No HUVhiPS4F1 4 155376303 DCHS2 GGA-GtA G2529V Nonsynonymous DAMAGING No HUVhiPS4F3 6 155183150 RBM16 GTA-cTA V595L Nonsynonymous TOLERATED No HUVhiPS4F3 9 394921 DOCK8 TCA-aCA S1012T Nonsynonymous TOLERATED Yes HUVhiPS4F3 X 109889590 CHRDL1 CTT-aTT L86I Nonsynonymous TOLERATED No HUVhiPS4F3 19 7475243 C19orf45 TCA-TaA S229* Nonsense N/A Yes MSChiPS4F4 1 35998698 CLSPN GTG-tTG V471L Nonsynonymous TOLERATED Yes MSChiPS4F4 1 153185686 PBXIP1 GAC-GgC D363G Nonsynonymous TOLERATED Yes MSChiPS4F4 2 154960801 GALNT13 GAA-GAg E403E Synonymous N/A Yes MSChiPS4F4 5 126704124 MEGF10 GTC-GTg V74V Synonymous N/A Yes MSChiPS4F4 6 130572400 SAMD3 ATG-tTG M106L Nonsynonymous DAMAGING Yes MSChiPS4F4 10 42974297 CSGALNACT2 ATG-gTG M264V Nonsynonymous TOLERATED Yes MSChiPS4F4 11 36473107 TRAF6 GAA-aAA E225K Nonsynonymous DAMAGING Yes MSChiPS4F4 17 50475673 STXBP4 GTA-GTg V236V Synonymous N/A Yes MSChiPS4F4 19 40938581 HSPB6 TCGCCG-TCatCG S84S P85S Synonymous Nonsynonymous N/A DAMAGING No MSChiPS4F4 20 46706999 PREX1 GCC-GCt A703A Synonymous N/A Yes MSChiPS4F4 21 39493296 BRWD1 AAA-AtA K1639I Nonsynonymous DAMAGING Yes
Author Manuscript
Author Manuscript
Author Manuscript
Author Manuscript
Sample Chrom. Position Gene Alleles Protein Change Mutation TypeSIFT Functional Prediction
Mutated in Cancer? MSChiPS4F4 X 11688927 MSL3 TCT-TtT S111F Nonsynonymous DAMAGING Yes MSChiPS4F8 1 39703363 MACF1 GGC-tGC G5698C Nonsynonymous DAMAGING Yes MSChiPS4F8 1 158594563 NCSTN TTG-cTG L670L Synonymous N/A No MSChiPS4F8 1 231873806 KCNK1 GAC-GAt D224D Synonymous N/A Yes MSChiPS4F8 2 21087987 APOB CAC-CgC H1753R Nonsynonymous DAMAGING Yes MSChiPS4F8 2 234287122 UGT1A8 GTC-GaC V249D Nonsynonymous N/A Yes MSChiPS4F8 5 128390915 SLC27A6 GAC-GAa D482E Nonsynonymous DAMAGING No MSChiPS4F8 8 16079769 MSR1 CCG-tCG P34S Nonsynonymous TOLERATED Yes MSChiPS4F8 9 125834763 LHX2 GAG-tAG E393* Nonsynonymous N/A No MSChiPS4F8 14 46496570 MDGA2 TTG-aTG L318M Nonsynonymous TOLERATED Yes MSChiPS4F8 15 37669438 THBS1 TGC-TGt C689C Synonymous N/A Yes MSChiPS4F8 X 152498688 ATP2B3 TCC-TaC S1134Y Nonsynonymous DAMAGING Yes
Author Manuscript
Author Manuscript
Author Manuscript
Author Manuscript
Table 2
List of candidate non-coding mutations in hiPSC lines. The mutation rate per base pair was similar for exonic and non-exonic regions.
Cell Line
Noncoding Mutations
Exon Mutation Rate (per bp)
Non-exon Mutation Rate (per bp)
Chromosome Position Mutation ASThiPS4F4 9 111225067 C -> T 8.0E-08 6.2E-08 11 64089233 G -> T 13 38444609 C -> T ASThiPS4F5 2 114429763 A -> T 8.0E-08 1.0E-07 12 55133583 G -> T 16 2290223 G -> T 17 40078501 C -> T FiPS3F1 5 149190453 C -> A 1.6E-07 1.6E-07 9 5175241 C -> T 10 45274877 G -> T 11 85134161 T -> C 19 48465587 C -> A FiPS4F7 1 171784008 C -> A 1.2E-07 1.3E-07 2 116251932 C -> A 2 189575154 C -> A 9 98839743 G -> A HUVhiPS4F1 11 17069813 G -> A 1.6E-07 7.2E-08 19 21056778 G -> A HUVhiPS4F3 2 102515666 G -> T 1.6E-07 1.1E-07 11 12908191 G -> T 15 25902050 G -> A 22 18130926 C -> T KhiPS4F8 5 96143123 C -> T 1.2E-07 1.8E-07 9 122778753 A -> T
Author Manuscript
Author Manuscript
Author Manuscript
Author Manuscript
Cell Line Noncoding MutationsExon Mutation Rate (per bp)
Non-exon Mutation Rate (per bp)
Chromosome Position Mutation 10 85962168 C -> G 17 71457091 T -> C NSChiPS2F 5 110120401 G -> T 8.0E-08 1.2E-07 9 115077723 C -> T 9 127398270 C -> T 11 9457743 T -> A 19 46045755 T -> G MSChiPS4F4 1 6092988 C -> G 4.8E-07 4.2E-07 2 88885962 C -> T 2 230820856 T -> C 3 51088015 G -> T 4 67994660 T -> A 4 156930655 C -> A 5 156683693 G -> C 6 73887041 C -> T 6 129865735 A -> G 8 24379410 T -> A 10 94807938 T -> C 10 100179495 G -> A 14 104534424 G -> A 15 61826051 G -> A 18 9551942 C -> T X 70543403 T -> C X 152791107 A -> T MSChiPS4F8 1 39703363 G -> T 4.4E-07 6.5E-07 1 46422702 G -> C 1 74608556 C -> A 1 85589993 A -> G 2 88885962 C -> T
Author Manuscript
Author Manuscript
Author Manuscript
Author Manuscript
Cell Line Noncoding MutationsExon Mutation Rate (per bp)
Non-exon Mutation Rate (per bp)
Chromosome Position Mutation 2 128062632 A -> T 3 12183849 G -> A 4 3200574 C -> T 4 95415046 A -> G 4 144675426 G -> T 6 37430075 G -> T 6 90653308 G -> T 6 134570140 T -> C 7 37123316 T -> C 7 117661660 A -> C 9 15258029 C -> G 9 132317600 C -> G 14 29171707 C -> A 14 73445929 C -> G 16 20968574 C -> T 16 34177914 C -> T 17 7778980 G -> A 17 62783815 G -> A 18 6877390 C -> T 19 43784039 C -> A X 138470822 G -> A AVERAGE 1.9E-07 2.0E-07