Accepted Manuscript
Acute phase proteins and IP-10 as triage tests for the diagnosis of tuberculosis: a systematic review and meta-analysis
Victor S. Santos, Delia Goletti, Konstantina Kontogianni, Emily R. Adams, Barbara Molina-Moya, Jose Dominguez, Valeriu Crudu, Paulo R.S. Martins-Filho, Morten Ruhwald, Lovett Lawson, John S. Bimba, Alberto L. Garcia-Bastero, Linda Petrone, Basir S. Kabeer, Klaus Reither, Luis E. Cuevas
PII: S1198-743X(18)30535-4
DOI: 10.1016/j.cmi.2018.07.017 Reference: CMI 1387
To appear in: Clinical Microbiology and Infection
Received Date: 9 April 2018 Revised Date: 26 June 2018 Accepted Date: 18 July 2018
Please cite this article as: Santos VS, Goletti D, Kontogianni K, Adams ER, Molina-Moya B, Dominguez J, Crudu V, Martins-Filho PRS, Ruhwald M, Lawson L, Bimba JS, Garcia-Bastero AL, Petrone L, Kabeer BS, Reither K, Cuevas LE, Acute phase proteins and IP-10 as triage tests for the diagnosis of tuberculosis: a systematic review and meta-analysis, Clinical Microbiology and Infection (2018), doi: 10.1016/j.cmi.2018.07.017.
This is a PDF file of an unedited manuscript that has been accepted for publication. As a service to our customers we are providing this early version of the manuscript. The manuscript will undergo copyediting, typesetting, and review of the resulting proof before it is published in its final form. Please note that during the production process errors may be discovered which could affect the content, and all legal disclaimers that apply to the journal pertain.
M
AN
US
CR
IP
T
AC
CE
PT
ED
ACCEPTED MANUSCRIPT
Acute phase proteins and IP-10 as triage tests for the diagnosis of tuberculosis: a systematic review and meta-analysis
Victor S. Santos1 Delia Goletti2 Konstantina Kontogianni3 Emily R. Adams3 Barbara Molina-Moya4 Jose Dominguez4 Valeriu Crudu5 Paulo R. S. Martins-Filho6 Morten Ruhwald7 Lovett Lawson8 John S Bimba8 Alberto L Garcia-Bastero9 Linda Petrone2 Basir S. Kabeer2 Klaus Reither10 Luis E. Cuevas3
1 Centre for Epidemiology and Public Health. Federal University of Alagoas, Arapiraca,
Brazil.
2 Department of Clinical and Clinical Research, "L. Spallanzani" National Institute for
Infectious Diseases (INMI), IRCCS, Rome, Italy.
3 Liverpool School of Tropical Medicine, Liverpool, United Kingdom.
4 Servei de Microbiologia, Hospital Universitari Germans Trias i Pujol, Institut d'Investigació
Germans Trias i Pujol, Universitat Autònoma de Barcelona, Carretera del Canyet s/n, 08916, Badalona, Spain.
M
AN
US
CR
IP
T
AC
CE
PT
ED
ACCEPTED MANUSCRIPT
5 National TB Reference Laboratory, Phthisiopneumology Institute "Chiril Draganiuc",
Chişinău, Republic of Moldova.
6 Investigative Pathology Laboratory. Federal University of Sergipe, Aracaju, Brazil.
7 Center for vaccine Research, Statens Serum Institut, Copenhagen, Denmark.
8 Zankli research laboratory, Bingham University. Nassarawa State, Nigeria.
9 Centro de Investigação em Saude de Manhiça (CISM). Rua 12, Cambeve CP 1929,
Maputo, Mozambique. Amsterdam Institute for Global Health (AIGHD), Amsterdam, The Netherlands and Barcelona Institute for Global Health (ISGLobal), Barcelona, Spain.
10 Swiss Tropical and Public Health Institute, Basel, Switzerland.
Running title: C-RP and IP-10 as markers for active TB
Key words: tuberculosis, screening, acute phase proteins, IP-10, systematic review
Corresponding author: Luis E. Cuevas, Liverpool School of Tropical Medicine, Pembroke
M
AN
US
CR
IP
T
AC
CE
PT
ED
ACCEPTED MANUSCRIPT
Abstract ObjectivesWe examined the data reported in studies for diagnostic purposes and discuss whether their intended use could be extended to triage, as rule in or rule out tests to select individuals who should undergo further confirmatory tests.
Methods
We searched SCOPUS, PubMed and Web of Science with the terms “acute-phase-proteins”, “IP-10”, “tuberculosis”, “screening” and “diagnosis”, extracted the sensitivity and specificity of the biomarkers and explored methodological differences to explain performance variations. Summary estimates were calculated using random-effects models for overall pooled accuracy. Hierarchical Summary Receiver Operating Characteristic (HSROC) model was used for meta-analysis.
Results
We identified 14, four and one studies for C-reactive protein (C-RP), Interferon-γ
-induced-protein-10 (IP-10) and α-1-acid glycoprotein (A1AG). The pooled C-RP sensitivity/specificity
(95%CI) was 89% (80%-96%) and 57% (36%-65%). Sensitivity/specificity were higher in high TB-burden countries (90%/64%), HIV-infected individuals (91%/61%) and community-based studies (90%/62%). IP-10 sensitivity/specificity in TB vs Non-TB studies was
85%/63% and in TB and HIV co-infected vs other lung conditions 94%/21%. However, IP-10 studies included diverse populations and a high risk of bias resulting in very low quality evidence. A1AG had 86%/93% sensitivity/specificity.
Conclusion
Few studies have evaluated C-RP, IP-10 and A1AG for the triage of symptomatic patients. Their high sensitivity and moderate specificity warrant further prospective studies exploring whether their combined use could optimise performance.
M
AN
US
CR
IP
T
AC
CE
PT
ED
ACCEPTED MANUSCRIPT
IntroductionTuberculosis (TB) causes an estimated 1.7 million deaths and 10.4 million incident cases per year [1]. Despite its public health burden, nearly one third of the estimated cases are missed by national surveillance systems, suggesting that many cases fail to reach the health
services. TB mortality is higher in patients with a late diagnosis, advanced disease stages and co-infection with HIV, and strategies which increase case detection and reach an early diagnosis are integral to the global strategy for the control of TB [2].
One of the major problems for the management of TB is the inefficiency of the diagnostic cascade. Diagnostic investigations are usually triggered after a patient has had cough for two or more weeks and the tests used are unsuitable for rapid and large-scale screening. The most frequently used tests, smear microscopy and Xpert MTB/RIF, are highly specific. However, smear microscopy has low sensitivity and is technically unsuitable as a screening tool, and Xpert MTB/RIF and X-Rays require an infrastructure that is rarely available at peripheral diagnostic centres. It is recognised that diagnostic algorithms could be improved with the use of triage tests that select patients requiring further confirmatory tests and exclude patients unlikely to have TB [3]. The World Health Organization has included, among the high priority target product profiles (TPP) for TB diagnosis, a non-sputum-based triage test, which, under ideal conditions, would require sensitivity ≥95% and specificity
>75% [4]. However, early promising prototypes for triage, such as a Beta Lactamase C assay[5], failed to reach the production stages and the pipeline for these tests has very few candidates [6].
Serum levels of acute phase proteins (APPs) and cytokines are increased in individuals with TB. Among these, C-reactive protein (C-RP) is often used in clinical practise as an adjuvant test for diagnosis (especially in children) [7] and interferon gamma-induced protein 10 (IP-10) may have potential to monitor treatment responses to anti-TB therapy [7–9]. Despite their frequent use for diagnosis, they are rarely used as triage tests and their use for these different purposes require different performance characteristics. Cut offs or thresholds for a test for diagnostic purposes are defined to achieve a high accuracy and use the best
M
AN
US
CR
IP
T
AC
CE
PT
ED
ACCEPTED MANUSCRIPT
combination of sensitivity and specificity whereas triage tests require high sensitivity, to identify as many cases as possible, often at the expense of lower specificity.
There is renewed interest to explore whether APPs and cytokines could be used as triage tests for TB. As few studies have considered using APPs and IP-10 for screening purposes, we examined the data reported in studies for diagnostic purposes and discuss whether their intended use could be extended to triage, as rule in or rule out tests to select individuals who should undergo further confirmatory tests.
Methods
This study was conducted following the Cochrane Collaboration’s Diagnosis Test Accuracy Working Group protocol. Institutional review board approval and informed consent was not required for this systematic review and meta-analysis. A study protocol was designed a priori and was registered in the PROSPERO database (registration number CRD42018087015). We reported our findings according to Preferred Reporting Items for Systematic Reviews and Meta-Analysis (PRISMA) guidelines.
Search strategy and selection criteria
We performed a systematic review using SCOPUS, PubMed and Web of Science databases to identify studies published without language restriction up to October 14, 2017. We used the search terms “acute phase proteins”, “IP-10”, “tuberculosis”, “screening”, “diagnosis” and related terms. The full search strategy is described in the Appendix. Two independent review authors (VSS and KK) screened the title and abstract for relevance and a third review author (LEC) was consulted to resolve disagreements. Articles considered to have original material were obtained and assessed in detail and the references cited in these publications were searched to identify further publications.
We included studies that met the following conditions: (1) The study used quantitative laboratory-based and/or point-of-care assays to measure levels of at least one of APP (Alpha 1-antichymotrypsin, Alpha 1-antitrypsin, Alpha 2-macroglobulin, Alpha-1-acid glycoprotein, Ceruloplasmin, Complement factors, C-reactive protein, Factor VIII, Ferritin, Fibrinogen, Haptoglobin, Hepcidin, Mannan-binding lectin, Orosomucoid, Plasminogen
M
AN
US
CR
IP
T
AC
CE
PT
ED
ACCEPTED MANUSCRIPT
activator inhibitor PAI-1, Prothrombin, Serum amyloid A, Serum amyloid P component and von Willebrand factor), or unstimulated 10 as an index test. We included unstimulated IP-10 because there is an extensive number of publications reporting its potential use for diagnosis. (2) The study enrolled symptomatic patients suspected of active pulmonary TB, and who ended up a proportion was confirmed as having PTB and another proportion as having other lung disease. (3) Cases had confirmed pulmonary tuberculosis based on solid and/or liquid sputum M. tuberculosis culture as the reference standard. (4) It reported cases in absolute numbers of true-positive, false- positive, false-negative, and true-negative results, or these data were derivable from the published results. Articles were included regardless of age (adults or children) or if they had co-infections (e.g. HIV).
We excluded studies that only reported stimulated IP-10 values, but the authors of these studies were asked to provide the non-stimulated baseline results if available (e.g. the Nil values of the Quantiferon assay) to prepare additional Receiver Operating Curves (ROC) for meta-analysis. Studies that focused on latent Mycobacterial tuberculosis infections, those who tested patients after initiation of treatment and those that used samples other than blood (e.g. pulmonary biopsies or pleural exudates) and case-control studies were excluded.
Data extraction and bias assessment
We predefined tables for data extraction, which were piloted in 10 articles. The information extracted included author, country, study design, clinical setting (hospital or community) participant characteristics, case definition for TB diagnosis, markers included, method of detection and the threshold used for each marker. We extracted the absolute numbers of true-positive, false-positive, false-negative and true-negative test results from the paper or through (re)calculations of the sensitivity and specificity based on the authors’ diagnostic classification of the participants and sample size of the study. If a study presented multiple cut-off values for an index test and, as consequence, reported multiple pairs of sensitivity and specificity, the data with the best combined estimates for sensitivity and specificity were extracted. Countries were classified as per the World Health Organization Burden of TB classification (WHO classification) [1] to describe the epidemiological context. The quality of
M
AN
US
CR
IP
T
AC
CE
PT
ED
ACCEPTED MANUSCRIPT
studies and the risk of bias were assessed by two independent reviewer authors using the QUADAS-2 guidelines as shown in the Material Supplementary. We used the RevMan software (version 5.3; Cochrane Collaboration) to generate the graphs on the risk of bias.
Statistical analysis
We used the sensitivity and specificity of the markers reported by the author or
(re)calculated them from the data presented. For diagnostic performance of C-RP, we fitted the Hierarchical Summary Receiver Operating Characteristic (HSROC) model proposed by Rutter and Gatsonis [10], which take into account correlation between sensitivity and specificity across studies while also allowing for variation in test performance between studies through the inclusion of random effects. We expected that the methods for measuring the markers and the cut-offs would vary across studies, and thus investigated potential methodological and assay differences to interpret variations in performance. An exploratory analysis to investigate potential factors of heterogeneity was performed by visual inspection of HSROC curves. Meta-regression was conducted by adding these factors as covariates to the hierarchical model [11]. The characteristics explored were the WHO TB burden classification of the country where the study took place (high-burden vs others), HIV status (positive vs negative), clinical settings (hospitalized vs community) and method for C-RP quantification. Publication bias was examined using the effective sample size funnel plot and associated regression test of asymmetry described by Deeks and colleagues [12]. For IP-10, as few studies were available, the diagnostic performance was analysed by modelling the trade-off between sensitivity and specificity using the Moses SROC regression [13,14].
For all analyses Two-sided p < 0.05 values were considered statistically significant.
Statistical analyses were performed using the R statistical programming language (version 2.10.13; R Core Team, 2013) and STATA (version 14; Stata Corp LP).
Role of the funding source
The funder of the study had no role in study design, data collection, data analysis, data interpretation, or writing of the article.
M
AN
US
CR
IP
T
AC
CE
PT
ED
ACCEPTED MANUSCRIPT
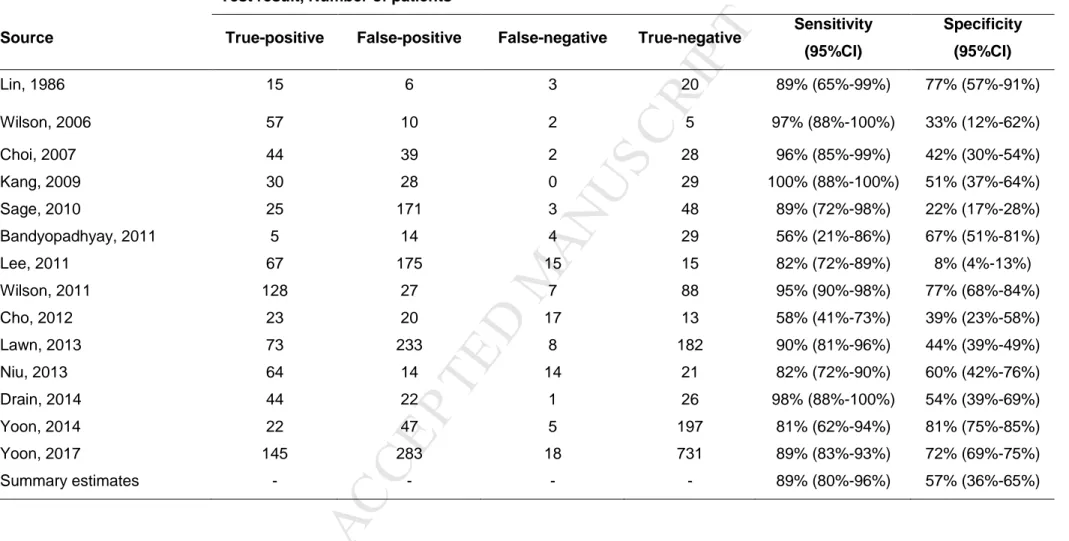
ResultsThe search strategy identified 891 records. After screening titles and abstracts, 104 full-text articles were assessed for eligibility and 19 were included (Figure 1). C-RP was reported in 14 studies [15–28], IP-10 in four [29–32] and alpha-1-acid glycoprotein[33] in one. Table 1 summarize the main characteristics of each study.
C-reactive protein
Six of the 14 studies reporting C-RP sensitivity and specificity included only HIV-infected individuals [16,19,24,26–28], four only HIV-uninfected [17,21,23,25], two both HIV-infected and HIV-uninfected patients [20,22] and in two studies the HIV status was not described [15,18]. Nine studies were conducted in high TB burden countries [15,16,20,22,24–28]. Nine studies enrolled patients in community settings [15,17,18,22,24–28], five enrolled
hospitalized patients [16,19–21,23]. All studies focused on adults. Most studies used a 10 mg/dl cut-off point (Table 1).
The quality of the studies and the risk of bias are shown in appendix (see Supplementary eFigures 1 and 2). The QUADAS-2 tool showed that the studies that enrolled patients in the community had a lower risk of bias than studies enrolling hospitalized patients. Most studies enrolling community individuals were designed to evaluate the diagnostic accuracy of C-RP for TB and enrolled a representative spectrum of patients, whereas hospital studies did not provide sufficient information to determine the patient selection method and unclear blinding for the interpretation of results, which are potential sources of bias.
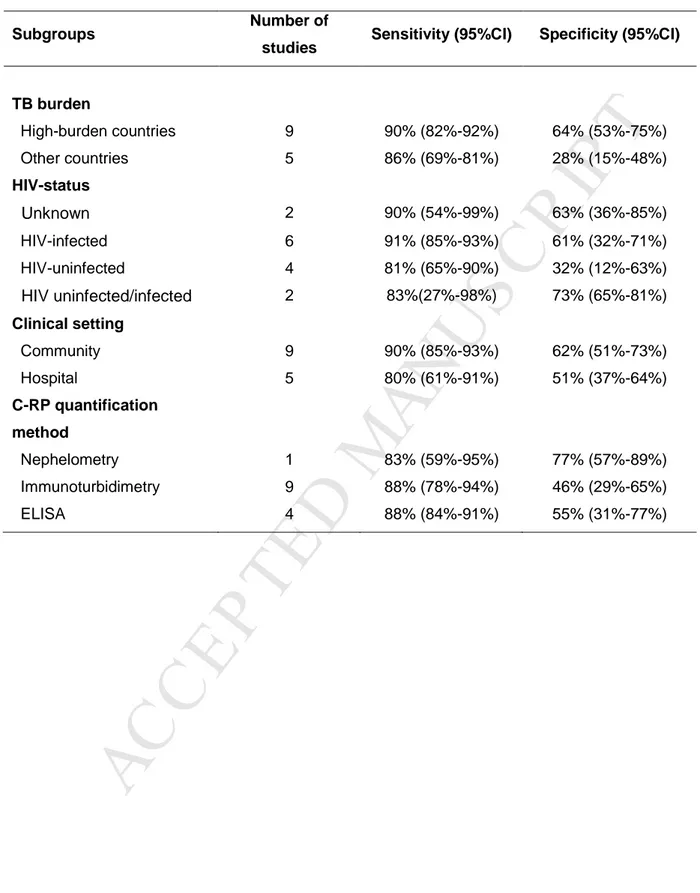
The overall (95%CI) pooled sensitivity of C-RP was 89% (80%-96%) with a pooled (95%CI) specificity of 57% (36%-65%) (Table 2). The positive and negative likelihood ratio (95%CI) was 1.91 (1.42-2.56) and 0.21 (0.10-0.43), respectively (See Supplementary eTable 1 and 2). The summary dOR (95%CI) was 8.27 (3.40-20.00) (See Supplementary eTable 3). The HSROC curve for RP is shown in Figure 2. Table 3 describes the sub-group analysis. C-RP had a higher pooled sensitivity and specificity (95%CI) in countries with high TB burden (90% [82%-92%] and 64% [53%-75%]), in HIV-infected patients (91% [85%-93%] and 61% [32%-71%]), and in community patients (90% [85%-93%] and 62% [51%-73%], respectively).
M
AN
US
CR
IP
T
AC
CE
PT
ED
ACCEPTED MANUSCRIPT
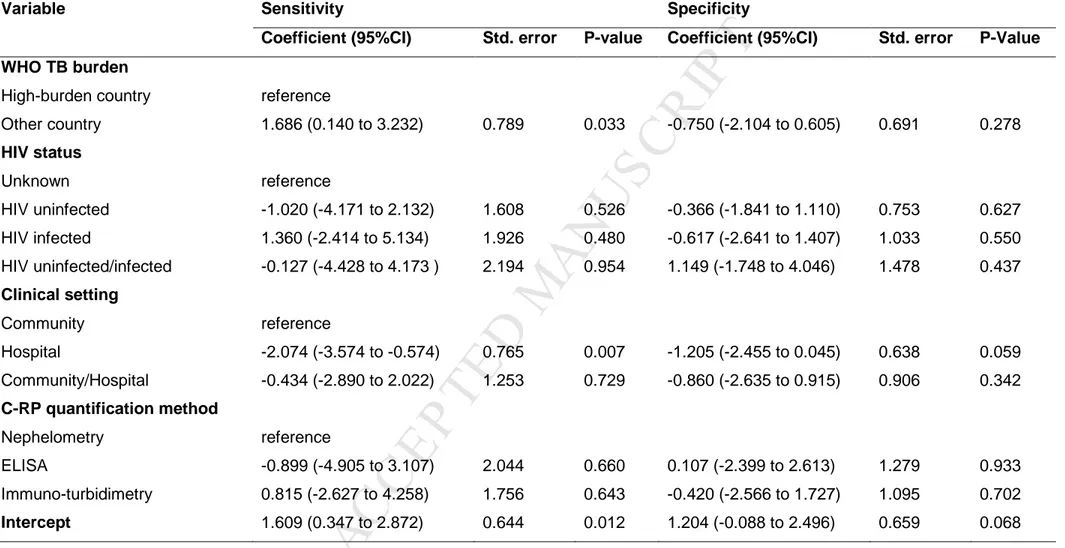
To investigate the potential sources for heterogeneity, we conducted a meta-regression analysis using the country TB burden, HIV status, clinical settings and C-RP assays. Of these, the most important source of heterogeneity was the clinical setting (Table 4). We also explored the performance for C-RP among HIV-infected patients from high TB burden countries. The pooled (95%CI) sensitivity for this group was 92% (89%-94%), with a pooled (95%CI) specificity of 66% (64%-68%).
No publication bias and high symmetry of the included studies were proved by Deeks’
funnel plot asymmetry test (P = 0.73; Figure 3).
IP-10
Unstimulated IP-10 values were obtained from four studies [29–32] (Table 1). One studies included HIV-uninfected individuals [29], two included both HIV-uninfected and HIV-infected patients [30,32] and in one the HIV status was unknown[31]. Three studies[29–31] were conducted in adults and only one in children [32]. All studies used culture positive from sputum as the reference standard for the confirmation of cases. There was a wide variation in the kits and thresholds used, and many studies did not report the cut-offs selected, which precluded further analysis.
Most of the studies did not enrol a representative spectrum of patients or failed to provide satisfactory information to determine the patient selection methods. Furthermore, the unblinded interpretation of results, the lack of a pre-specified cut-off thresholds and the different assays used were common sources of potential bias (See Supplementary Figures 6 and 7).
As the studies included a wide range of populations (often without matched groups), it was not possible to estimate pooled sensitivity and specificity across the studies. The
performance of unstimulated IP-10 test is thus presented for each group in Table 5. The pooled (95%CI) sensitivity and specificity to diagnose TB was 85% (77%-92%) and 63% (54%-71%), respectively. Studies comparing patients with TB and HIV co-infection and patients with other lung diseases had an estimated sensitivity of 94% (80%-99%) and
M
AN
US
CR
IP
T
AC
CE
PT
ED
ACCEPTED MANUSCRIPT
specificity of 21% (14%-29%). Summary diagnostic Odds Ratio (dOR): TB vs Non-TB, 13.19 (95% 2.28 to 76.27); TB HIV+ vs Non-TB HIV+, 3.11 (95% 0.79 to 12.26).
Alpha-1-acid glycoprotein
Only one study[33] reported data for alpha-1-acid glycoprotein was included. This study enrolled 21 patients with TB and 27 patients with bacterial pneumonia. The sensitivity and specificity (95%CI) were 86% (64%-95%) and 93% (75%-98%), respectively.
There were no studies describing the combined use of C-RP with IP-10 or Alpha-1-acid glycoprotein to explore whether using two or more of these markers would result in a higher sensitivity.
Discussion
It is estimated that nearly 4.1 million TB cases are missed annually worldwide[1] and increasing the accessibility of diagnostic and treatment services is essential for its effective control. Although sensitive and specific molecular diagnostics, such as Xpert MTB/RIF, are now available, these tests require well-established laboratory facilities and are relatively expensive for low income countries. Although National Programs are attempting to increase the use Xpert MTB/RIF as the first test for diagnosis of presumptive TB, patients attending primary health centres are mostly screened using smear microscopy or need to travel, or have their samples transported, to laboratories with Xpert MTB/RIF facilities. The goal of an accessible and efficient quality diagnosis therefore remains elusive and is one of the largest stumbling barriers for TB control.
Improved diagnostic algorithms able to triage patients to select individuals with a high or low probability of TB could optimise the use of limited resources of national programs. These approaches should be able to identify (rule in) individuals with a high risk of TB and rule out those who, despite their symptoms, have a low likelihood of TB. Triage approaches also need to be simple and rapid, without the need of complex platforms to facilitate
implementation in low resource settings.
Here we reviewed the potential of established APPs currently used as adjunct assays for the diagnosis of TB. APPs are proteins whose plasma concentrations increase or decrease
M
AN
US
CR
IP
T
AC
CE
PT
ED
ACCEPTED MANUSCRIPT
rapidly as an innate response to injury or local inflammation. C-RP for example, binds to bacterial and fungal cell walls and to phosphocholine in the surface of damaged human cells and a high concentration suggests the presence of bacterial infections. Although their
stimulation in response to a wide range of inflammatory processes would result in a low specificity, their high sensitivity and the maintenance of response integrity even in individuals with young age or the immunodeficiency of severe malnutrition and HIV, have resulted in their frequent use for the diagnosis and management of infection. Paradoxically, although APPs are included in many diagnostic algorithms for TB, especially in children, these markers are usually used in parallel with other tests and testing is rarely reported in a step-wise cascade for triage. This is a major limitation, as markers used for diagnosis are used in parallel with other tests, while screening tests are usually cascaded, with an emphasis on high sensitivity for selection of patients who should undergo more specific tests for confirmation.
The screening of TB among HIV-infected individuals is also particularly challenging. A recent systematic review of C-RP for the screening of TB in patients with HIV however, reported unexpectedly good results in this high-risk group [34].
Furthermore, although many studies have investigated IP-10 expression as a specific response to the in-vitro stimulation of white blood cells to specific TB antigens, few studies have reported its use in its steady – unstimulated – concentrations. Altered serum and/or tissue expression of IP-10 has been associated with inflammatory diseases, including organ-specific or systemic autoimmune diseases [35], neurological disorders [36], vascular
diseases [37,38],and viral and bacterial infections [39]. One previous meta-analysis [40] reported a pooled sensitivity and specificity of 73% and 82% for the diagnosis of TB. However, this study included data of both stimulated and unstimulated IP-10, patients with pleural effusions and compared patients with TB and healthy controls, which limited its interpretation. In the current study, we focused on non-stimulated (in the absence of in vitro TB antigens) IP-10 in patients with pulmonary TB and requested datasets from investigators to conduct a reanalysis with a triage perspective. Although the number of studies is small,
C-M
AN
US
CR
IP
T
AC
CE
PT
ED
ACCEPTED MANUSCRIPT
RP and IP-10 seem to have high sensitivity and moderate specificity as triage markers in patients with symptoms suggestive of active TB. Our data resulted in a C-RP pooled sensitivity and specificity of 89% and 57%, while the pooled sensitivity and specificity for IP-10 were 85% and 63%. Despite their low/moderate specificity, these performances would make them strong candidates for triage because, although they miss the TPP targets, their performance could potentially be improved by calculating optimal screening cut-offs in prospectively enrolled patients. Several semi-quantitative C-RP tests are also available in the market and their use as point of care devices for screening would increase the capacity of the health services to diagnose larger number of patients. IP-10 studies in turn, were judged to have a high risk of bias and high concern about applicability. Furthermore, the IP-10 studies included were considered to have a high risk of bias and thus the quality of evidence is very low at this stage.
Our findings therefore should be treated with caution as we faced important limitations. As expected, the performance of the markers varied with the burden of TB across settings, with a higher sensitivity and specificity in high burden countries. The higher sensitivity in these settings may reflect the late presentation of patients to health services and the higher frequency of co-morbidities, such as HIV, malaria and bacterial co-infections. The higher specificity may reflect the location used to enrol study participants, as most studies were based on TB diagnostic services, where the proportion of patients with TB would be higher than in general clinical services. Some studies also did not provide sufficient information to determine the patient selection method, with unclear blinding and some studies used
inappropriate patient exclusions with potential to introduce bias. Furthermore, although there was no limitation in the search for children, most the articles limited their analyses to adults, which fixed the interpretations of our findings to this age group. As much as possible, data included comparisons between patients with and without a diagnosis of TB. Our findings therefore reflect the investigator-selected cut-offs, usually decided retrospectively by observing the data, which limited our ability to establish an appropriate threshold for
M
AN
US
CR
IP
T
AC
CE
PT
ED
ACCEPTED MANUSCRIPT
explored. Although this biomarker could have similar potential as C-RP for triage, we could only find one publication that met the inclusion criteria.
The results of these studies can be modelled in an scenario where C-RP assays were to be used in a high TB prevalence setting in a group of 1000 individuals with symptoms
compatible with TB, where 200 (20%) are typically expected to have a positive TB culture (confirmed TB). In this scenario, the C-RP test would be followed by a confirmatory test (e.g. Xpert MTB/RIF) with an estimated 75% sensitivity and 98% specificity. In this scenario, an estimated 468 participants will have a positive C-RP result [180 true and 288 false positive) and 562 would have negative C-RP (512 true and 50 false negative). The follow on Xpert test among the 468 patients with positive C-RP would correctly identify 135 patients with confirmed TB and 6 patients with false positive results. The combination of C-RP followed by Xpert would then yield 926 (92.6%) patients correctly classified, of which 135 would have confirmed TB and 794 would not have confirmed TB (negative culture). In contrast, testing the same population with the routine Xpert MTB/RIF as the first test would result in 150/200 patients with TB being classified as having TB and 784/800 participants correctly classified as not having TB (culture negative. This would result in 934 (93.4%) patients correctly classified, of which 150 would have confirmed TB and 784 not to have confirmed TB (negative culture). Although the difference between the two approaches is not statistically significant, the screening test would result in significant gains by rapidly identifying 562 patients with a very low likelihood of having TB, facilitating earlier clinical management decisions and avoiding having to wait for Xpert test results and multiple visits.
Further prospective studies are needed to establish the optimal assays and thresholds for C-RP and/or unstimulated IP-10 for TB screening, and whether their combined use could increase their performance. Future studies should enrol prospectively consecutive patients with signs and symptoms of presumptive TB undergoing a differential diagnosis. In
conclusion, C-RP is a promising marker as a triage test to identify individuals with TB, while the evidence available for IP-10 is of very low quality and and further prospective studies are
M
AN
US
CR
IP
T
AC
CE
PT
ED
ACCEPTED MANUSCRIPT
warranted for both markers.
Funding: This research was funded by the European and Developing Countries Clinical
Trial Partnership (EDCTP), grant number DRIA2014-309 and its co-funders (Medical
Research Council (MRC) UK and Instituto de Salud Carlos III – ISCIII Spain) and by Ricerca Corrente, Ministero della salute; RF-2011-02349395. Morten Ruhwald receives funding from the European Commission H2020 program (grant number TBVAC2020 643381) and the Research Council Norway (GLOBVAC 248042/H10).
Conflicts of interest: MR is employed by Statens Serum Institute, a governmental
non-profit organization which hold and licences intellectual property on the use of ESAT-6, CFP10 and TB7.7 antigens for the diagnosis of latent infection with M. tuberculosis. MR is registered as inventor on issued and pending patents filed by Copenhagen University Hospital, Hvidovre disclosing IP-10 as a biomarker for infection with M. tuberculosis. All other authors have no conflicts of interest to declare.
M
AN
US
CR
IP
T
AC
CE
PT
ED
ACCEPTED MANUSCRIPT
References[1] WHO | Global tuberculosis report 2017. WHO 2017.
[2] Who. Global strategy and targets for tuberculosis prevention, care and control after 2015. Geneva World Heal Organ 2014:2014–5. doi:WHA67.1, Agenda item 12.1. [3] WHO | Systematic screening for active tuberculosis: principles and recommendations.
WHO 2015.
[4] World Health Organization. High-priority target product profi les for new tuberculosis diagnostics: report of a consensus meeting 2014.
[5] Xie H, Mire J, Kong Y, Chang M, Hassounah HA, Thornton CN, et al. Rapid point-of-care detection of the tuberculosis pathogen using a BlaC-specific fluorogenic probe. Nat Chem 2012;4:802–9. doi:10.1038/nchem.1435.
[6] Lessem E. The Tuberculosis Diagnostics Pipeline. 2017 Pipeline Rep 2017:143–62. [7] Ruhwald M, Aabye MG, Ravn P. IP-10 release assays in the diagnosis of tuberculosis
infection: current status and future directions. Expert Rev Mol Diagn 2012;12:175–87. doi:10.1586/erm.11.97.
[8] García-Basteiro AL, Mambuque E, den Hertog A, Saavedra B, Cuamba I, Oliveras L, et al. IP-10 Kinetics in the First Week of Therapy are Strongly Associated with
Bacteriological Confirmation of Tuberculosis Diagnosis in HIV-Infected Patients. Sci Rep 2017;7:14302. doi:10.1038/s41598-017-13785-3.
[9] Kabeer BSA, Raja A, Raman B, Thangaraj S, Leportier M, Ippolito G, et al. IP-10 response to RD1 antigens might be a useful biomarker for monitoring tuberculosis therapy. BMC Infect Dis 2011;11:135–135. doi:10.1186/1471-2334-11-135. [10] Rutter CM, Gatsonis C a. A hierarchical regression approach to meta-analysis of
diagnostic test accuracy evaluations. Stat Med 2001;20:2865–84. doi:10.1002/sim.942.
[11] Macaskill P, Gatsonis C, Deeks J, Harbord R, Takwoingi Y. Cochrane Handbook for Systematic Reviews of Diagnostic Test Accuracy Chapter 10 Analysing and
M
AN
US
CR
IP
T
AC
CE
PT
ED
ACCEPTED MANUSCRIPT
[12] Deeks JJ, Macaskill P, Irwig L. The performance of tests of publication bias and other sample size effects in systematic reviews of diagnostic test accuracy was assessed. J Clin Epidemiol 2005;58:882–93. doi:10.1016/j.jclinepi.2005.01.016.
[13] Takwoingi Y, Guo B, Riley RD, Deeks JJ. Performance of methods for meta-analysis of diagnostic test accuracy with few studies or sparse data. Stat Methods Med Res 2015:96228021559226. doi:10.1177/0962280215592269.
[14] Moses LE, Shapiro D, Littenberg B. Combining independent studies of a diagnostic test into a summary roc curve: Data-analytic approaches and some additional considerations. Stat Med 1993;12:1293–316. doi:10.1002/sim.4780121403. [15] Lin MS, Liu WJ, Chong IW, Wang TH, Hwang JJ. Quantitative C-reactive protein
(CRP) in pulmonary tuberculosis. Gaoxiong Yi Xue Ke Xue Za Zhi 1986;2:710–6. [16] Wilson D, Nachega J, Morroni C, Chaisson R, Maartens G. Diagnosing
smear-negative tuberculosis using case definitions and treatment response in HIV-infected adults. Int J Tuberc Lung Dis 2006;10:31–8.
[17] Choi CM, Kang CI, Jeung WK, Kim DH, Lee CH, Yim JJ. Role of the C-reactive protein for the diagnosis of TB among military personnel in South Korea. Int J Tuberc Lung Dis 2007;11:233–6.
[18] Kang YA, Kwon SY, Yoon HIL, Lee JH, Lee CT. Role of C-reactive protein and procalcitonin in differentiation of tuberculosis from bacterial community acquired pneumonia. Korean J Intern Med 2009;24:337–42. doi:10.3904/kjim.2009.24.4.337. [19] Sage EK, Noursadeghi M, Evans HE, Parker SJ, Copas a J, Edwards SG, et al.
Prognostic value of C-reactive protein in HIV-infected patients with Pneumocystis jirovecii pneumonia. Int J STD AIDS 2010;21:288–92. doi:10.1258/ijsa.2010.009551. [20] Bandyopadhyay D, Bandyopadhyay R, Paul R, Roy D. Etiological study of fever of
unknown origin in patients admitted to medicine ward of a teaching hospital of Eastern India. J Glob Infect Dis 2011;3:329. doi:10.4103/0974-777X.91052.
[21] Lee YJ, Lee J, Kim YY, Won D Il, Cha SI, Park JY, et al. Performance of whole-blood interferon-gamma release assay in patients admitted to the emergency department
M
AN
US
CR
IP
T
AC
CE
PT
ED
ACCEPTED MANUSCRIPT
with pulmonary infiltrates. BMC Infect Dis 2011;11:107. doi:10.1186/1471-2334-11-107.
[22] Wilson D, Badri M, Maartens G. Performance of serum c-reactive protein as a screening test for smear-negative tuberculosis in an ambulatory high HIV prevalence population. PLoS One 2011;6:1–7. doi:10.1371/journal.pone.0015248.
[23] Cho K, Cho E, Kwon S, Im S, Sohn I, Song S, et al. Factors associated with indeterminate and false negative results of quantiFERON-TB gold in-tube test in active tuberculosis. Tuberc Respir Dis (Seoul) 2012;72:416–25.
doi:10.4046/trd.2012.72.5.416.
[24] Lawn SD, Kerkhoff AD, Vogt M, Wood R. Diagnostic and prognostic value of serum C-reactive protein for screening for HIV-associated tuberculosis. Int J Tuberc Lung Dis 2013;17:636–43. doi:10.5588/ijtld.12.0811.
[25] Niu W-Y, Wan Y-G, Li M-Y, Wu Z-X, Zhang L-G, Wang J-X. The diagnostic value of serum procalcitonin, IL-10 and C-reactive protein in community acquired pneumonia and tuberculosis. Eur Rev Med Pharmacol Sci 2013;17:3329–33.
[26] Drain PK, Mayeza L, Bartman P, Hurtado R, Moodley P, Varghese S, et al. Diagnostic accuracy and clinical role of rapid C-reactive protein testing in hiv-infected individuals with presumed tuberculosis in south africa. Int J Tuberc Lung Dis 2014;18:20–6. doi:10.5588/ijtld.13.0519.
[27] Yoon C, Davis JL, Huang L, Muzoora C, Byakwaga H, Scibetta C, et al. Point-of-care C-reactive protein testing to facilitate implementation of isoniazid preventive therapy for people living with HIV. J Acquir Immune Defic Syndr 2014;65:551–6.
doi:10.1097/QAI.0000000000000085.
[28] Yoon C, Semitala FC, Atuhumuza E, Katende J, Mwebe S, Asege L, et al. Point-of-care C-reactive protein-based tuberculosis screening for people living with HIV: A diagnostic accuracy study. Lancet Infect Dis 2017;3099:1–8. doi:10.1016/S1473-3099(17)30488-7.
M
AN
US
CR
IP
T
AC
CE
PT
ED
ACCEPTED MANUSCRIPT
protein 10 as a biomarker for the diagnosis of tuberculosis. Int J Infect Dis 2012;16:e855–9. doi:10.1016/j.ijid.2012.07.013.
[30] Vanini V, Petruccioli E, Gioia C, Cuzzi G, Orchi N, Rianda A, et al. IP-10 is an additional marker for tuberculosis (TB) detection in HIV-infected persons in a low-TB endemic country. J Infect 2012;65:49–59. doi:10.1016/j.jinf.2012.03.017.
[31] Yang Q, Cai Y, Zhao W, Wu F, Zhang M, Luo K, et al. IP-10 and MIG are
compartmentalized at the site of disease during pleural and meningeal tuberculosis and are decreased after antituberculosis treatment. Clin Vaccine Immunol
2014;21:1635–44. doi:10.1128/CVI.00499-14.
[32] Petrone L, Cannas A, Aloi F, Nsubuga M, Sserumkuma J, Nazziwa RA, et al. Blood or Urine IP-10 Cannot Discriminate between Active Tuberculosis and Respiratory
Diseases Different from Tuberculosis in Children, Blood or Urine IP-10 Cannot Discriminate between Active Tuberculosis and Respiratory Diseases Different from Tuberculosi. BioMed Res Int BioMed Res Int 2015;2015, 2015:e589471.
doi:10.1155/2015/589471, 10.1155/2015/589471.
[33] Fassbender K, Fassbender M, Schaberg T, Sobieska M, Müller W. Glycosylation of alpha 1-acid glycoprotein in bacterial lung infections: distinct pattern in tuberculosis. Clin Chem 1995;41:472–3.
[34] Yoon C, Chaisson LH, Patel SM, Allen IE, Drain PK, Wilson D, et al. Diagnostic accuracy of C-reactive protein for active pulmonary tuberculosis: a meta-analysis. Int J Tuberc Lung Dis 2017;21:1013–9. doi:10.5588/ijtld.17.0078.
[35] Antonelli A, Ferrari SM, Corrado A, Di Domenicantonio A, Fallahi P. Autoimmune thyroid disorders. Autoimmun Rev 2015;14:174–80. doi:10.1016/j.autrev.2014.10.016. [36] Liu C, Cui G, Zhu M, Kang X, Guo H. Neuroinflammation in Alzheimer’s disease:
Chemokines produced by astrocytes and chemokine receptors. Int J Clin Exp Pathol 2014;7:8342–55. doi:D - nlm: pmc4314046 oto - notnlm.
[37] Profumo E, Buttari B, Tosti ME, Alessandri C, Valesini G, Marcuccio L, et al. Identification of IP-10 and IL-5 as proteins differentially expressed in human
M
AN
US
CR
IP
T
AC
CE
PT
ED
ACCEPTED MANUSCRIPT
complicated and uncomplicated carotid atherosclerotic plaques. Int J Immunopathol Pharmacol 2010;23:775–82.
[38] Braunersreuther V, Mach F, Steffens S. The specific role of chemokines in atherosclerosis. Thromb Haemost 2007;97:714–21. doi:10.1160/TH07-01-0036. [39] Petrone L, Chiacchio T, Vanini V, Petruccioli E, Cuzzi G, Di Giacomo C, et al. High
urine IP-10 levels associate with chronic HCV infection. J Infect 2014;68:591–600. doi:10.1016/j.jinf.2014.02.008.
[40] Guo SJ, Jia LQ, Hu QJ, Long HY, Pang CS, Wen FQ. Diagnostic accuracy of
interferon gamma-induced protein 10 for tuberculosis: A meta-analysis. Int J Clin Exp Med 2014;7:93–100.
M
AN
US
CR
IP
T
AC
CE
PT
ED
ACCEPTED MANUSCRIPT
Figure legendFigure 1. Flow diagram of study selection.
Figure 2. Diagnostic accuracy of C-reactive protein test.
M
AN
US
CR
IP
T
AC
CE
PT
ED
ACCEPTED MANUSCRIPTTable 1. Characteristic of the studies included.
Study Country Study design
Status
HIV Setting Study subjects Tuberculosis definition Non-TB definition
Detection method Threshold Alpha-1-acid glycoprotein Fassbender, 1995 Germany Cross
sectional Unknown Community
21 confirmed TB, 27 non-TB and 36 healthy controls.
Confirmed TB based on positive culture from sputum.
Non-TB patients: sick adults who were initially suspected of PTB, but who ended up had other disease. Immuno-electrophoresis (immunoaffinity) Not provided C-Reactive protein
Lin, 1986 China Cross
sectional Unknown Community
18 confirmed TB, 26 non-TB, 12 healed TB and 31 healthy controls. Confirmed TB based on clinical features, X-ray of chest, smear or culture from sputum
Non-TB patients: sick adults who were initially suspected of PTB, but who ended up had other disease.
Nephelometry 7 µg/mL
Wilson, 2006 South
Africa Cohort Positive Hospital
59 confirmed TB and 15 non-TB patients
Confirmed TB based on positive culture from sputum.
Non-TB patients: adults who were initially suspected of active TB, but who ended up had other disease. Immuno-turbidimetry 10 mg/L Choi, 2007 South Korea Cross
sectional Negative Community
46 confirmed TB and 67 non-TB patients.
Confirmed TB based on positive culture from sputum.
Non-TB patients: sick adults who were initially suspected of PTB, but who ended up had other disease. Immuno-turbidimetry 11.2 mg/L Kang, 2009 South Korea Prospecti
ve study Unknown Community
30 confirmed TB and 57 non-TB patients.
Confirmed TB based on positive culture from sputum.
Non-TB patients: sick adults who were initially suspected of PTB, but who ended up had other disease.
M
AN
US
CR
IP
T
AC
CE
PT
ED
ACCEPTED MANUSCRIPT Sage, 2010 United Kingdom Prospective study Positive Hospital
28 confirmed TB and 219 non-TB patients.
Confirmed TB based on positive culture from sputum.
Non-TB patients: sick adults who were initially suspected of PTB, but who ended up had other disease. ELISA 10 mg/L Bandyopadhyay, 2011 India Cohort Negative/ positive Hospital 9 confirmed TB and 43 non-TB patients. Confirmed TB based on positive culture from sputum.
Non-TB patients: sick adults who were initially suspected of PTB, but who ended up had other disease. Immuno-turbidimetry 10 mg/L Lee, 2011 South Korea Prospecti
ve study Negative Hospital
82 confirmed TB and 190 non-TB patients.
Confirmed TB based on positive culture from sputum.
Non-TB patients: sick adults who were initially suspected of PTB, but who ended up had other disease. Immuno-turbidimetry 10 mg/L Wilson, 2011 South Africa Prospecti ve study Negative/ positive Community 135 confirmed TB and 115 non-TB patients. Confirmed TB based on positive culture from sputum.
Non-TB patients: adults who were initially suspected of active TB, but who ended up had other disease. immunoturbidime try/ spectrophotometr y 10 mg/L Cho, 2012 South Korea Prospecti
ve study Negative Hospital
40 confirmed TB and 33 non-TB patients.
Confirmed TB based on positive culture from sputum.
Non-TB patients: sick adults who were initially suspected of PTB, but who ended up had other disease.
Immuno-turbidimetry 10 mg/L
Lawn, 2013 South
Africa Cohort Positive Community
81 confirmed TB and 415 non-TB patients.
Confirmed TB based on positive culture from sputum.
Non-TB patients: sick adults who were initially suspected of PTB, but who ended up had other disease.
M
AN
US
CR
IP
T
AC
CE
PT
ED
ACCEPTED MANUSCRIPTNiu, 2013 China Cross
sectional Negative Community
78 confirmed TB and 113 non-TB patients
Confirmed TB based on positive culture from sputum.
Non-TB patients: sick adults who were initially suspected of PTB, but who ended up had other disease. immune scatter turbidimetry 15.2 mg/mL Drain, 2014 South Africa Prospecti
ve study Positive Community
45 confirmed TB and 47 non-TB patients
Confirmed TB based on positive culture from sputum.
Non-TB patients: sick adults who were initially suspected of PTB, but who ended up not having TB. Immunometric semi-quantitative assay/ spectrophotometr y 8 mg/L
Yoon, 2014 Uganda Prospecti
ve study Positive Community
27 confirmed TB and 244 non-TB patients
Confirmed TB based on positive culture from sputum.
Non-TB patients: sick adults who were initially suspected of PTB, but who ended up not having TB.
ELISA 10 mg/L
Yoon, 2017 Uganda Prospecti
ve study Positive Community
163 confirmed TB and 1014 non-TB patients
Confirmed TB based on positive culture from sputum.
Non-TB patients: sick adults who were initially suspected of PTB, but who ended up not having TB. ELISA 10 mg/L IP-10 Hong, 2012 South Korea Cross sectional Negative Hospital/com munity 46 confirmed TB, 22 LTBI and 32 health controls. Confirmed TB based on positive culture from sputum.
Non-TB patients: sick adults who were initially suspected of PTB, but who ended up had other disease.
M
AN
US
CR
IP
T
AC
CE
PT
ED
ACCEPTED MANUSCRIPTVanini, 2012 Italy Prospecti
ve study Negative/ positive Community 58 confirmed TB and 137 Non-TB patients. Confirmed TB based on positive culture from sputum.
Non-TB patients: sick adults who were initially suspected of PTB, but who ended up had other disease.
ELISA Not provided
Yang, 2014 China Cross
sectional Unknown Hospital/com munity 123 confirmed TB patients, 91 non-TB patients, 33 LTBI patients and 36 health controls. Confirmed TB based on positive culture from sputum.
Non-TB patients: sick adults who were initially suspected of active TB, but who ended up had but other disease.
ELISA Not provided
Petrone, 2015 Uganda Cross
sectional Negative/ positive Hospital/com munity 32 confirmed TB patients, 79 non-TB patients Confirmed TB based on positive culture from sputum.
Non-TB patients: sick children who were initially suspected of PTB, but who ended up had other disease.
M
AN
US
CR
IP
T
AC
CE
PT
ED
ACCEPTED MANUSCRIPTTable 2. Diagnostic performance of C-Reactive protein for the diagnosis of TB Test result, Number of patients
Source True-positive False-positive False-negative True-negative Sensitivity
(95%CI) Specificity (95%CI) Lin, 1986 15 6 3 20 89% (65%-99%) 77% (57%-91%) Wilson, 2006 57 10 2 5 97% (88%-100%) 33% (12%-62%) Choi, 2007 44 39 2 28 96% (85%-99%) 42% (30%-54%) Kang, 2009 30 28 0 29 100% (88%-100%) 51% (37%-64%) Sage, 2010 25 171 3 48 89% (72%-98%) 22% (17%-28%) Bandyopadhyay, 2011 5 14 4 29 56% (21%-86%) 67% (51%-81%) Lee, 2011 67 175 15 15 82% (72%-89%) 8% (4%-13%) Wilson, 2011 128 27 7 88 95% (90%-98%) 77% (68%-84%) Cho, 2012 23 20 17 13 58% (41%-73%) 39% (23%-58%) Lawn, 2013 73 233 8 182 90% (81%-96%) 44% (39%-49%) Niu, 2013 64 14 14 21 82% (72%-90%) 60% (42%-76%) Drain, 2014 44 22 1 26 98% (88%-100%) 54% (39%-69%) Yoon, 2014 22 47 5 197 81% (62%-94%) 81% (75%-85%) Yoon, 2017 145 283 18 731 89% (83%-93%) 72% (69%-75%) Summary estimates - - - - 89% (80%-96%) 57% (36%-65%)
M
AN
US
CR
IP
T
AC
CE
PT
ED
ACCEPTED MANUSCRIPT
Table 3. Sub-group analysis for diagnosis performance of C-Reactive protein for the diagnosis of TB
Subgroups Number of
studies Sensitivity (95%CI) Specificity (95%CI)
TB burden High-burden countries 9 90% (82%-92%) 64% (53%-75%) Other countries 5 86% (69%-81%) 28% (15%-48%) HIV-status Unknown 2 90% (54%-99%) 63% (36%-85%) HIV-infected 6 91% (85%-93%) 61% (32%-71%) HIV-uninfected 4 81% (65%-90%) 32% (12%-63%) HIV uninfected/infected 2 83%(27%-98%) 73% (65%-81%) Clinical setting Community 9 90% (85%-93%) 62% (51%-73%) Hospital 5 80% (61%-91%) 51% (37%-64%) C-RP quantification method Nephelometry 1 83% (59%-95%) 77% (57%-89%) Immunoturbidimetry 9 88% (78%-94%) 46% (29%-65%) ELISA 4 88% (84%-91%) 55% (31%-77%)
M
AN
US
CR
IP
T
AC
CE
PT
ED
ACCEPTED MANUSCRIPTTable 4. Meta-regression analysis for potential sources of heterogeneity.
Variable Sensitivity Specificity
Coefficient (95%CI) Std. error P-value Coefficient (95%CI) Std. error P-Value WHO TB burden
High-burden country reference
Other country 1.686 (0.140 to 3.232) 0.789 0.033 -0.750 (-2.104 to 0.605) 0.691 0.278 HIV status Unknown reference HIV uninfected -1.020 (-4.171 to 2.132) 1.608 0.526 -0.366 (-1.841 to 1.110) 0.753 0.627 HIV infected 1.360 (-2.414 to 5.134) 1.926 0.480 -0.617 (-2.641 to 1.407) 1.033 0.550 HIV uninfected/infected -0.127 (-4.428 to 4.173 ) 2.194 0.954 1.149 (-1.748 to 4.046) 1.478 0.437 Clinical setting Community reference Hospital -2.074 (-3.574 to -0.574) 0.765 0.007 -1.205 (-2.455 to 0.045) 0.638 0.059 Community/Hospital -0.434 (-2.890 to 2.022) 1.253 0.729 -0.860 (-2.635 to 0.915) 0.906 0.342 C-RP quantification method Nephelometry reference ELISA -0.899 (-4.905 to 3.107) 2.044 0.660 0.107 (-2.399 to 2.613) 1.279 0.933 Immuno-turbidimetry 0.815 (-2.627 to 4.258) 1.756 0.643 -0.420 (-2.566 to 1.727) 1.095 0.702 Intercept 1.609 (0.347 to 2.872) 0.644 0.012 1.204 (-0.088 to 2.496) 0.659 0.068
M
AN
US
CR
IP
T
AC
CE
PT
ED
ACCEPTED MANUSCRIPTTable 5. Diagnostic performance of IP-10 for the diagnosis of TB Test result, Number of patients
Source True-positive False-positive False-negative True-negative Sensitivity (95%CI) Specificity (95%CI) TB vs Non-TB Hong, 2012 21 10 3 12 0.88 (0.67-0.95) 0.55 (0.34-0.73) Yang, 2014 41 3 5 30 0.89 (0.81-0.95) 0.91 (0.75-0.97) Petrone, 2015 25 37 7 42 0.78 (0.61-0.89) 0.53 (0.43-0.64) Summary estimates - - - - 0.85 (0.77-0.92) 0.63 (0.54-0.71)
TB HIV+ vs Non-TB HIV+
Vanini, 2012 19 76 2 21 0.91 (0.69-0.98) 0.22 (0.15-0.31)
Petrone, 2015 13 15 0 3 0.96 (0.62-0.99) 0.20 (0.07-0.42)