Ab initio
derived analytical fits of the two lowest triplet
potential energy surfaces and theoretical rate constants
for the N
„
4S
…¿
NO
„
X
2⌸
…
system
P. Gamallo, Miguel Gonza´lez,a)and R. Sayo´sb)
Departament de Quı´mica Fı´sica i Centre de Recerca en Quı´mica Teo`rica, Universitat de Barcelona, C. Martı´ i Franque`s 1, 08028 Barcelona, Spain
共Received 11 March 2003; accepted 2 May 2003兲
This work presents two new analytical fits of the ground potential energy surface共PES兲 (3A
⬙
) and the first excited PES (3A⬘
) involved in the title reaction, considering the N-abstraction共1兲 and the O-abstraction 共2兲 reaction channels, and the reverse reaction 共⫺1兲. The PESs are derived from abinitio electronic structure calculations by means of second-order perturbation theory on a complete
active-space self-consistent-field wave function共CASPT2 method兲. Stationary points and extensive grids of ab initio points共about 5600 points for the3A
⬙
PES and 4900 points for the3A⬘
PES兲 werefitted along with some diatomic spectroscopic data to better account for the experimental
exoergicity. Thermal rate constants were calculated 共200–5000 K兲 for all mentioned reaction
processes by means of the variational transition-state theory with the inclusion of a semiclassical tunneling correction. Excellent agreement with the experimental data was observed for reaction共1兲 and its reverse, within all the temperature range, substantially improving the results derived from previous analytical PESs. The contribution of the3A
⬘
PES to the reaction rate constant (k1) wassmall even at high temperatures共e.g., only 10.8% at 2500 K兲. Moreover, the main contribution to reaction rate constant (k2) was due to the3A
⬘
PES, differing from what happens for reaction共1兲.The O-abstraction reaction channel accounts for a 3.0% of the total reaction (k⫽k1⫹k2) at 5000 K,
consistent with the very limited experimental information available. © 2003 American Institute of
Physics. 关DOI: 10.1063/1.1586251兴
I. INTRODUCTION
The elementary gas-phase reaction of ground atomic ni-trogen with nitric oxide,1
N共4S兲⫹NO共X2⌸兲→O共3P兲⫹N2共X1⌺g⫹兲⌬rH0Kⴰ
⫽⫺75.01 kcal/mol, 共1兲
and its reverse reaction are of interest in atmospheric chem-istry. Reaction共1兲 is thought to be the dominant removal step for odd nitrogen in the upper stratosphere, the mesosphere, and the thermosphere of the Earth and, possibly, also in Mars and Venus.2– 4 The precision of the rate constants for this reaction over a wide range of temperatures关e.g., from 185 K in mesopause to approximately 1000 K at 250 km of altitude 共upper thermosphere兲 共Ref. 5兲兴 is of great interest for mod-eling the concentration of NOx species in these atmospheric regions for different levels of solar activity. Moreover, this reaction has been also proposed as one important step to remove the NO molecules produced in some heterogeneous catalytic processes共e.g., in SiO2-based materials兲 for airflow
cases.6The reverse reaction is as well one of the two steps of the Zeldovich mechanism which produces NO, and it is very important for accurate modeling of thermochemical phenom-ena in rarefied atmospheric flows. A good understanding of the vibrationally and rotationally hot NO molecules
pro-duced by the reverse reaction is necessary to establish appro-priately the heat flux on the thermal protection systems used in atmospheric reentry vehicles共e.g., American space shuttle, Japanese orbital reentry experiment, etc.兲.
Reaction 共1兲 has been the object of abundant kinetic
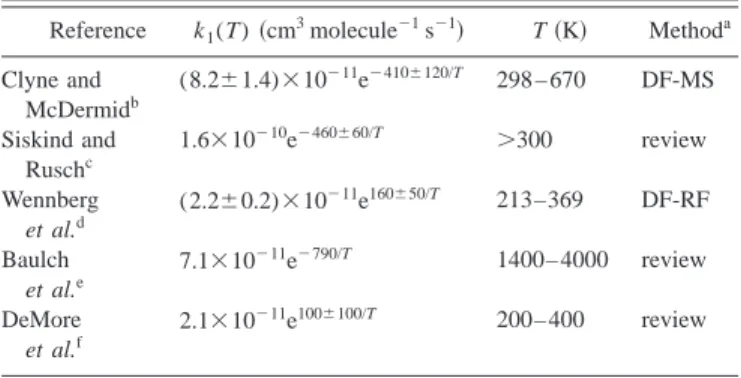
studies over several temperature ranges, but these studies present significant discrepancies, possibly due to its slight temperature dependence. Table I reports a brief summary of some of the main Arrhenius expressions for the experimental rate constants. A small activation energy 共0.8–1.6 kcal/mol兲
or even a negative value 共⫺0.2 to ⫺0.3 kcal/mol兲 were
re-ported in these works. Direct kinetic data for the reverse endothermic reaction have also been obtained mainly at high
temperatures (T⬎2000 K),8 and they are more coincident
than in the case of the direct reaction.
There are very few experimental studies dealing with the dynamic properties of reaction共1兲 or about its reverse 共⫺1兲. Very early studies showed a product N2 average vibrational
energy fraction of 0.25–0.28.10,11 However, another past
study indicated 75%⫾5% of the N2 molecules appeared
with v
⬘
⬎4.12 To the best of our knowledge, there are no experimental dynamics studies on the reverse reaction. How-ever, theoretical studies are available on both reactions. In earlier studies we presented several theoretical approaches for reaction共1兲, and we also gave a wide review of the main experimental and theoretical data that had been published for this reaction. We developed an analytical potential energy surface13共PES兲 based on limited ab initio information14 for a兲Electronic mail: [email protected]b兲Electronic mail: [email protected]
2545
the ground3A
⬙
PES. In addition, we also performed dynami-cal studies on reaction 共1兲 by means of the quasiclassicaltrajectory 共QCT兲 method,15 reduced quantum mechanical
approaches,16 and simple models.17 Recently, QCT calcula-tions on a new 3A
⬙
PES,18 which fitted the same aforemen-tioned ab initio data,14but adding interpolated semiempirical points, reported good thermal rate constants for the 200– 1000 K temperature range. In that work the authors consid-ered the inclusion of a reactant statistical degeneracy factor excluding the NO spin-orbit correction 共i.e., 3/16兲, missing in previous works. These authors also carried out a QCT study19on this reaction, taking into account the first excited PES (3A⬘
), previously fitted for the reverse reaction by otherauthors.20It was concluded that the excited PES became im-portant for reaction共1兲 only at high energies 共1–3 eV兲. Sev-eral theoretical studies on the reverse reaction, using these analytical PESs (3A
⬙
and3A⬘
), produced thermal rate con-stants and product energy distributions at very hightempera-tures 共i.e., 3000–20 000 K兲, for both thermodynamic
equilibrium20 and nonequilibrium conditions.21
In addition to reaction 共1兲, a second reaction channel involving the O-abstraction process,
N共4S兲⫹N
⬘
O共X2⌸兲→N⬘
共4S兲⫹NO共X2⌸兲⌬rH0K °⫽0 kcal/mol, 共2兲
can be produced. There is almost no information about it. Some experiments22,23 at very high energies with 13N and pure NO have indicated that reaction channel 2 yielding
13NO could account for up to a 20% of the total reactivity of
this system, though with the possible contribution of the first excited states of nitrogen 关N(2D,2P)兴. Nevertheless, there
are neither kinetic nor dynamic data about this reaction. In a recent study of our own共hereafter called paper I兲,24 we have made an extensive ab initio characterization of the stationary points of the lowest3A
⬙
and3A⬘
PESs. Accordingto this study, reaction 共1兲 should be much more important
than reaction 共2兲, which should only contribute to reactivity at high collision energies共e.g., over 30 kcal/mol兲. Moreover,
we confirmed that the 3A
⬙
PES had no energy barrier forreaction 共1兲 and that the 3A
⬘
PES had an energy barrier共TS1兲 much lower than the previous ab initio reported
value.14 Both PESs showed the presence of a minimum
共MIN1兲 and a transition state 共TS2兲 in the minimum energy path共MEP兲 for reaction 共2兲.
Here we present new analytical PESs for both 3A
⬙
and3A
⬘
states, based on the high-level ab initio data published inpaper I, along with additional grids of ab initio points now calculated. These new PESs will provide better kinetic and dynamical data, and also will allow a deeper understanding of the two reaction channels involved in the title reaction. Furthermore, these PESs will be useful in the study of the reverse reaction in the nonequilibrium conditions of atmo-spheric reentry vehicles.
This paper is organized as follows: the ab initio method, the fitting procedure, and the derived analytical PESs are described in Sec. II, several variational transition-state theory calculations on thermal rate constants are presented in Sec. III, and finally Sec. IV contains the main concluding re-marks.
II. ANALYTICAL POTENTIAL ENERGY SURFACES A.Ab initio molecular structure
and surface fitting methods
We have carried out the calculation of grids of ab initio points for both PESs following the main ab initio method
used in paper I.24 Thus the complete active-space
self-consistent-field 共CASSCF兲 method25,26was used, always in-cluding the lowest root in Cssymmetry for both triplet PESs 共i.e.,3A
⬘
and3A⬙
). An active space comprising ten electronsin nine orbitals 关i.e., CAS共10,9兲兴 and the standard
correlation-consistent cc-pVTZ Dunning’s basis set27 were applied in all calculations. Results obtained in paper I共Ref. 24兲 showed that this ab initio level was accurate enough, and the computer time was also reasonable to compute a large number of points for both reaction channels. The dynamical correlation energy was included by performing second-order
perturbation theory calculations 共CASPT2兲 over the
CASSCF wave function using the G2 variant.28All
calcula-tions were carried out by means of the MOLCAS 4.1
program.29
The analytical representations of the PESs are based on a many-body expansion30for the NN
⬘
O system. In both cases this expansion can be written asV共R1,R2,R3兲⫽VNN⬘ 共2兲 共R 1兲⫹VN⬘O 共2兲 共R 2兲⫹VNO共2兲共R3兲 ⫹VNN⬘O 共3兲 共R 1,R2,R3兲, 共3兲
where V(2) and V(3) are the two- and three-body terms, re-spectively, and R1, R2, and R3 are the NN
⬘
, N⬘
O, and NOdistances, respectively. The one-body V(1) terms have been omitted here because all the diatomic molecules dissociate
into atoms in their ground electronic states 关N(4S)
⫹N
⬘
(4S)⫹O(3P)兴. The two-body terms 共diatomic potentialenergy curves兲 have been fitted using an extended-Rydberg potential up to third or fifth-order,
TABLE I. Experimental kinetic data for the N(4S)⫹NO→O(3P)⫹N 2 re-action. Reference k1(T)共cm 3 molecule⫺1s⫺1兲 T共K兲 Methoda Clyne and McDermidb (8.2⫾1.4)⫻10⫺11e⫺410⫾120/T 298 – 670 DF-MS Siskind and Ruschc 1.6⫻10⫺10e⫺460⫾60/T ⬎300 review Wennberg et al.d (2.2⫾0.2)⫻10⫺11e160⫾50/T 213–369 DF-RF Baulch et al.e 7.1⫻10⫺11e⫺790/T 1400– 4000 review DeMore et al.f 2.1⫻10⫺11e100⫾100/T 200– 400 review
aDF共discharge flow兲, MS 共mass spectrometry兲, and RF 共resonance
fluores-cence兲. bReference 7. c Reference 2. dReference 3. e
Reference 8, with an error:⌬ log k⫽⫾0.2. Data for its reverse reaction are also reported: 3.0⫻10⫺10e⫺38300/T共1400–4000 K兲.
f
V共2兲共R兲⫽⫺De
冉
1⫹兺
i⫽1 n⭐5aii
冊
e⫺a1, 共4兲 where Deand Reare the equilibrium dissociation energy and the equilibrium bond distance of each diatomic molecule, respectively, andis defined as being equal to R⫺Re.The three-body term is a product of a sixth-order poly-nomial P(S1,S2,S3) and a range function T(S1,S2,S3),
both expressed in terms of symmetry-adapted coordinates (S1,S2,S3): VNN共3兲⬘O共S1,S2,S3兲⫽P共S1,S2,S3兲T共S1,S2,S3兲, 共5兲 with P共S1,S2,S3兲⫽
兺
i, j,k⫽0 0⭐i⫹ j⫹k⭐6 ci jkS1iS2jS3k, 共6兲with i, j, and k being positive integer numbers and
T共S1,S2,S3兲⫽
兿
i⫽1
3
冋
1⫺tanh冉
␥iSi2
冊册
. 共7兲The range function vanishes the three-body term whenever one of the three atoms is separated from the other two. The symmetry-adapted coordinates used were
S1⫽1, S2⫽ 1 &共2⫹3兲, 共8兲 S3⫽ 1 &共2⫺3兲,
and i⫽Ri⫺Riⴰ with (R1ⴰ,R2ⴰ,R3ⴰ) defining a reference C2v
structure. The use of these coordinates guarantees the permu-tational NN
⬘
symmetry of the analytical PESs.The two-body parameters (ai) were optimized by means of a nonlinear least-squares procedure,31 while the three-body parameters (ci jkand␥i) were optimized by a weighted nonlinear least-squares method.32 In both cases we follow a similar strategy as in our previous works 关e.g., N(2D)⫹NO 共Ref. 33兲. N(2D)⫹O
2 共Ref. 34兲, or N(4S)⫹O2 共Ref. 35兲兴.
B. Analytical representation of the 3A⬙ PES
A total of 30 ab initio points 关CASPT2共10,9兲
G2/cc-pVTZ兴 calculated for each diatomic molecule 共supermol-ecule calculations for NO and N2) have been fitted by using
an extended-Rydberg potential curve 关Eq. 共4兲兴 up to third
order for the two diatomic curves used in the 3A
⬙
PES and up to fifth-order for the3A⬘
PES. The spectroscopic Reand De values36were used for both curves. The final root-mean-square deviation共RMSD兲 of the fit in each diatomic energycurve was below 0.8 kcal/mol 共with three parameters兲 and
0.4 kcal/mol 共with five parameters兲 for both molecules. The
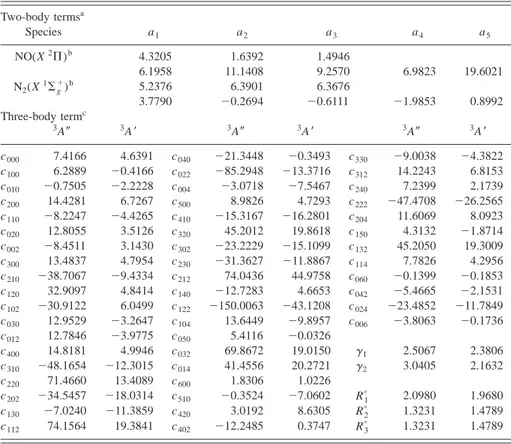
TABLE II. Optimal parameters for the3A⬙and3A⬘analytical PESs.
Two-body termsa Species a1 a2 a3 a4 a5 NO(X2⌸)b 4.3205 1.6392 1.4946 6.1958 11.1408 9.2570 6.9823 19.6021 N2(X1⌺g⫹) b 5.2376 6.3901 6.3676 3.7790 ⫺0.2694 ⫺0.6111 ⫺1.9853 0.8992 Three-body termc 3A⬙ 3A⬘ 3A⬙ 3A⬘ 3A⬙ 3A⬘ c000 7.4166 4.6391 c040 ⫺21.3448 ⫺0.3493 c330 ⫺9.0038 ⫺4.3822 c100 6.2889 ⫺0.4166 c022 ⫺85.2948 ⫺13.3716 c312 14.2243 6.8153 c010 ⫺0.7505 ⫺2.2228 c004 ⫺3.0718 ⫺7.5467 c240 7.2399 2.1739 c200 14.4281 6.7267 c500 8.9826 4.7293 c222 ⫺47.4708 ⫺26.2565 c110 ⫺8.2247 ⫺4.4265 c410 ⫺15.3167 ⫺16.2801 c204 11.6069 8.0923 c020 12.8055 3.5126 c320 45.2012 19.8618 c150 4.3132 ⫺1.8714 c002 ⫺8.4511 3.1430 c302 ⫺23.2229 ⫺15.1099 c132 45.2050 19.3009 c300 13.4837 4.7954 c230 ⫺31.3627 ⫺11.8867 c114 7.7826 4.2956 c210 ⫺38.7067 ⫺9.4334 c212 74.0436 44.9758 c060 ⫺0.1399 ⫺0.1853 c120 32.9097 4.8414 c140 ⫺12.7283 4.6653 c042 ⫺5.4665 ⫺2.1531 c102 ⫺30.9122 6.0499 c122 ⫺150.0063 ⫺43.1208 c024 ⫺23.4852 ⫺11.7849 c030 12.9529 ⫺3.2647 c104 13.6449 ⫺9.8957 c006 ⫺3.8063 ⫺0.1736 c012 12.7846 ⫺3.9775 c050 5.4116 ⫺0.0326 c400 14.8181 4.9946 c032 69.8672 19.0150 ␥1 2.5067 2.3806 c310 ⫺48.1654 ⫺12.3015 c014 41.4556 20.2721 ␥2 3.0405 2.1632 c220 71.4660 13.4089 c600 1.8306 1.0226 c202 ⫺34.5457 ⫺18.0314 c510 ⫺0.3524 ⫺7.0602 R1ⴰ 2.0980 1.9680 c130 ⫺7.0240 ⫺11.3859 c420 3.0192 8.6305 R2ⴰ 1.3231 1.4789 c112 74.1564 19.3841 c402 ⫺12.2485 0.3747 R3ⴰ 1.3231 1.4789 a
The dissociation energies and the equilibrium distances used in the fits are given in Table III.
bExtended Rydberg coefficients used for the3A⬙PES共first row兲 and the3A⬘PES共second row兲. c
Units are ci jk(eV Å⫺(i⫹ j⫹k)),␥i共Å⫺1兲, Riⴰ共Å兲, and ai(Å⫺i), where R1⫽RNN⬘ , R2⫽RN⬘O,
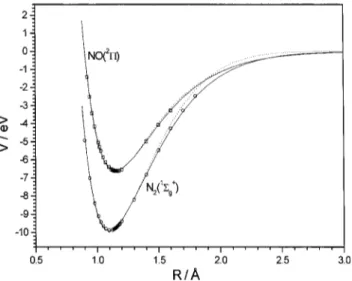
optimal parameters are shown in Table II. Although both curves for each molecule are similar 共Fig. 1兲, it was neces-sary improve the first diatomic fit 共with three parameters兲, because the small differences at long distances 共mainly for N2) were significant to remove spurious minima during the fit of the second PES (3A
⬘
). The spectroscopic constants of the diatomic molecules derived from the optimal analytical curves are summarized in Table III, which compared very well with the experimental data, only with small differences for both analytical curves.A total of 5630 ab initio points 关CASPT2共10,9兲 G2/
cc-pVTZ兴 have been computed in different regions of the
3A
⬙
PES to be used in the analytical fit, as summarizedbe-low:
共a兲 3917 points for the NN
⬘
O region (N⬘
-abstraction channel兲 distributed within the following grids:100°⭐⬔NN
⬘
O⭐140° for 0.9 Å⭐RNN⬘⭐4.5 Åand 0.9 Å⭐RN⬘O⭐4.5 Å
共general and MEP兲,
80°⭐⬔NN
⬘
O⭐180° for 2.1 Å⭐RNN⬘⭐4.5 Åand 1.0 Å⭐RN⬘O⭐1.25 Å
共entrance valley兲,
80°⭐⬔NN
⬘
O⭐180° for 0.9 Å⭐RNN⬘1.2 Åand 1.8 Å⭐RN⬘O⭐4.5 Å 共exit valley兲.
共b兲 1713 points for the NON
⬘
region 共O-abstraction channel兲 distributed within the following grids:90°⭐⬔NON
⬘
⭐180° for 0.9Å⭐RNO⭐4.5 Åand 0.9 Å⭐RON⬘⭐4.5 Å 共general and MEP兲,
80°⭐⬔NON
⬘
⭐150° for 2.3 Å⭐RNO⭐4.5 Åand 1.0 Å⭐RON⬘⭐1.25 Å
共entrance or exit valley兲,
100°⭐⬔NON
⬘
⭐108° for 1.15 Å⭐RNO⭐1.6 Åand 1.15 Å⭐RON⬘⭐1.6 Å
共MIN1 and TS2 regions兲.
A small modification was introduced in the ab initio data in order to reproduce as accurately as possible the experi-mental diatomic dissociation energies and, hence, the exoer-gicity of reaction共1兲. As both ab initio values24were smaller than their experimental values, a uniform and first energy shift corresponding to the NO difference was introduced in all the points of the entrance valley共approximately from the line RNO⬍1.8 Å) for reaction 共1兲 and for all points
calcu-lated for reaction 共2兲. Afterward, an additional energy shift
was added to the points of the exit valley 共approximately
from line RNO⬎1.8 Å) for reaction 共1兲. This procedure was
made trying to preserve as much as possible the original ab
initio shape of the PES. All these ab initio points along with
the first-order partial derivatives with respect to both dis-tances and its angle for MIN1 and TS2 were used in a weighted nonlinear least-squares method32 to obtain the op-timal fit. The weights used were equal to 1 for almost all points, with the exception of the grids corresponding to the entrance and exit valleys, and also in the first-order partial derivatives, where we used weights between 50 and 100.
FIG. 1. Ab initio 关CASPT2共10,9兲 G2/cc-pVTZ兴 diatomic points for the NO(X2⌸) and the N
2(X1⌺g⫹) molecules. The lines show the analytical fit
which reproduces also the experimental Reand De, by using a third-order
extended-Rydberg potential共dotted lines, for the3A⬙ PES兲 or by using a fifth-order extended-Rydberg potential共solid lines, for the3A⬘PES兲.
TABLE III. Spectroscopic constants of the diatomic molecules.
Molecule Re共Å兲 De共kcal/mol兲 e共cm⫺1兲 exe共cm⫺1兲 Be共cm⫺1兲 ␣e共cm⫺1兲 D¯e共cm⫺1兲 NO(X2⌸) Analytical fita 1.1508 152.53 1900.4 16.348 1.6861 1.99⫻10⫺2 5.40⫻10⫺6 1947.3 16.128 1.6861 1.60⫻10⫺2 5.16⫻10⫺6 Experimentalb 1.1508 152.53 1904.2 14.075 1.6720 1.71⫻10⫺2 5.47⫻10⫺6 N2(X 1⌺ g ⫹) Analytical fita 1.0977 228.41 2374.8 15.757 1.9754 2.15⫻10⫺2 5.72⫻10⫺6 2388.2 14.582 1.9751 1.71⫻10⫺2 5.66⫻10⫺6 Experimentalb 1.0977 228.41 2358.6 14.324 1.9982 1.73⫻10⫺2 5.76⫻10⫺6 aSpectroscopic parameters from the diatomic fits for the3A⬙PES共first row兲 and the3A⬘PES共second row兲. bExperimental data of NO(X2⌸
We employed as initial reference structure the C2v
ge-ometry used in our first work (R1ⴰ⫽2.17 Å,R2ⴰ⫽R3ⴰ
⫽1.96 Å) 共Ref. 13兲 and which was slightly optimized by trial and error to improve the final fit. The optimal 55 three-body parameters (ci jk,␥iand Riⴰ) are shown in Table II. The
final RMSD for the 3A
⬙
surface was equal to 1.44 kcal/mol for the NN⬘
O region and 2.59 kcal/mol for the NON⬘
inser-tion region. The global RMSD for this surface was 1.80 kcal/mol. These RMSDs are lower than the estimate errors ofthe ab initio method, as were shown in paper I 共Ref. 24兲
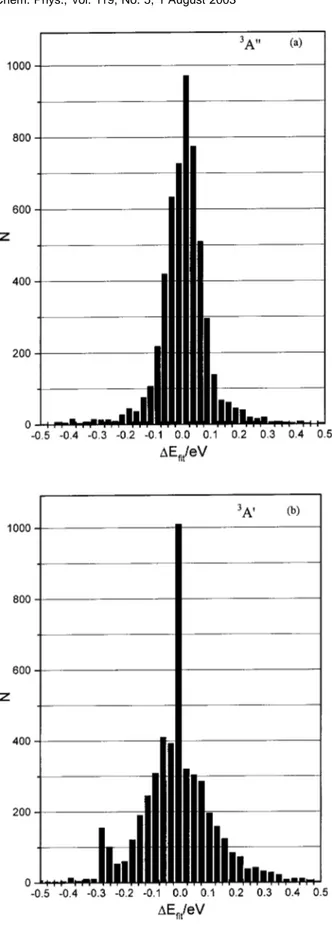
关e.g., the ab initio De 共NO兲 value was equal to 146.15 kcal/mol compared to the experimental value of 152.53 kcal/mol兴. Figure 2共a兲 shows the energy deviations of the fit 共i.e., ⌬Efit⫽Eanalytical⫺Eab initio), which show a quite
nar-row distribution supporting the goodness of the fit. On the other hand, the in principle larger RMSD for the NON
⬘
re-gion is really much lower in relative terms for this quite repulsive PES region related with the O-abstraction channel. Table IV shows the properties of the stationary points fitted in this region of the PES共TS2 and MIN1兲, which are located at very high energies over reactants. There is a good agree-ment between the ab initio properties reported in paper I for these stationary points and the values of the fit shown in Table IV, regardless of the main effort was focused in the fit of the NN⬘
O region, because reaction共1兲 was the principal reaction channel due to the absence of energy barrier along the MEP. Thus the fitted TS2 and MIN1 were located only 0.7kcal/mol 共1.7% of error兲 and 2.3 kcal/mol 共6.2% of error兲
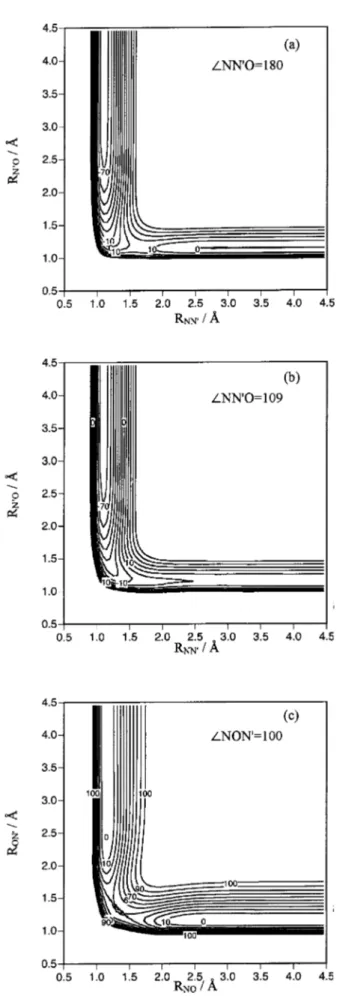
below their ab initio values,24respectively. Figure 3 presents some equipotential energy curves corresponding to the 3A
⬙
PES, where it becomes evident the absence of an energy barrier for reaction共1兲 关see Figs. 3共a兲 and 3共b兲兴. In Fig. 3共c兲 we can observe TS2 and MIN, which are energetically and geometrically very close. This proximity produced some dif-ficulties in their characterization, especially for the harmonic vibrational frequency3 共asymmetric stretching of b2
sym-metry兲. Several intrinsic reaction coordinate 共IRC兲 calcula-tions were carried out to make sure the MEPs that are sche-matically shown in Fig. 4共a兲 for both reaction channels.
C. Analytical representation of the 3A⬘ PES
We have followed for the 3A
⬘
PES the same procedureindicated in previous section for the3A
⬙
PES. In this case, as was explained before, the diatomic curves were fitted using a fifth-order extended Rydberg 共Table II兲. We used as initial reference structure the optimal geometry found for the 3A⬙
PES, which was slightly optimized by trial and error.
A total of 4901 ab initio points关CASPT2共10,9兲
G2/cc-pVTZ兴 have been calculated in different regions of the 3A
⬘
PES to be used in the analytical fit, as summarized below: 共a兲 2614 points for the NN
⬘
O region (N⬘
-abstraction channel兲 distributed within the following grids:80°⭐⬔NN
⬘
O⭐180° for 0.9 Å⭐RNN⬘⭐4.5 Åand 0.9 Å⭐RN⬘O⭐4.5 Å 共general and MEP兲,
112°⭐⬔NN
⬘
O⭐117° for 1.9 Å⭐RNN⬘⭐2.05 Åand 1.14 Å⭐RN⬘O⭐1.18 Å 共TS1 region兲.
共b兲 2287 points for the NON
⬘
region 共O-abstraction channel兲 following the ranges:90°⭐⬔NON
⬘
⭐180° for 0.9 Å⭐RNO⭐4.5 Åand 0.9 Å⭐RON⬘⭐4.5 Å 共general and MEP兲,
FIG. 2. Distribution of the energy deviations (⌬Efit⫽Eanalytical⫺Eab initio)
121°⭐⬔NON
⬘
⭐127° for 1.1 Å⭐RNO⭐1.35 Åand 1.25 Å⭐RON⬘⭐2.0 Å
共MIN1 and TS2 regions兲.
Here we used the same correction in the ab initio data as for the3A
⬙
PES. These ab initio points with weight equal to 1共excepting the grid around TS1 that has a weight of 1000兲, together with the first-order partial derivatives with respect to the internal coordinates of TS1, MIN1, and TS2 with weight 100, were used in the weighted nonlinear least-squares method to obtain the optimal analytical fit. Thefinal RMSD for the 3A
⬘
surface was the following: 1.61kcal/mol for the NN
⬘
O region and 2.85 kcal/mol for theNON
⬘
region, with a global RMSD of 2.28 kcal/mol. Figure2共b兲 shows the distribution of deviations for this fit, which is somewhat poorer than that for the3A
⬙
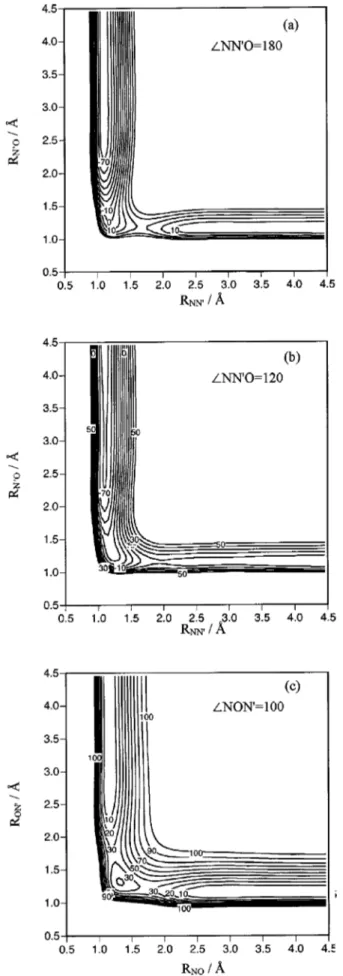
PES. Figure 5 showssome equipotential curves corresponding to the 3A
⬘
PES,where is possible to see the transition state TS1 关Figs. 5共a兲 and 5共b兲兴 and TS2 and MIN1 关Fig. 5共c兲兴. The properties of the different stationary points are depicted in Table IV. The analytical 3A
⬘
PES reproduces very well the ab initio TS1 properties关e.g., to be compared with the ab initio geometryRNN⬘⫽1.9680 Å, RN⬘O⫽1.1578 Å, ⬔NN
⬘
O⫽116.04°, ⌬E⫽⫽8.38 kcal/mol 共Ref. 24兲兴 which is the most importantstationary point. These results can also be compared with a previous analytical PES 共Ref. 20兲 based on limited ab initio data, which had a larger energy barrier and a longer NN distance 共see Table IV兲. The lowering of the energy barrier was discussed in paper I 共Ref. 24兲 and justified due to the importance of the N and O 2s electron correlation, omitted in early ab initio14studies. Furthermore, the strengthening of the NN distance was also observed in similar studies 关e.g., N(4S)⫹O2 共Ref. 37兲兴, when the geometry optimization was
carried out directly by including the dynamical correlation energy.24
The quality of this PES fit is a bit worse for the TS2 and MIN1 structures. Nevertheless, the errors in their fitted
ener-gies were lower than a 2% of the corresponding ab initio values. Figure 4共b兲 presents schematically the MEPs corre-sponding to both reaction channels. It can be observed by
comparison with the MEPs of the 3A
⬙
PES that the secondreaction channel becomes more accessible than for the 3A
⬙
PES, although still at high temperatures.
III. VARIATIONAL TRANSITION-STATE THERMAL RATE CONSTANTS
Thermal rate constants for both reaction channels of N(4S)⫹NO(X2⌸) and also for the reverse reaction have
been calculated within the 200–5000 K and 600–5000 K temperature intervals, respectively. We have considered dif-ferent levels of the variational transition-state theory38 共VTST兲, as implemented in the POLYRATE code.39 The rate constant values finally presented were the improved canoni-cal 共ICVT兲 ones with a microcanonical optimized multidi-mensional tunneling correction共OMT兲 for reaction 共1兲 and its reverse and the ICVT ones with a small curvature tunnel-ing correction共SCT兲 for the O-abstraction reaction. For this latter reaction this tunnel correction was the only acceptable one, due to the problems generated by the curvature of the MEP, with the presence also of the MIN1 and the two equivalent TS2s.
To calculate the total thermal rate constants for all reac-tions, we have used the two PESs (3A
⬙
and3A⬘
) that can contribute to reactivity within the temperature range studied. Moreover, we have also considered a spin-orbit correction as in recent similar studies,33,35to take into account the two NO reactant spin-orbit states for reactions共1兲 and 共2兲. Thus, the electronic partition function 关Q(T)兴 of NO(X2⌸) is given byQNO共2⌸兲
elec
共T兲⫽g共2⌸
1/2兲⫹g共2⌸3/2兲e⫺⌬/RT, 共9兲
where g(2⌸1/2) and g(2⌸3/2) are both equal to 2, and the TABLE IV. Properties of the stationary points located on the3A⬙and3A⬘analytical PESs.
Stationary points Re(NO)共Å兲a Re(NN⬘)共Å兲 Rc(N⬘O)共Å兲 ⬍NON⬘共deg兲a ⬍NN⬘O共deg兲 i共cm⫺1兲 b
⌬E 共kcal mol⫺1兲c 3A⬙PES TS2 1.3965 1.2609 102.01 299.22 1299.14 374.71i 40.45共40.02兲 MIN1 1.3218 1.3218 97.13 375.39 1274.70 41.54d 39.25共38.95兲 3A⬘PES TS2 1.6892 1.2008 115.01 445.72 1542.79 609.78i 27.33共27.45兲 MIN1 1.2921 1.2921 114.13 530.96 1105.97 1234.42 13.87共15.19兲 TS1 1.9755 1.1571 115.21 428.07 1793.61 380.27i 8.35共8.74兲 TS1e 1.8913 1.1690 116.5 438 1648 544i 14.4共14.7兲 a
Variables used for the NON⬘structures:共top兲 TS2, MIN1, and for the NN⬘O structures.共bottom兲 TS1.
bHarmonic vibrational frequencies:共a兲 NON⬘-C
s:1(NON⬘bend., a⬘),2 (ON⬘str., a⬘),3共NO str., a⬘)
respectively;共b兲 NON⬘-C2v:1(NON⬘bend., a1),2共sym. str., a1),3共asym. str., b2), respectively共YZ
taken as the molecular plane兲; 共c兲 NN⬘O-Cs:1(NN⬘O bend., a⬘),2(N⬘O str., a⬘), and3(NN⬘str., a⬘),
respectively. Masses of the most abundant isotopes were used.14N and16O.
cEnergy respect to N(4S)⫹N⬘O. The value corrected with the difference of zero point energies is shown in
parentheses.
dThis frequency has an estimated error of⫾100% due to its difficult numerical characterization 共very flat
surface兲.
spin-orbit splitting⌬(2⌸3/2–2⌸1/2) is equal to 121.1 cm⫺1. 1
The expression for k1and k2can be obtained from the
equa-tion
ki⫽ki共3A
⬙
兲⫹ki共3A⬘
兲⫽3ki⬘
共3A
⬙
兲⫹3ki⬘
共3A⬘
兲4共2⫹2e⫺174.2/T兲 , i⫽1,2. 共10兲 Primed ki show the rate constants without the inclusion of the electronic partition functions of reactants and the transi-tion state.
FIG. 3. Equipotential energy contour diagrams of the3A⬙analytical PES for C⬁v共a兲, Cs共b兲, and C2v共c兲 geometries. The contours are depicted in
incre-ments of 10 kcal/mol, and the zero of energy is taken in reactants关N(4S)
⫹N⬘O兴.
FIG. 4. Schematic representation of the lowest MEP for both the3A⬙共a兲 and
the 3A⬘ 共b兲 analytical PESs. Energies are given relative to reactants 关N(4S)⫹NO兴 in kcal/mol.
Due to the presence of a minimum 共MIN1兲 in the MEP for reaction 共2兲 共Fig. 4兲, we have considered the following microscopic mechanism to determine its rate constant (k2):
N⫹N
⬘
O→ k2a ← k⫺2aMIN1→ k2b N⬘
⫹NO, 共11兲which is more properly applied to the 3A
⬘
PES, which pre-sents a more stable minimum and which as well will produce the most important contribution to the total k2. Theapplica-tion of the steady-state assumpapplica-tion to this type of mechanism40will give place to the velocity equation
v⫽d关NO兴
dt ⫽
k2ak2b
k⫺2a⫹k2b关N兴关N
⬘
O兴⫽k2关N兴关N⬘
O兴. 共12兲Due to k2b⫽k⫺2a, the final rate constant k2 becomes equal
to k2a/2. Hence VTST calculations determined firstly k2afor
each PES before calculating the total k2. The steady-state
approximation is valid for k2aⰆ(k⫺2a⫹k2b)⫽2k2b. 40
We have checked that this condition always fulfills in the present case 共e.g., for the3A
⬘
PES, k2b/k2a⬎1011 for all
tempera-tures兲.
For the reverse reaction共⫺1兲, we have also considered the corresponding oxygen atom spin-orbit states (3P2,3P1,
and3P0). Thus its electronic partition function is
QO共3P兲
elec
共T兲⫽g共3P
2兲⫹g共3P1兲e⫺⌬1/RT⫹g共3P0兲e⫺⌬0/RT,
共13兲 where g(i) represents the electronic degeneracy of each i spin-orbit state, which are equal to 5, 3, and 1, respectively, and⌬iare the energetic differences between the correspond-ing i excited electronic state and the ground electronic state, ⌬1(3P1–3P2) and⌬2(3P0–3P2), which are equal to 158.27
and 226.98 cm⫺1, respectively.1Therefore, k⫺1can be deter-mined by the equation
k⫺1⫽k⫺1共3A
⬙
兲⫹k⫺1共3A⬘
兲 ⫽ 3k⫺1⬘
共 3A⬙
兲⫹3k ⫺1⬘
共3A⬘
兲 共5⫹3e⫺227.7/T⫹e⫺326.6/T兲. 共14兲Table V shows the calculated VTST rate constants for reaction共1兲 using the present and previous PESs, comparing also with available experimental data. As was shown in pa-per I,24the estimated complete basis set limit for the energy barrier 共TS1兲 in 3A
⬘
PES is 6.74 kcal/mol. Thus a simple scale factor was introduced in the VTST calculations for this PES to better account for this value, instead of the value reproduced by the analytical PES共8.35.kcal/mol兲. The agree-ment with the experiagree-mental data when considering the new PESs is very good at low and also at very high temperatures. Previous PESs produce poorer rate constants 共see Table V兲, lower by a 10–15 factor at low temperatures and by a 1.2– 2.5 factor at high temperatures (T⬎1500 K). Comparing the rate constants arising from each PES, it is appreciated that the effect of the 3A⬘
is certainly minor. The contribution of this latter PES to the total rate constant is small even at hightemperatures 共e.g., only 10.8% at 2500 K兲. Therefore, the
influence of the inclusion of the scaled barrier is very small.
FIG. 5. Equipotential energy contour diagrams of the3A⬘analytical PES for C⬁v共a兲, Cs共b兲, and C2v共c兲 geometries. The contours are depicted in
incre-ments of 10 kcal/mol, and the zero of energy is taken in reactants关N(4S)
For instance, at 2500 K the value of k (3A
⬘
, with barrier not scaled兲 decreases only until 2.83⫻10⫺12cm3 molecule⫺1 s⫺1共cf. in Table V兲, which leads to almost the same total rate constant (3.46⫻10⫺11cm3molecule⫺1s⫺1). The key im-provement in the new theoretical rate constants arises from the new3A⬙
PES, which gives rate constants higher than the previous PES.15 In addition, Fig. 6共a兲 共note the enlarged scale in the k axis兲 shows the correct change of slope ascompared with the experimental data at low3,9 and high
temperatures,8 not properly described by using previous
PESs.
Nevertheless, there are some differences in comparison to another experimental data2,7which do not agree with the recommended experimental data,8,9although all of them are actually within a relatively small range of k values. The be-havior observed at low temperatures for reaction 共1兲 due to the3A
⬙
rate constant is not originated by tunnel effect共in all cases the transmission coefficient was equal to 1兲, as it should be expected for a barrierless reaction, but to the vi-brationally adiabatic effective energy barrier derived from the shape of the MEP at each temperature. A slight contribu-tion to the increase of k1 when the temperature decreases isalso originated by the temperature dependence of
QNO(2⌸)
elec
(T). This effect was also reported in a previous study,18 where QCT thermal rate constants were calculated with a different analytical3A
⬙
PES within the 200–1000 K interval. For these calculations, the introduction of this temperature-dependent statistical degeneracy factor was the only way to produce a positive slope in the Arrhenius plot. Moreover, these QCT rate constants were very similar to the present VTST ones, though for a shorter temperature range. For instance, using their QCT values for the 3A⬙
PES and Eq. 共10兲 关assuming that k(3A⬘
) is negligible for T ⬍1000 K] we obtain the following QCT values at 200, 300,and 1000 K: 4.24⫻10⫺11, 4.02⫻10⫺11, and 3.61⫻10⫺11 cm3molecule⫺1s⫺1, respectively 共cf. Table V兲. The major shortcoming of this earlier 3A
⬙
PES is its rathersemiempir-ical character and inability to describe reaction共2兲.
Table VI presents the VTST rate constants for reaction 共2兲, which are also displayed in Fig. 6共b兲. A three-parameter Kooij expression for k2 was used according to the following equation:
k⫽ATneB/T, 共15兲
where A, n, and B are parameters to be optimized by means of a least-squares procedure to fit the rate constants, as is given in Fig. 6共b兲. For this reaction with an important energy barrier, the small effect of the oxygen spin-orbit states is negligible. In this reaction the main contribution to the total rate constant is due to the 3A
⬘
PES, following an opposite behavior as for reaction 共1兲. Although k2 values are muchlower than the k1 values at low and moderate temperatures
(T⬍1000 K), the present results show that the O-abstraction channel accounts for 3.0% of the total reaction 关the branch-ing ratio k2/(k1⫹k2) being expressed in percentage兴 at 5000
K. This value is equal to the QCT value calculated for the similar reaction but with N(2D) 共Ref. 33兲 and a much lower
temperature 共1500 K兲. The addition of these values at high temperatures is in good agreement with the qualitative acces-sible experimental information, which indicates that this branching ratio ranges from 0% to 20% when increasing the nitrogen atom translational energy22,23 关possibly including
also N(2D) and N(2P)]. Although reaction 共2兲 involves
heavy atoms, the transmission coefficients calculated by the SCT method at different temperatures are high even at room temperature共e.g., 2.58 for3A
⬙
and 1.79 for the3A⬘
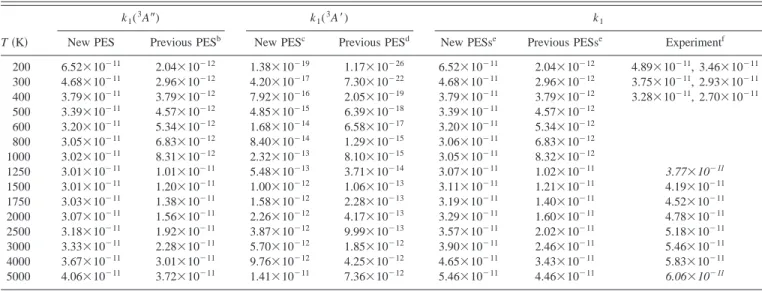
at 300 K兲 as was also found in similar studies.35,41TABLE V. Theoretical ICVT/OMT and experimental thermal rate constants for the N(4S)⫹NO(X2⌸)→O(3P)⫹N
2(X1⌺g⫹) reaction.
a
T共K兲
k1(3A⬙) k1(3A⬘) k1
New PES Previous PESb New PESc Previous PESd New PESse Previous PESse Experimentf
200 6.52⫻10⫺11 2.04⫻10⫺12 1.38⫻10⫺19 1.17⫻10⫺26 6.52⫻10⫺11 2.04⫻10⫺12 4.89⫻10⫺11, 3.46⫻10⫺11 300 4.68⫻10⫺11 2.96⫻10⫺12 4.20⫻10⫺17 7.30⫻10⫺22 4.68⫻10⫺11 2.96⫻10⫺12 3.75⫻10⫺11, 2.93⫻10⫺11 400 3.79⫻10⫺11 3.79⫻10⫺12 7.92⫻10⫺16 2.05⫻10⫺19 3.79⫻10⫺11 3.79⫻10⫺12 3.28⫻10⫺11, 2.70⫻10⫺11 500 3.39⫻10⫺11 4.57⫻10⫺12 4.85⫻10⫺15 6.39⫻10⫺18 3.39⫻10⫺11 4.57⫻10⫺12 600 3.20⫻10⫺11 5.34⫻10⫺12 1.68⫻10⫺14 6.58⫻10⫺17 3.20⫻10⫺11 5.34⫻10⫺12 800 3.05⫻10⫺11 6.83⫻10⫺12 8.40⫻10⫺14 1.29⫻10⫺15 3.06⫻10⫺11 6.83⫻10⫺12 1000 3.02⫻10⫺11 8.31⫻10⫺12 2.32⫻10⫺13 8.10⫻10⫺15 3.05⫻10⫺11 8.32⫻10⫺12 1250 3.01⫻10⫺11 1.01⫻10⫺11 5.48⫻10⫺13 3.71⫻10⫺14 3.07⫻10⫺11 1.02⫻10⫺11 3.77⫻10⫺11 1500 3.01⫻10⫺11 1.20⫻10⫺11 1.00⫻10⫺12 1.06⫻10⫺13 3.11⫻10⫺11 1.21⫻10⫺11 4.19⫻10⫺11 1750 3.03⫻10⫺11 1.38⫻10⫺11 1.58⫻10⫺12 2.28⫻10⫺13 3.19⫻10⫺11 1.40⫻10⫺11 4.52⫻10⫺11 2000 3.07⫻10⫺11 1.56⫻10⫺11 2.26⫻10⫺12 4.17⫻10⫺13 3.29⫻10⫺11 1.60⫻10⫺11 4.78⫻10⫺11 2500 3.18⫻10⫺11 1.92⫻10⫺11 3.87⫻10⫺12 9.99⫻10⫺13 3.57⫻10⫺11 2.02⫻10⫺11 5.18⫻10⫺11 3000 3.33⫻10⫺11 2.28⫻10⫺11 5.70⫻10⫺12 1.85⫻10⫺12 3.90⫻10⫺11 2.46⫻10⫺11 5.46⫻10⫺11 4000 3.67⫻10⫺11 3.01⫻10⫺11 9.76⫻10⫺12 4.25⫻10⫺12 4.65⫻10⫺11 3.43⫻10⫺11 5.83⫻10⫺11 5000 4.06⫻10⫺11 3.72⫻10⫺11 1.41⫻10⫺11 7.36⫻10⫺12 5.46⫻10⫺11 4.46⫻10⫺11 6.06⫻10⫺11 a
Rate constants are given in cm3molecule⫺1s⫺1. Transmission coefficientsare equal to 1 for3A⬙PES.
bUsing the PES of Ref. 15 and including the electronic statistical degeneracy factor. c
ICVT/OMT rate constants calculated on the3A⬘PES with an scaled energy barrier equal to 6.74 kcal/mol关the ab initio CBS limit 共Ref. 24兲兴.
dUsing the PES of Ref. 20 and including the electronic statistical degeneracy factor. e
The total theoretical rate constant k1is calculated using Eq.共10兲 and the data of the columns on the left. f
Data from Refs. 3 and 9共200–400 K兲 and from Ref. 8 共1500–4000 K兲. Italic numbers show two extrapolated values to allow additional comparison. Errors are indicated in Table I.
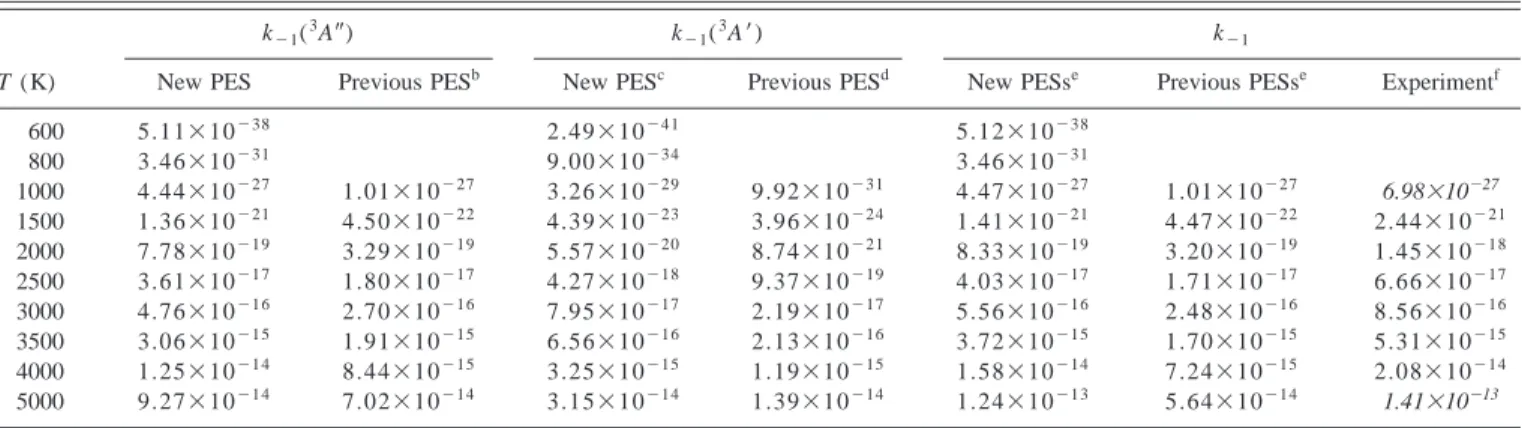
Finally, we have also computed the thermal rate con-stants for the reverse reaction共⫺1兲 due to the importance of
these kinetic data in computational fluid dynamics 共CFD兲
flow simulations for reentry vehicles in Earth’s atmosphere. Thus Fig. 7 and Table VII present the thermal rate constants
for each PES and the total rate constant. An excellent agree-ment with the experiagree-mental data8 共Table I兲 is found within the temperature interval 1500– 4000 K. The present results with the new PESs also slightly improve the kinetic data derived from previous PESs, as can be seen in Fig. 7. The calculated VTST values are almost independent of the small spin-orbit correction共Fig. 7兲. VTST rate constants at higher temperatures can also be compared with published QCT 共Ref. 20兲 values derived from our earlier3A
⬙
PES共Ref. 15兲and the previous 3A
⬘
PES 共Ref. 20兲, including the corre-sponding statistical degeneracy factor for each PES 共i.e., 3/9兲. This QCT study provided a three-parameter expressionFIG. 6. Arrhenius plots of the calculated and experimental thermal rate constants 共250–5000 K兲 for 共a兲 N(4S)⫹N⬘O (X2⌸)→O(3P)
⫹N2(X1⌺g⫹) reaction: ICVT/OMT values with the new analytical PESs
with共solid line兲 and without 共dashed line兲 spin-orbit correction. Dotted line shows the ICVT/OMT spin-orbit corrected values using the previous PESs
共Refs. 15 and 20兲. Experimental data showing a typical error bar: 䊊 共Ref. 7兲, 〫 共Ref. 2兲, 䉱 共Ref. 3兲, 䊏 共Ref. 9兲, and 䊐 共Ref. 8兲. 共b兲 N(4S)
⫹N⬘O (X2⌸)→N⬘(4S)⫹NO (X2⌸) reaction: ICVT/SCT values with the
new analytical PESs with共solid line兲 and without 共dashed line兲 spin-orbit correction. The A, B, and n optimal parameters关Eq. 共15兲兴 fitting the ICVT/
OMT spin-orbit corrected values with the new PESs are also indicated共k in cm3molecule⫺1s⫺1兲.
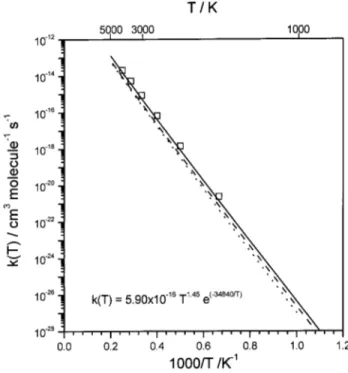
FIG. 7. Arrhenius plots of the calculated and experimental thermal rate constants 共1000–5000 K兲 for the O(3P)⫹N
2(X1⌺g⫹)→N(
4S)
⫹N⬘O (X2⌸) reaction: ICVT/OMT values with the new analytical PESs
with共solid line兲 and without 共dashed line兲 spin-orbit correction. Dotted line shows the ICVT/OMT spin-orbit corrected values using the previous PESs
共Refs. 15 and 20兲. Experimental data 共䊐兲 with an error lower than size
symbol from Ref. 8. The A, B, and n optimal parameters关Eq. 共15兲兴 fitting the ICVT/OMT spin-orbit corrected values with the new PESs are also indicated共k in cm3molecule⫺1s⫺1兲.
TABLE VI. Theoretical ICVT/SCT thermal rate constants for the N(4S)
⫹N⬘O(X2⌸)→N⬘(4S)⫹NO(X2⌸) reaction.a
T共K兲 k2( 3 A⬙) k2(3A⬘) k2b 200 5.13⫻10⫺54 7.30⫻10⫺39 7.30⫻10⫺39 300 2.53⫻10⫺40 3.31⫻10⫺30 3.31⫻10⫺30 400 2.38⫻10⫺33 8.65⫻10⫺26 8.65⫻10⫺26 500 4.04⫻10⫺29 4.20⫻10⫺23 4.20⫻10⫺23 1000 1.74⫻10⫺20 1.38⫻10⫺17 1.38⫻10⫺17 1500 1.66⫻10⫺17 1.18⫻10⫺15 1.20⫻10⫺15 2000 5.68⫻10⫺16 1.20⫻10⫺14 1.26⫻10⫺14 3000 2.21⫻10⫺14 1.38⫻10⫺13 1.60⫻10⫺13 4000 1.51⫻10⫺13 5.13⫻10⫺13 6.64⫻10⫺13 5000 5.02⫻10⫺13 1.19⫻10⫺12 1.69⫻10⫺12
aRate constants are given in cm3molecule⫺1s⫺1. b
The total theoretical rate constant k2is calculated using Eq.共10兲 and the
of k⫺1(T)⫽(9.45⫾0.32)⫻10⫺12⫻T0.42⫻e⫺42938⫾147/Tcm3
molecule⫺1s⫺1 for the 3000–20 000 K range. Using this
equation, we obtain the values of 1.66⫻10⫺16, 6.70
⫻10⫺15, and 6.30⫻10⫺14cm3molecule⫺1s⫺1 for 3000,
4000, and 5000 K, respectively. These QCT results are con-sistent with the calculated VTST results using these same PESs 共Table VII兲, which are worse than the present ones, particularly for higher temperatures. At 5000 K the reported QCT k(3A
⬙
)/k(3A⬘
) ratio20 was 15 as compared with the VTST value of 5.1 for both previous PESs, which differ from the small value共2.9兲 obtained with the new PESs. Therefore, we conclude that the excited PES (3A⬘
) must be included in kinetic and dynamic studies of reaction共⫺1兲 at temperatureslower than those predicted in the QCT study (T⬎8000 K).
Whereas the QCT k⫺1(3A
⬙
)/k⫺1(3A⬘
) ratio is 2 at 12 000 K, the same VTST value with the new PESs is obtained at 7800 K.QCT and quantum wave-packet dynamic studies using these new PESs are in progress in our group to provide more detailed information of the kinetics and dynamics of all re-action channels.
IV. CONCLUSIONS AND REMARKS
In this work we have built new analytical fits of the ground PES (3A
⬙
) and the excited PES (3A⬘
) involved in theN(4S)⫹NO(X2⌸) reaction 关N-abstraction 共1兲 and
O-abstraction 共2兲 channels兴 and also for the reverse, 共⫺1兲, using ab initio data reported in paper I 共Ref. 24兲 along with
new extensive grids of high-level ab initio points
关CASPT2共10,9兲 G2/cc-pVTZ calculations兴 computed in the present work. Diatomic De and Re spectroscopic data were also introduced to better account for the exoergicity of reac-tion 共1兲. The final RMSD for the 3A
⬙
surface was equal to 1.44 kcal/mol for the NN⬘
O region and 2.59 kcal/mol for theNON
⬘
region, with a global RMSD of 1.80 kcal/mol. Forthe 3A
⬘
surface, we obtained a final RMSD equal to 1.61kcal/mol for the NN
⬘
O region and 2.85 kcal/mol for theNON
⬘
region, with a global RMSD of 2.28 kcal/mol. TheseRMSDs were well below the estimated ab initio errors. Thermal rate constants were calculated for both direct reaction channels and for the reverse reaction by means of the variational transition-state theory with the inclusion of a semiclassical tunneling correction. Theoretical rate constants for reaction共1兲 were in excellent agreement with experimen-tal data at low to moderate and also at very high tempera-tures 共200–5000 K兲, significantly improving the results ob-tained by using previous PESs. The contribution of the 3A
⬘
PES to the total rate constant was small even at high
tem-peratures 共e.g., only 10.8% at 2500 K兲. The main
enhance-ment in the rate constants arises from the new 3A
⬙
PES,which gives rate constants higher than the previous PES.
The VTST calculation for reaction 共2兲 showed that the
main contribution to the total rate constant was due to the
3A
⬘
PES, differing from the behavior in reaction共1兲. Despitek2 values much lower than k1 values at low and moderate
temperatures (T⬍1000 K), the present results have shown
that the O-abstraction channel accounts for 3.0% of the total reaction at 5000 K, which is consistent with the limited available experimental information, which indicates that the branching ratio 关k2/(k1⫹k2)兴 should be between 0% and
20%, depending on the N-atom translational energy. Calculated VTST rate constants for the reverse reaction 共⫺1兲 were also in very good agreement with the experimen-tal data within the temperature interval 1500–5000 K. The present results with the new PESs also improved slightly the kinetic data derived by using the previous PESs. Hence the
3A
⬘
PES should be included in kinetic and dynamic studiesof this reverse reaction for temperatures much lower than those predicted in previous QCT studies, although its contri-bution to the total k⫺1 is low共e.g., 6.7% at 2000 K兲.
The new analytical PESs accurately describe the NNO
Cs regions and also the NON C2v and Cs regions, which
make them valuable for use in theoretical studies of all three reaction processes. Dynamic and kinetic studies with the new PESs using the QCT method and a quantum wave-packet
TABLE VII. Theoretical ICVT/OMT and experimental thermal rate constants for the O(3P)⫹N
2(X1⌺g⫹)→N(
4S)⫹NO(X2⌸)reaction.a
k⫺1(3A⬙) k⫺1(3A⬘) k⫺1
T (K) New PES Previous PESb New PESc Previous PESd New PESse Previous PESse Experimentf
600 5.11⫻10⫺38 2.49⫻10⫺41 5.12⫻10⫺38 800 3.46⫻10⫺31 9.00⫻10⫺34 3.46⫻10⫺31 1000 4.44⫻10⫺27 1.01⫻10⫺27 3.26⫻10⫺29 9.92⫻10⫺31 4.47⫻10⫺27 1.01⫻10⫺27 6.98⫻10⫺27 1500 1.36⫻10⫺21 4.50⫻10⫺22 4.39⫻10⫺23 3.96⫻10⫺24 1.41⫻10⫺21 4.47⫻10⫺22 2.44⫻10⫺21 2000 7.78⫻10⫺19 3.29⫻10⫺19 5.57⫻10⫺20 8.74⫻10⫺21 8.33⫻10⫺19 3.20⫻10⫺19 1.45⫻10⫺18 2500 3.61⫻10⫺17 1.80⫻10⫺17 4.27⫻10⫺18 9.37⫻10⫺19 4.03⫻10⫺17 1.71⫻10⫺17 6.66⫻10⫺17 3000 4.76⫻10⫺16 2.70⫻10⫺16 7.95⫻10⫺17 2.19⫻10⫺17 5.56⫻10⫺16 2.48⫻10⫺16 8.56⫻10⫺16 3500 3.06⫻10⫺15 1.91⫻10⫺15 6.56⫻10⫺16 2.13⫻10⫺16 3.72⫻10⫺15 1.70⫻10⫺15 5.31⫻10⫺15 4000 1.25⫻10⫺14 8.44⫻10⫺15 3.25⫻10⫺15 1.19⫻10⫺15 1.58⫻10⫺14 7.24⫻10⫺15 2.08⫻10⫺14 5000 9.27⫻10⫺14 7.02⫻10⫺14 3.15⫻10⫺14 1.39⫻10⫺14 1.24⫻10⫺13 5.64⫻10⫺14 1.41⫻10⫺13
aRate constants are given in cm⫺3 molecule⫺1 s⫺1. Transmission coefficientsare equal to 1 for3A⬙PES. bUsing the PES of Ref. 15 and including the electronic statistical degeneracy factor.
cICVT/OMT rate constants calculated on the3A⬘PES with a scaled energy barrier关for reaction 共1兲兴 equal to 6.74 kcal/mol 关the ab initio CBS limit
共Ref. 24兲兴.
d
Using the PES of Ref. 20 and including the electronic statistical degeneracy factor.
eThe total theoretical rate constant k
⫺1is calculated using Eq.共14兲 and the data of the columns on the left.
f
dynamic approach are in progress in our group to further study the reactions 共1兲 and 共2兲, especially regarding the dy-namical properties derived from each PES.
ACKNOWLEDGMENTS
This work has been supported by the Spanish Ministry
of Education and Culture 共Project No. PB98-1209-C02-01兲
and the Spanish Ministry of Science and Technology共Project
Nos. BQU2002-03351 and BQU2002-04269-C02-02兲.
Fi-nancial support from the European Union 共INTAS Project
No. 99-00701兲 and the ‘‘Generalitat’’ 共Autonomous Govern-ment兲 of Catalonia 共Project No. 2001SGR 00041兲 is also acknowledged. P.G. thanks the ‘‘Universitat de Barcelona’’ for a predoctoral research grant. The authors are grateful to the ‘‘Center de Computacio´ i Comunicacions de Catalunya
(C4-CESCA/CEPBA兲’’ for providing part of the computer
time. 1
M. W. Chase, Jr., C. A. Davies, J. R. Downey, Jr., D. J. Frurip, R. A. McDonald, and A. N. Syverud, J. Phys. Chem. Ref. Data Suppl. 14, 1 共1985兲.
2D. E. Siskind and D. W. Rusch, J. Geophys. Res. 97, 3209共1992兲. 3
P. O. Wennberg, J. G. Anderson, and D. K. Weisenstein, J. Geophys. Res.
99, 18 839共1994兲.
4P. Warneck, Chemistry of the Natural Atmosphere共Academic, San Diego,
1998兲, Chap. 3.
5G. Marston, Chem. Soc. Rev. 25, 33共1996兲. 6
T. Kurotaki, AIAA paper No. 2000-2366, 2000.
7M. A. A. Clyne and I. S. McDermid, J. Chem. Soc., Faraday Trans. 1 71,
2189共1975兲.
8D. L. Baulch, C. J. Cobos, R. A. Cox, G. Hayman, Th. Just, J. A. Kerr, T.
Murrells, M. J. Pilling, J. Troe, R. W. Walker, and J. Warnatz, J. Phys. Chem. Ref. Data 23, 847共1994兲.
9W. B. DeMore, D. M. Golden, R. F. Hampson, M. J. Kurylo, C. J.
Howard, A. R. Ravishankara, C. E. Kolb, and M. J. Molina, Chemical
Kinetics and Photochemical Data for Use in Stratospheric Modelling,
Evaluation 12, JPL Publ. 97-4共Jet Propulsion Laboratory, Pasadena, CA, 1997兲.
10G. Black, R. L. Sharpless, and T. G. Slanger, J. Chem. Phys. 58, 4792
共1973兲.
11
J. E. Morgan and H. I. Schiff, Can. J. Phys. 41, 903共1963兲.
12
J. E. Morgan, L. F. Phillips, and H. I. Schiff, Discuss. Faraday Soc. 33, 118共1962兲.
13M. Gilibert, A. Aguilar, M. Gonza´lez, F. Mota, and R. Sayo´s, J. Chem.
Phys. 97, 5542共1992兲.
14
S. P. Walch and R. L. Jaffe, J. Chem. Phys. 86, 6946共1987兲; AIP Docu-ment No. PAPSJCPSA-86-6946-10.
15M. Gilibert, A. Aguilar, M. Gonza´lez, and R. Sayo´s, J. Chem. Phys. 99,
1719共1993兲.
16A. Aguilar, M. Gilibert, X. Gime´nez, M. Gonza´lez, and R. Sayo´s, J.
Chem. Phys. 103, 4496共1995兲.
17R. Sayo´s, A. Aguilar, M. Gilibert, and M. Gonza´lez, J. Chem. Soc.,
Far-aday Trans. 1 89, 3223共1993兲.
18
J. W. Duff and R. D. Sharma, Geophys. Res. Lett. 23, 2777共1996兲.
19J. W. Duff and R. D. Sharma, Chem. Phys. Lett. 265, 404共1997兲. 20D. Bose and G. V. Candler, J. Chem. Phys. 104, 2825共1996兲. 21
D. Bose and G. V. Candler, J. Thermophys. Heat Transfer 10, 148共1996兲.
22J. Dubrin, C. Mackay, and R. Wolfgang, J. Chem. Phys. 44, 2208共1966兲. 23R. Iwata, A. Ferrieri, and A. P. Wolf, J. Phys. Chem. 90, 6722共1986兲. 24P. Gamallo, M. Gonza´lez, and R. Sayo´s, J. Chem. Phys. 118, 10602
共2003兲.
25
B. O. Roos, P. R. Taylor, and P. E. M. Siegbahn, Chem. Phys. 48, 157 共1980兲.
26B. O. Roos, in Advances in Chemical Physics: Ab Initio Methods in
Quan-tum Chemistry—II, edited by K. P. Lawley共Wiley, Chichester, 1987兲, Vol.
LXIX, p. 399.
27T. H. Dunning, Jr., J. Chem. Phys. 90, 1007共1989兲. 28
K. Andersson, Theor. Chim. Acta 91, 31共1995兲.
29K. Andersson, M. R. A. Blomberg, M. P. Fu¨lscher et al., computer code MOLCAS 4.1, Lund University, Sweden, 1998.
30
J. N. Murrell, S. Carter, S. C. Farantos, P. Huxley, and A. J. C. Varandas,
Molecular Potential Energy Surfaces共Wiley, New York, 1984兲.
31M. Gonza´lez and R. Sayo´s, computer code
DIATOMFIT共unpublished兲. 32R. Sayo´s and M. Gonza´lez, computer code
SM3FIT共unpublished兲. 33M. Gonza´lez, R. Valero, and R. Sayo´s, J. Chem. Phys. 113, 10 983共2000兲. 34
M. Gonza´lez, I. Miquel, and R. Sayo´s, J. Chem. Phys. 115, 2530共2001兲.
35R. Sayo´s, C. Oliva, and M. Gonza´lez, J. Chem. Phys. 117, 670共2002兲. 36K. P. Huber and G. Herzberg, Molecular Spectra and Molecular Structure
IV. Constants of Diatomic Molecules共Van Nostrand Reinhold, New York,
1979兲.
37
R. Sayo´s, C. Oliva, and M. Gonza´lez, J. Chem. Phys. 115, 1287共2001兲.
38D. G. Truhlar, B. C. Garrett, and S. J. Klippenstein, J. Phys. Chem. 100,
12 771共1996兲.
39R. Steckler, Y. Chuang, E. L. Coitin˜o, W. Hu, Y. Liu, G. C. Lynch, K. A.
Nguyen, C. F. Jackels, M. Z. Gu, I. Rossi, P. Fast, S. Clayton, V. S. Melissas, B. C. Garrett, A. D. Isaacson, and D. G. Truhlar, computer code
POLYRATE, version 7.0, Department of Chemistry and Supercomputer In-stitute, University of Minnesota, 1996.
40G. I. Gellene, J. Chem. Educ. 72, 196共1995兲. 41
R. Sayo´s, J. Hijazo, M. Gilibert, and M. Gonza´lez, Chem. Phys. Lett. 284, 101共1998兲.