A systematic density functional theory study of the electronic structure
of bulk and
„
001
…
surface of transition-metals carbides
F. Viñes and C. Sousa
Departament de Química Física & Centre especial de Recerca en Química Teòrica, Universitat de Barcelona & Parc Científic de Barcelona, C/ Martí i Franquès 1, 08028 Barcelona, Spain
P. Liu and J. A. Rodriguez
Department of Chemistry, Brookhaven National Laboratory, Bldg. 555, Upton, New York 11973
F. Illasa兲
Departament de Química Física & Centre especial de Recerca en Química Teòrica, Universitat de Barcelona & Parc Científic de Barcelona, C/ Martí i Franquès 1, 08028 Barcelona, Spain 共Received 29 November 2004; accepted 16 February 2005; published online 5 May 2005兲
A systematic study of the bulk and surface geometrical and electronic properties of a series of
transition-metal carbides 共TMC with TM=Ti, V, Zr, Nb, Mo, Hf, Ta, and W兲 by first-principles
methods is presented. It is shown that in these materials the chemical bonding is strongly covalent, the cohesive energies being directly related to the bonding-antibonding gap although the shift of the center of the C共2s兲 band related peak in the density of states with respect to diamond indicates that
some metal to carbon charge transfer does also take place. The共001兲 face of these metal carbides
exhibits a noticeable surface rumpling which grows along the series. It is shown that neglecting surface relaxation results in very large errors on the surface energy and work function. The surface formation induces a significant shift of electronic energy levels with respect to the corresponding values in the bulk. The extent and nature of the shift can be understood from simple bonding-antibonding arguments and is enhanced by the structural rippling of this surface. © 2005 American Institute of Physics.关DOI: 10.1063/1.1888370兴
I. INTRODUCTION
Transition-metal carbides exhibit broad and amazing
physical and chemical properties.1 Their properties may be
viewed as resulting from a combination of those of covalent solids, ionic crystals, and transition metals. Thus, they ex-hibit extreme hardness and brittleness as diamond and other covalent solids, very high melting points and simple crystal structures such as many ionic compounds, and electrical and thermal conductivities typical of metals. The curious behav-ior of metal carbides makes these materials very attractive from the fundamental and technological point of views.1For
example, transition-metal carbides共TMC兲 are being used
in-creasingly in heterogeneous catalysis because in many as-pects they display a chemical behavior which is reminiscent of platinum and other transition metals such as Pd, Ru, or Rh but in addition exhibit important advantages over these bulk transition metals in activity, selectivity, and resistance to
poi-soning, especially by sulfur.2 In some reactions, the TMC
can also equal or surpass the catalytic activity of the precious metals. They can catalyze reactions of hydrogenation and dehydrogenation, hydrolysis isomerization, hydrodesulfur-ization, and hydrodenitrogenation.3
The electronic structure and chemical bonding in bulk transition-metal carbides have been studied by experimental
techniques, mainly X-ray photoemission4and more recently
by near edge X-ray absorption fine structure 共NEXAFS兲
spectroscopies5 and also by theoretical methods. However,
the amount of information is quite limited and sometimes contradictory. A key issue of these studies concerns the
de-gree of charge transfer between metal and carbon atoms.6,7
All studies indicate a certain amount of charge transfer from the metal to the carbon which is evidenced by clear shifts on the relevant bands. However, it is difficult to relate these shifts with the actual extent of the charge transfer.8Gruzalski and Zehner have shown that in bulk TaC and HfC, the direc-tion of the metal core-levels shifts is different.9Surface core-level shifts with respect to the bulk have been observed on most metal surfaces,10–13 although there is almost no infor-mation for the corresponding carbides except for TiC. For
TiC, density functional theory 共DFT兲 calculations based on
the local density approximation共LDA兲 suggest that there is
no bulk-surface core-level shift for the C共1s兲 level and that for the Ti共2s兲 level it is of ⬃0.05 eV only.14 However, the predicted lack of a shift for the C共1s兲 core level is not con-sistent with subsequent photoemission experiments where a small surface-to-bulk core-level shift has been measured
from the deconvolution of the experimental peak.15 Careful
theoretical analyses reveal that the final surface-to-bulk core-level shift arises from the cancellation of various effects and, hence, is quite often of⬃0.5 eV or even smaller.8,16 There-fore, more precise experimental data would require the use of high-resolution core-level spectroscopy exploiting the prop-erties of synchroton radiation.
Concerning the nature of the chemical bond, different
a兲Author to whom correspondence should be addressed. Electronic mail:
bonding mechanisms have been discussed by various au-thors. In his comprehensive review, Chen3comments that the ionicity decreases along the series—ZrC more ionic than MoC—and that the bonding involves three main contribu-tions. A metallic one arising from the rearrangement of the metal-metal bonds, a covalent part due to the formation of typical chemical bonds between metal and nonmetal atoms, and a third contribution from ionic bonding arising from the metal-to-carbon charge transfer. However, it is very difficult to extract information concerning the extent of each of these contributions by experimental techniques. This kind of infor-mation can better be obtained by electronic structure calcu-lations. Based on full-potential linear muffin-tin orbital 共FP-LMTO兲 DFT calculations within the generalized gradient
approximation 共GGA兲, Djellouli and Aourag17 decompose
the density of states 共DOS兲 of TiC into three well separated
regions, one clearly dominated by the C共2s兲 orbitals, one
bonding region 共hybridization of d-metal orbitals with
p-carbon orbitals兲, and the corresponding antibonding region just above the Fermi level, dominated by the metal d states but with small degree of hybridized p-carbon states. These results are also similar to those reported earlier by Häglund et al.18–24and more recently by Hugosson et al.,25,26the later focusing as well on the electronic structure of metal carbide surfaces. These studies are also based on the use of the LMTO basis but within the LDA method. Furthermore,
Djel-louli and Aourag17 propose a model for TiC where the
chemical bond is different depending on the crystal direction: mainly covalent in the关001兴 but ionic along the 关111兴 direc-tions with significant charge transfer from the metal to the carbon. This is difficult to rationalize due to the symmetric rock-salt structure of TiC. However, this interpretation arises from the analysis of the electron density maps, a property which provides important qualitative information but which otherwise is difficult to use in a more quantitative way.
Zhukov and Gubanov27 use a similar approach and
decom-pose the bulk modulus B0 in contributions of the main
fea-tures of the band structure. Zhang et al. have reported a study of the decomposition of cohesive energies of 3d carbides on different bonding contributions.28Finally, for metal carbides of cubic structure, a direct correlation between core-level shifts and B0has been reported.
29
Transition-metal carbide surfaces have been character-ized experimentally through various surface science
tech-niques 共LEED, XPS, STM, etc.兲. The stability of the three
low-index surfaces has been studied in detail for TiC30and it was concluded that the共001兲 surface is the most stable one, the共111兲 surface is metal terminated and that the 共110兲 sur-face does not exist because of the formation of microscopic
共310兲 oriented facets. Early impact collision ion scattering
spectroscopy 共ICISS兲 experiments carried out for TiC共001兲
did not reveal significant rippling of the surfaces31 although
later experiments on TaC共001兲32 show a clear displacement
of the carbon atoms outwards to the vacuum accompanied by an inwards relaxation of the Ta atoms. Recent LEED experi-ments on TiC共001兲 have also found evidence of a significant
relaxation33 and the same trend is observed in
high-resolution medium-energy ion scattering spectroscopy car-ried out for both TiC共001兲 and TaC共001兲.34This surface
rum-pling has later been confirmed by LDA calculations using a
FP-LMTO basis set.35,36 Further experimental efforts have
focused on determining if rippling takes place on other car-bides such as HfC37although, apart from the recent work of
Hugosson et al.26 on the unrelaxed 共001兲 surface of a wide
series of transition-metal carbides, there is no experimental
or theoretical information for the 共001兲 surface of other
transition-metal carbide surfaces.
In the present work we describe the crystal and elec-tronic structures of a series of TMC having a 1:1 stoichiom-etry. In order to investigate trends in a systematic way, three different groups of transition-metal elements have been cho-sen. These are group 4共Ti, Zr, Hf兲, group 5 共V, Nb, Ta兲, and
group 6共Cr, Mo, W兲. For most of the carbides under
consid-eration共TiC, VC, ZrC, NbC, HfC, and TaC兲, the most stable
phase corresponds to a fcc crystal packing; for MoC various
stable phases exist and the ␦-MoC, although not being the
most stable phase, has been chosen because it displays also a
fcc structure. The tungsten carbide 共WC兲 has been included
in spite of exhibiting a distorted hexagonal close packed structure. Finally, chromium carbide has been excluded be-cause it does not exhibit any phase with CrC stoichiometry. In a first step, bulk properties such as lattice parameter, bulk modulus, and electronic structure are calculated, whereas in a second step the electronic and geometric structure of the
共001兲 surface is investigated in detail including surface
for-mation energies and work functions. In particular, the influ-ence of surface relaxation on these properties is stressed.
II. METHOD OF CALCULATION
The calculations were carried out in the framework of DFT within the GGA. All electron calculations were carried out with the DMol3 code,38
while frozen core calculations were performed with a parallel version of VASP4.5
code.39–41Two different implementations of the GGA were
used: the exchange-correlation functional proposed by Per-dew et al.,42 hereafter referred to as PW91, and the revised version of the Perdew–Burke–Ernzerhof functional,43usually
referred to as RPBE.44In the PW91 calculations with VASP,
a plane-wave basis set was used to span the valence elec-tronic states and the core electrons were represented by the
projected augmented wave 共PAW兲 method of Blöchl.45 This
can be regarded as an all-electron frozen core method, which combines the accuracy of an all electron description with the computational simplicity of the pseudopotential approach,
especially in the implementation of Kresse and Joubert.46
This representation of the core states allows one to obtain converged results with a cutoff kinetic energy of 415 eV for the plane-wave basis set. A Monkhorst–Pack grid has been used to select the special k points necessary to carry out numerical integrations in the reciprocal space. The number of k points in each direction has been adapted for each sys-tem, until total energies computed with increasing sets of k points differ by less than 0.01 eV. The meshes used vary
from 11⫻11⫻11 to 17⫻17⫻17 for bulk carbides and from
9⫻9⫻1 to 13⫻13⫻1 for the different 共001兲 surfaces. The choice of odd numbers in the k-point grids is just for com-putational convenience. In this way, the high symmetry,
points coincide with some of the k points on the Monkhorst– Pack grid. No point group symmetry constraints are imposed in the calculations.
A second set of periodic calculations has been carried out for selected systems using the RPBE functionals, which, in principle, is thought to provide more accurate adsorption energies. The RPBE calculations have been carried out using a numerical basis of double-quality plus polarization
func-tions 共DND in our notation兲 reported by Delley.47,48 These
calculations have been carried out using the DMol3
compu-tational code and a Brillouin unit cell of 21 k points along the most symmetric directions. However, even if the RPBE func-tional seems to provide adsorption energies closer to
experi-ment than those obtained by the PW91 functional,44 it has
also been pointed out that it tends to lead to worse results for bulk properties such as lattice parameters and bulk moduli.49 Moreover, there are examples where the RPBE functional may even overcorrect adsorption energies, thus predicting incorrect adsorption energies.50 Therefore, a comparison of results obtained using both PW91 and RPBE seems very convenient.
For the bulk, structural optimization was performed us-ing a conjugated gradient technique in which the iterative relaxation of atomic positions was stopped when the change in the total energy between successive steps was less than 0.001 eV. With this criterion, forces on the atoms are gener-ally smaller than 0.1 eV/ Å. Once the lattice parameter was
determined for each carbide, a model for the 共001兲 surface
has been constructed using a slab model approach. In this approach one uses a unit cell which is repeated periodically in two dimensions while it has a finite extent in the third one. In order to use the plane-wave basis set which is periodic in nature the corresponding slab is repeated in the third direc-tion with the slabs separated by a sufficiently wide vacuum region. The vacuum width was progressively increased until energy variations were not significant. A vacuum width of 10 Å proved to be good enough for the present purposes.
Slab models having four 共Slab-4兲 or eight 共Slab-8兲 atomic
layers were tested and the three or four outermost atomic layers, respectively, were fully relaxed using the optimiza-tion procedure outlined above. Hence, the remaining atomic layers—one for Slab-4 and four for Slab-8—were fixed at the bulk geometry. The Slab-4 still exhibits some minor edge effects in the third direction, so that most of the discussion will focus on the results obtained with Slab-8. Nevertheless, the Slab-4 has also been used for comparison purposes, mainly to investigate the differences between the two differ-ent computational methods.
III. GEOMETRY AND ELECTRONIC STRUCTURE OF BULK METAL CARBIDES
The fcc crystal packing of most of the metal carbides studied in the present work—TiC, ZrC, HfC, VC, NbC, TaC,
and␦-MoC—results from an ABC layer stacking. This work
focus on the 共001兲 surface, which has the same amount of
metal and carbon atoms. However, WC presents a distorted hcp packing since the WC structure is made of alternating
共001兲 layers of metal and carbon atoms.
In a first step, the geometry optimization of each transition-metal carbide has been carried out; both the coor-dinates of the atoms in the unit cell and the unit cell param-eter were allowed to relax. From the final geometric data the
bulk modulus B0was computed as in Eq.共1兲,
B0= − V
冉
P
V
冊
共1兲making use of one of the features of VASP which, for a given unit cell volume, provides the equivalent external pressure from the corresponding analytical energy gradient.
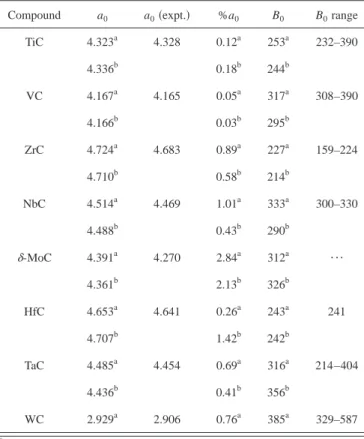
The lattice parameter a0 and B0 values are reported in
Table I and compared with available experimental data. Ex-perimental cell parameters have been taken from the inor-ganic crystal structure database 共ICSD兲.51 In all cases, we
found that the calculated a0 values, both PW91 and RPBE,
are in excellent agreement with experiment, the largest
de-viations being always less than 1% except for the ␦-MoC
where a somehow larger deviation is found. Interestingly enough, both functionals provide similar results with small, albeit erratic, deviations from experiment.
Due to the uncontrolled amount of vacancies in these refractory materials, experimental B0 values are scattered in
a rather broad range,52,53 and may also be affected by the
temperature. This does not allow a direct comparison with the calculated data共Table I兲 although it appears that all
cal-TABLE I. Calculated and experimental values for the lattice parameter共a0
and a0expt.兲, calculated and range of experimental values of the bulk
modu-lus共B0and B0expt., respectively兲 and the relative errors 共%a0兲 given in
percent. Distances are in angstrom and bulk modulus in GPa. Notice that except for WC the metal-carbon distance is just a0/ 2 whereas for the former
is 1.34a0.
Compound a0 a0共expt.兲 %a0 B0 B0range
TiC 4.323a 4.328 0.12a 253a 232–390 4.336b 0.18b 244b VC 4.167a 4.165 0.05a 317a 308–390 4.166b 0.03b 295b ZrC 4.724a 4.683 0.89a 227a 159–224 4.710b 0.58b 214b NbC 4.514a 4.469 1.01a 333a 300–330 4.488b 0.43b 290b ␦-MoC 4.391a 4.270 2.84a 312a ¯ 4.361b 2.13b 326b HfC 4.653a 4.641 0.26a 243a 241 4.707b 1.42b 242b TaC 4.485a 4.454 0.69a 316a 214–404 4.436b 0.41b 356b WC 2.929a 2.906 0.76a 385a 329–587 a PW91 values. b RPBE values.
culated values are within the experimental range. However, note that for TiC the calculated values are both close to
gen-erally accepted experimental value of⬃233 GPa. Moreover,
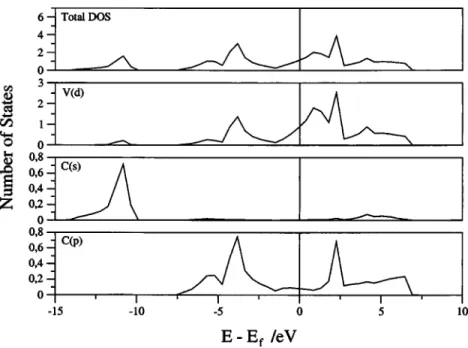
for NbC, the present results are in very good agreement with the accurate FP-LAPW recent calculations of Amriou et al.54 In order to investigate the electronic structure of the metal carbides studied in the present work we make use of the corresponding DOS, scaled to the Fermi level. The DOS of the different carbides exhibit similar features, the corre-sponding plot for TiC is given in Fig. 1. The projection of the DOS on the atomic components permits to decompose the main contributions to the chemical bonding. Here it is im-portant to remark that because of the use of a plane-wave basis set the projection into local atomic states is not straightforward. In the present work the projected DOS is obtained using harmonic spherical functions in a given atomic radius and hence, although qualitatively correct, it is somehow arbitrary. Here, the radii of the atomic spheres used to carry out the integration of the projected DOS were the VASP standard internal values. An alternative representation can be obtained by means of the numerical basis calculations although this does also have a certain degree of arbitrariness. However, the DOS is mainly used for interpretation and it is unlikely that the qualitative description will change.
For TiC, a sharp peak at ⬃−33.5 eV corresponding to
the Ti共3p兲 orbitals appears, which is not shown in the corre-sponding figures. Clearly, these orbitals do not contribute to the bonding. The next peak appears at⬃−9.5 eV, it is rather
sharp and mainly of C共2s兲 character although with some
Ti共3d兲 character; this peak is sufficiently far from the Fermi level so that it can also be considered as essentially nonbond-ing. Just below the Fermi level a very broad structure with two well defined main peaks shows up corresponding to a mixing of Ti共3d兲 and C共2p兲 orbitals. These peaks correspond to the bonding states, and their antibonding counterparts ap-pear just above the Fermi level. These bonding and antibond-ing peaks exhibit a clear mixantibond-ing of metal 3d and carbon 2p states although the latter has a stronger Ti共3d兲 character.
Thus, the present results are in agreement with the previous
DFT results based on a LMTO basis set.17,18The DOS for
the other metal carbides studied in the present work are very similar; almost in all the cases, there are significant amounts of states on the Fermi level in agreement with the conducting nature of these materials. The main difference in the metal-carbide DOS appears in the relative position of the Fermi level between the bonding and antibonding states and three different patterns can be distinguished. In group 4 TMCs
共TiC, ZrC, and HfC兲 and also in WC, the Fermi level is
placed almost at the middle of the gap between the bonding and antibonding state共Fig. 1兲. Note that the behavior of WC is due to its different crystal structure which results in a DOS which is reminiscent of that of the group 4 carbides. In VC and TaC the extra electron shifts upwards the Fermi level
making them better conducting materials共Fig. 2兲. The same
happens in NbC but in this case the metal 5s band is well within the Fermi level; this is also the case for␦-MoC共Fig. 3兲. This feature is not observed in the FP-LAPW of Amriou et al. since only projection onto the Nb共4d兲 and C共2s,2p兲 is reported. Nevertheless, these authors claim that the Nb共5s兲 band is vey high in energy due to the repulsion with the C共2s兲 state. However, one must realize that the correspond-ing states are partially hybridized and not atomically pure. Moreover, this feature is as expected from the Nb 5s-shell partial occupancy of atomic Mo and Nb.
The analysis of the DOS provides useful information about the covalent contributions to the chemical bond but does not permit one to evaluate the importance of ionic con-tributions. A possibility consists in using some kind of popu-lation analysis but this is rather difficult when using a plane-wave basis set and always arbitrary when using a localized basis set due to the subjective partition of the overlap popu-lations. A possible, although quite qualitative, alternative is to investigate the relative position of the center of a particu-lar band, deep enough to be considered as nearly atomic, and its shift with respect to a given reference. Here, it is neces-sary to point out that energy level shifts are caused by a
FIG. 1. Total and projected density of states共DOS兲 for bulk TiC as obtained from the plane-wave PW91 calcula-tions. Note that different scales are used for the projected DOS to facili-tate the interpretation.
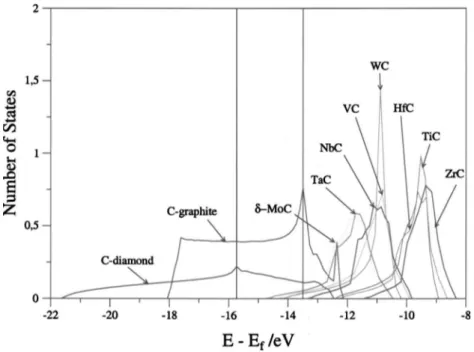
variety of physical phenomena, charge transfer among them. Although the latter is in many cases the dominant effect, the remaining contributions cannot be neglected. Hence, it is very difficult to extract charges from core-level shifts. Nev-ertheless, comparison of core-level shifts along a series of similar compounds in similar conditions can provide a rea-sonable qualitative trend for charge redistribution. To this end, we find it appropriate to compare the center of the C共2s兲 band of the different carbides relative to the Fermi level with the corresponding value for bulk diamond which can be con-sidered as a prototype of a pure covalent solid 共Fig. 4兲 and for bulk graphite which exhibits a metallic like, delocalized
electron density. There are various important features
which emerge from the comparison of the C共2s兲 levels. First, the C共2s兲 peak for the carbides is much narrower than that of diamond and graphite indicating that the electrons are more localized. Second, in the carbides the C共2s兲 is shifted to-wards lower binding energies, this suggests a more
nega-tively charged C atoms. These two features are consistent with a non-negligible ionic contribution to the chemical bond. Note that TiC, ZrC, and HfC exhibit the largest shift with respect to diamond. According to the interpretation above, the ionicity of these materials decreases along the series in agreement with charge-transfer arguments estimated from XPS and NEXAFS core-level shifts. Interestingly enough, this interpretation is also supported by the net charges on the metal atoms estimated from the Mulliken population analysis carried out using the all electron DND
localized basis set and the RPBE method共Table II兲.
The next important point involves the cohesive energies of the different metal carbides. The cohesive energy Ecohis defined as the difference between the energy of the con-densed system and that of the atoms in the vacuum. In this
case there are only two atoms per unit cell共one C and one
metal兲 and therefore Ecoh is simply the difference between
the energy per unit cell and the energy of the carbon and of
FIG. 2. Total and projected DOS for bulk VC as obtained from the PW91 plane-wave calculations. Notice that different scales are used for the pro-jected DOS to facilitate the interpretation.
FIG. 3. Total and projected DOS for bulk ␦-MoC as obtained from the PW91 plane-wave calculations. Notice that different scales are used for the projected DOS to facilitate the interpretation.
the metal atom; note that within this definition Ecohis
nega-tive. The summary of Ecoh values is reported in Table II
together with experimental values and those previously
re-ported from LMTO/LDA calculations.19,21The present GGA
values, either PW91 or RPBE, are in good agreement with experiment with deviations which, in general, do not exceed
0.5 eV. The improvement on the Ecoh values over previous
LMTO/LDA calculations—with deviations with respect to experiment that in some cases are larger than 3 eV—is really clear. Nevertheless, one has to be aware that the atomic en-ergies have been calculated placing the atom in a box sur-rounded by a sufficiently large vacuum width. Hence, the total angular space and spin moments are not well defined, the multiplet structure is lost and the only information about the atomic state is the electronic configuration. Previous work has shown that the GGA predicted ground state elec-tronic configuration of the different transition-metal atoms is in agreement with experiment except for Ni and V, for fur-ther details see Refs. 55 and 56. The Ecohvalues, either cal-culated or experimental, increase along the group but do not show any particular trend along the series. In order to try to understand the origin of the different stability and its
rela-tionship with the electronic structure various correlations be-tween Ecohand electronic structure parameters have been
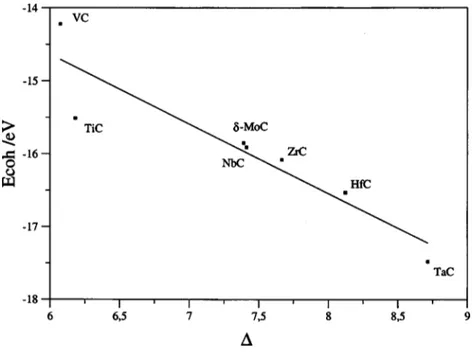
in-vestigated. No relation between the cohesive energy and either the peak positions, the cell parameter, or the centre of the metal d band has been found. However, for fcc TMC, it is found that Ecohvaries almost linearly with the energy
sepa-ration between the centers of the bonding and antibonding peaks in the DOS共Fig. 5兲. The center of each peak is defined as the position at which the integral of the DOS is half that of the total value for the peak. Therefore, the relative stability of the metal carbides is dominated by the bonding-antibonding splitting. This would seem to indicate that cova-lent effects play a dominant role. However, one must realize that the bonding-antibonding splitting is not symmetric and hence accounts as well for ionic contributions. Nevertheless, the linear behavior in Fig. 5 would seem to indicate that in spite of the fact that the chemical bond in these carbides has metallic, ionic, and covalent contributions, the latter grossly explains the relative order of stabilities. Moreover, one can-not claim that it is dominated by the covalent contribution since the C共2s兲 energy level shifts indicate the presence of non-negligible charge transfer. This is in agreement with a
FIG. 4. 共Color online兲 Position of the C共2s兲 peaks of the different metal car-bides studied in the present work rela-tive to the Fermi level of each system. The corresponding peak for diamond is added for comparison.
TABLE II. Experimental, PW91, and RPBE calculated absolute values of the cohesive energy of groups 4, 5, and 6 metal carbides. The two rightmost columns contain the energy difference between bonding and antibond-ing peaks in the DOS 共see Figs. 1–3兲 and the net charge in the metal atom 共in atomic units兲, respectively. Experimental共Refs. 27 and 58–61兲 and previous LMTO/LDA values of the cohesive energy are included for comparison共Refs. 19–21兲. All energy values are in eV.
Compound 兩Ecoh兩 共expt.兲 兩Ecoh兩 共PW91兲 兩Ecoh兩 共RPBE兲 兩Ecoh兩 共LDA兲 ⌬ qM
TiC 14.31± 0.14 15.11 14.48 18.29 6.182 1.14 VC 13.88± 0.16 14.22 14.22 17.44 6.074 1.00 ZrC 15.86± 0.19 16.08 15.37 17.69 7.666 1.29 NbC 16.52± 0.19 15.91 15.27 17.25 7.412 1.23 ␦-MoC 14.45± 0.19 15.85 14.42 15.78 7.392 1.14 HfC 16.22± 0.16 16.53 15.74 8.122 1.34 TaC 17.12± 0.14 17.48 17.23 8.715 1.37 WC 16.49± 0.22 16.67 ¯ 5.453
significant charge on the metal atom as predicted from the RPBE calculations carried out in a local basis set although
the difference between compounds is rather small共see Table
II兲.
IV. GEOMETRY AND ELECTRONIC STRUCTURE OF THE METAL CARBIDES„001…SURFACE
Two different slab models have been used to simulate the共001兲 surface of the metal carbides studied in the present work, these are the Slab-4 and Slab-8 models described in Sec. II. Both models exhibit a surface made of mixed squares of metal and carbon atoms, and hence the surface composi-tion respects the bulk stoichiometry. In the Slab-4 model the three outermost atomic layers have been allowed to relax in the 关001兴 direction while keeping the fourth one fixed to
mimic the bulk. In the Slab-8 models the same strategy is used but now four atomic layers are relaxed and four are fixed. The interlayer distances for the relaxed structures are given in Table III for the Slab-4 model. Since the metal and carbon atoms of a given atomic layer can relax in a slightly
different way—rumpling—we use n and n
⬘
to define thecar-bon and metal atoms of the n atomic layer. Therefore, dnn⬘
corresponds to the rumpling of the n atomic layer whereas dn⬘共n+1兲corresponds to the minimum distance between atoms
in different layers 共see Fig. 6兲. For the Slab-4 model, the
GGA calculated values obtained using either the all electron or the PAW implementations, and using the RPBE or PW91 exchange-correlation potentials, respectively, are in very
good agreement except for␦-MoC and TaC where the latter
approach predicts a slightly larger rumpling effect in the
sec-FIG. 5. 共Color online兲 Calculated co-hesive energy vs the bonding-antibonding splitting共see Ecoh and⌬
in Table III兲.
TABLE III. Intralayer and interlayer atomic perpendicular distances共in angstrom兲 obtained with the Slab-4 model and at the PW91 and RPBE levels of theory.
n and n⬘define the carbon and metal atoms of the n atomic layer, dnn⬘ corresponds to the rumpling of the n atomic layer, whereas dn⬘共n+1兲corresponds to the
minimum distance between atoms in different layers. The percent rumpling is also indicated for comparison.
TiC共001兲 VC共001兲 ZrC共001兲 NbC共001兲 ␦-MoC共001兲 HfC共001兲 TaC共001兲
d11⬘ 0.14共6.5%兲 a 0.11共4.7%兲a 0.20共9.0%兲a 0.11共5.1%兲b 0.17共8.2%兲b 0.08共3.4%兲b 0.17共7.6%兲b 0.24共10.9%兲b 0.08共3.4%兲b 0.22共9.8%兲b 0.10共4.6%兲c 0.17共8.2%兲c 0.05共2.1%兲c 0.16共7.1%兲c 0.26共11.8%兲c 0.06共2.6%兲c 0.19共8.5%兲c d22⬘ 0.03共1.4%兲 a 0.03共1.3%兲a 0.04共1.8%兲a 0.03共1.4%兲b 0.09共4.3%兲b 0.03共1.3%兲b 0.12共5.3%兲b 0.05共2.3%兲b 0.03共1.3%兲b 0.16共7.1%兲b 0.01共0.5%兲c 0.10共4.8%兲c 0.03共1.3%兲c 0.13共5.8%兲c 0.01共0.5%兲c 0.03共1.3%兲c 0.08共3.6%兲c d33⬘ −0.03共−1.4%兲 b −0.09共−4.3%兲b −0.03共−1.3%兲b −0.14共−6.2%兲b −0.06共−2.7%兲b −0.03共−1.3%兲b −0.17共−7.6%兲b d12⬘ 2.25 a 2.36a 2.32a 2.22b 2.18b 2.38b 2.36b 2.29b 2.34b 2.44b 2.20c 2.20c 2.36c 2.37c 2.31c 2.37c 2.42c d1⬘2 2.14 a 2.22a 2.08a 2.09b 1.92b 2.27b 2.07b 2.01b 2.21b 2.07b 2.09c 1.93c 2.28c 2.07c 2.05c 2.28c 2.14c a
Experimental values within accuracy of ±0.03 Å共Refs. 32, 33, and 37兲.
b
PW91 values.
c
ond atomic layer. In any case, it is worth to point out that only the outermost atomic layers exhibit a significant rum-pling. Hence, values for the rumpling of the innermost atomic layers are not reported in Table III. The results dis-cussed below evidence that surface relaxation is important and should not be neglected. Nevertheless, values for the unrelaxed surfaces, even if somehow unphysical, are re-ported precisely to highlight the importance of surface relax-ation effects.
The agreement between the two different approaches for the Slab-4 model permits to use the computationally more efficient plane-wave basis with the PAW description of the core electrons to study the influence of the slab thickness on the surface final geometry. The results for the rumpling effect are presented in Table IV using the same definitions as for Table III. The relaxation and rumpling values for the first layer are very similar for the Slab-4 and Slab-8 models. In contrast, the relaxation and rumpling values for the second and third atomic layers predicted by the Slab-8 models are noticeably smaller than the values predicted by the Slab-4 model. This result is important and implies that predictions from rather thin metal-carbide layers have to be handled with caution. In fact, the origin of these differences is the lack of enough bulk material below the relaxed atomic layers.
Re-sults from Table IV show that the rumpling effect grows from group 4 to group 6 whereas along the groups no clear trends exist. Hence, the extent of intralayer relaxation seems to be driven by the number of metal d electrons. Unfortu-nately, comparison to experiment is only possible for TiC共001兲 and TaC共001兲. From a qualitative point of view the present calculations are in agreement with experimental evi-dence showing an outward relaxation of C atoms and an inward relaxation of the metal atoms.32–34,37 Moreover, the
present results for TiC共001兲 and TaC共001兲 are in excellent
agreement with the recent quantitative low-energy electron diffraction共LEED兲 analysis of Tagawa et al.33 for TiC共001兲
共experimental value of 6.5% compared to the present
calcu-lated value of 5.1%兲 and Gruzalski et al.37 for TaC共001兲
共experimental value of 9% compared to the present
calcu-lated value of 8.9%兲 and represent a significant improvement over the LDA calculations of Kobayashi.57This author
stud-ied TiC共001兲, TaC共001兲, HfC共001兲, NbC共001兲, and ZrC共001兲
and found that these surfaces exhibit a significant rippling although the calculated values appear to be 2% larger than the present ones.
The surface energy formation per surface atom Esur
along the series has been calculated as in Eqs.共2兲 and 共3兲 for the unrelaxed and relaxed surfaces, respectively,
FIG. 6. 共Color online兲 Schematic rep-resentation of the interlayer and intra-layer共rumpling兲 atomic relaxation of the metal carbides共001兲 surface.
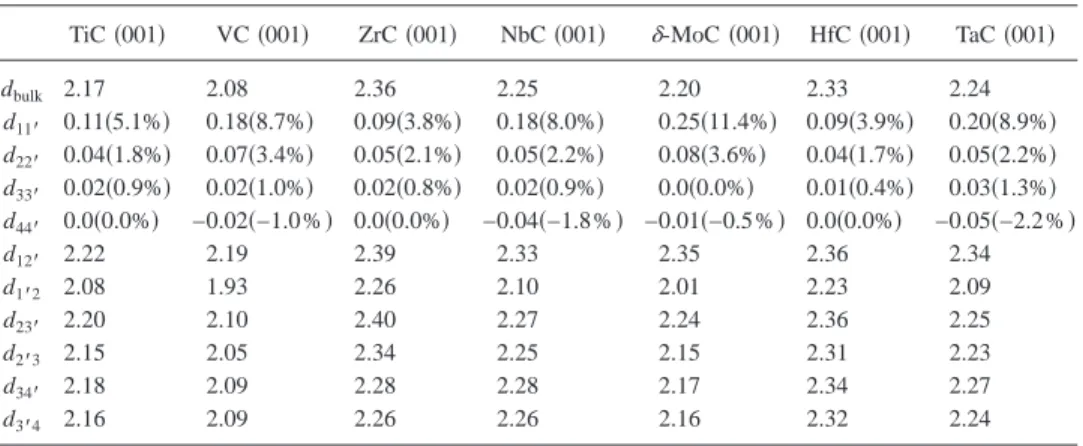
TABLE IV. Intralayer and interlayer atomic perpendicular distances 共in angstrom兲 obtained with the Slab-8 model at the PW91 level of theory. n and n⬘define the carbon and metal atoms of the n atomic layer, dnn⬘
corresponds to the rumpling of the n atomic layer, whereas dn⬘共n+1兲 corresponds to the minimum distance
between atoms in different layers. The percent rumpling is also indicated in parenthesis for comparison. TiC共001兲 VC共001兲 ZrC共001兲 NbC共001兲 ␦-MoC共001兲 HfC 共001兲 TaC共001兲
dbulk 2.17 2.08 2.36 2.25 2.20 2.33 2.24 d11⬘ 0.11共5.1%兲 0.18共8.7%兲 0.09共3.8%兲 0.18共8.0%兲 0.25共11.4%兲 0.09共3.9%兲 0.20共8.9%兲 d22⬘ 0.04共1.8%兲 0.07共3.4%兲 0.05共2.1%兲 0.05共2.2%兲 0.08共3.6%兲 0.04共1.7%兲 0.05共2.2%兲 d33⬘ 0.02共0.9%兲 0.02共1.0%兲 0.02共0.8%兲 0.02共0.9%兲 0.0共0.0%兲 0.01共0.4%兲 0.03共1.3%兲 d44⬘ 0.0共0.0%兲 −0.02共−1.0%兲 0.0共0.0%兲 −0.04共−1.8%兲 −0.01共−0.5%兲 0.0共0.0%兲 −0.05共−2.2%兲 d12⬘ 2.22 2.19 2.39 2.33 2.35 2.36 2.34 d1⬘2 2.08 1.93 2.26 2.10 2.01 2.23 2.09 d23⬘ 2.20 2.10 2.40 2.27 2.24 2.36 2.25 d2⬘3 2.15 2.05 2.34 2.25 2.15 2.31 2.23 d34⬘ 2.18 2.09 2.28 2.28 2.17 2.34 2.27 d3⬘4 2.16 2.09 2.26 2.26 2.16 2.32 2.24
Eunrelax=
Eslabunrelax共n兲 − 2nEbulk
2nat-sup , 共2兲
Erelax=
Eslabrelax共n兲 − 2nEbulk
nat-sup
− Eunrelax. 共3兲
In these equations, nat-sup stands for the number of surface
atoms in the slab unit cell; 4 in the present calculations. In the unrelaxed case, the factor 2 in the denominator comes from the fact that two surfaces are formed. The surface en-ergy for the relaxed surface is obtained from the relaxed slab calculation, where one surface is kept fixed, subtracting the surface energy for the unrelaxed surface. This procedure en-sures that the number of atoms in the bulk and in the slab is the same but it depends moderately on the number of atomic layers on the slab model. Table V reports the Esurvalues for
the Slab-4 and Slab-8 models at the bulk and relaxed geom-etries, the small differences between the two models are in-dicative that in this case the results for the thicker model can be considered as converged. Table V also includes values
reported recently by Hugosson et al.26 using the LMTO
ap-proach to describe the core electrons and the LDA method. From the results in Table V one can easily deduce that ig-noring surface relaxation may result in quite a large error on
the calculated value of the surface energy. Indeed, the differ-ence between the two values follows the degree of relaxation reported in Table IV. Hence, the effect is very small for ZrC and HfC which exhibit the smallest surface relaxation effects and rather large for␦-MoC and TaC where the surface relax-ations are the largest. For the unrelaxed surfaces the com-parison with the LMTO/LDA values of Hugosson et al. is straightforward and indicates that the present PW91 values
are roughly ⬃0.3 eV smaller. In principle this is a small
difference although the relative error is larger than 50%. These differences seem to have two different origins: on one
hand the use of the atomic sphere approximation 共ASA兲 in
the LMTO calculations, and on the other hand the use of the LDA exchange-correlation potential. For some carbides the
use of the ASA introduced differences of ⬃0.15 eV in the
surface energy as compared with the full potential LMTO
results.26 The remaining difference can be ascribed to the
well-known tendency of LDA to overbind; this will also re-sult in too large surface energies.
Next, we comment on the work function values calcu-lated for the Slab-8 model at the PW91 level共Table VI兲. The
work function is computed as= V − Ef, where V is the
electrostatic potential in the vacuum and Ef the correspond-ing Fermi level energy. Overall, the calculated values are within 0.5 eV from experiment which represents an average error of 10%–15%. It is important to remark that ignoring surface relaxation results in additional errors of about the same order of magnitude. In general, the inclusion of surface relaxation effects results in larger values of the calculated work function. The largest error is found for TaC and HfC which correspond to the 5d transition metals. It is likely that the error arises from the relativistic effects not completely included in the PAW potential. Overall, the present results represent a considerable improvement over those reported recently using the LMTO/LDA approach. However, while in most cases the present results have a lower error, it is also clear that the LMTO/LDA performs better for TaC and HfC. Since the present results are obtained using a more flexible representation of the valence and core densities and also by considering a complete geometry optimization for the sur-face, it is likely that the better performance of LMTO/LDA in these two systems is due to a cancellation error.
TABLE V. Surface formation energies of TMC 共001兲 surfaces 共TM = Ti, V , Zr, Nb,␦-MoC , Hf, Ta兲 in eV per surface atom. The two first col-umns report the PW91 values for fixed and relaxed surfaces using the Slab-4 model, the next two columns report the corresponding values for the Slab-8 model, whereas the rightmost column includes the LMTO/LDA values re-ported by Hugosson et al.26
Slab-4 Slab-8 Slab-7
Esur共relax兲 共eV/atom兲 Esur共fix兲 共eV/atom兲 Esur共relax兲 共eV/atom兲 Esur共fix兲 共eV/atom兲 Esur共fix兲 共eV/atom兲 TiC 0.48 0.52 0.48 0.52 0.83 VC 0.28 0.43 0.30 0.44 0.77 ZrC 0.55 0.58 0.54 0.57 0.86 NbC 0.38 0.55 0.47 0.52 0.87 ␦-MoC 0.19 0.44 0.28 0.46 0.77 HfC 0.55 0.64 0.59 0.63 0.90 TaC 0.37 0.71 0.48 0.61 0.88
TABLE VI. Fermi level energies Ef, electrostatic potential in the vacuum V, and work functionsof some
TMC共TM=Ti,V,Zr,Nb,␦-MoC , Hf, Ta兲. The three leftmost columns correspond to the Ef, V, andvalues
calculated with PW91 for the fixed Slab-8 surface models. Next three columns are the corresponding values for the relaxed surface. The seventh column reports the values reported previously Hugosson et al. using the LDA/LMTO method. Finally, the rightmost column includes available experimental values共Refs. 62–64兲. All values are given in eV.
Fixed Slab geometry Relaxed Slab geometry
共LDA/LMTO兲 共Expt.兲 Ef V Ef V TiC 2.59 6.67 4.08 2.50 6.90 4.40 4.94 3.8/ 4.1 VC 2.97 6.91 3.94 2.89 7.08 4.19 5.02 4.3 ZrC 2.75 6.48 3.73 2.67 6.64 3.97 4.45 3.5 NbC 3.85 7.23 3.38 3.75 7.41 3.66 4.45 4.1 ␦-MoC 4.23 8.23 4.00 4.09 8.47 4.38 5.10 ¯ HfC 2.34 6.09 3.75 2.25 6.27 4.02 4.45 4.63 TaC 3.69 7.02 3.33 3.59 7.20 3.61 4.36 4.38
To conclude this section we analyze the DOS of the Slab-8 model and compare to the corresponding bulk values. The most salient general features are a broadening of some
peaks共the metal outermost valence p level, for example兲, a
destabilization of the bonding peaks, and a stabilization of the antibonding ones. The first one is caused by symmetry breaking with respect to that of the bulk due to the appear-ance of the surface. The surface metal atoms loose the cubic symmetry and, hence, the otherwise threefold degenerate levels split into two components共a1- and e-like兲. The
differ-ential shift of bonding and antibonding levels contributes to decrease the gap with respect to that of the bulk. This effect is somehow enhanced when surface relaxation is properly taken into account. The reason behind this further effect is the relatively complex relaxation involving rippling of the
atomic layers共Fig. 6兲. Each C atom moves upwards and the
M atom moves downwards so that for each M atom there are four larger and one shorter M – C distances than in the bulk, the larger distances destabilizes the corresponding orbitals and since there is a 4:1 ratio, the final effect is a further destabilization of bonding contributions with a concomitant stabilization of the antibonding part.
V. CONCLUSIONS
In this work, the bulk and surface geometrical and elec-tronic properties of a series of transition-metal carbides have been studied by DFT methods. For the bulk systems, the lattice parameters and bulk modulus are in good agreement with experimental data. The chemical bonding has been
stud-ied by analyzing the DOS plots and the shifts of the C共2s兲
peak with respect to diamond. It is concluded that in these materials the chemical bonding is strongly covalent, the co-hesive energies being directly related to the
bonding-antibonding bands. Nevertheless, the C共2s兲 shifts with
re-spect to diamond indicated that some metal to carbon charge transfer occurs. Group 4 metal carbides can be viewed as small band-gap semiconductors, with a weak overlap be-tween the valence band and the conduction bands. Beyond group 4, metal carbides show a metallic character due to a partially filled d band, in agreement with the thermal and electric conductivity of these materials. However, in some
cases 共NbC and ␦-Moc兲, the metallic character is due to a
partially occupied metal s band.
The共001兲 face of these metal carbides exhibits a notice-able surface rumpling which grows along the series. The extent of the surface rumpling predicted by the two levels of
theoretical calculations 共all electron with the RPBE
func-tional and the PW91 one with the PAW description of the atomic cores兲 for the first layer are in good agreement with each other as well as with available experimental values. Nevertheless, accurate values for the second and third layers require including a few atomic layers to represent the bulk. Surface energies and work functions have also been pre-dicted and compared to available theoretical data and experi-ment. One of the important conclusions is that neglecting surface relaxation results in very large errors on the surface energy and work function although in the latter the calcu-lated values are slightly larger than experiment and further
increase upon surface relaxation. Finally, the formation of a surface results in a noticeable shift of the most prominent features of the total DOS with respect to the corresponding values in the bulk. The extent and nature of the shift can be understood from simple bonding-antibonding arguments and is enhanced by the structural rippling of this surface.
ACKNOWLEDGMENTS
This research was supported by the Spanish DGICYT under Grant No. BQU2002-04029-CO2-01 and, in part, by Generalitat de Catalunya under Grant No. 2001SGR-00043 and Distinció de la Generalitat de Catalunya per a la Pro-moció de la Recerca Universitària 共F.I.兲. F.V. is grateful to the Spanish Ministerio de Educación, Ciencia y Deporte for a predoctoral grant. Computer time was provided by the Centre de Supercomputació de Catalunya, CESCA; Centre Europeu de Paral.lelisme de Barcelona, CEPBA; and CEBPA-IBM-Research Institute, CIRI; through generous grants from Universitat de Barcelona, Fundació Catalana per a la Recerca and CIRI. The research carried out at Brookhaven National Laboratory was supported by the U.S.
Department of Energy 共Chemical Sciences Division,
Con-tract No. DE-AC02-98CH10886兲.
1
L. E. Toth, Transition Metal Carbides and Nitrides共Academic, New York, 1971兲.
2
R. B. Levy and M. Boudart, Science 181, 547共1973兲.
3
J. G. Chen, Chem. Rev.共Washington, D.C.兲 96, 1497 共1996兲.
4
L. I. Johansson, Surf. Sci. Rep. 21, 177共1995兲.
5
J. G. Chen, J. Eng, Jr., and S. P. Kelty, Catal. Today 43, 147共1998兲.
6
P. M. Stefan, M. L. Shek, I. Lindau, W. E. Spicer, L. I. Johansson, F. Herman, R. V. Kasowski, and G. Brogen, Phys. Rev. B 29, 5423共1984兲.
7
L. I. Johansson, B. E. Hagström, J. B. Jacobsson, and S. B. M Hagström, J. Electron Spectrosc. Relat. Phenom. 10, 259共1977兲.
8
P. S. Bagus, F. Illas, G. Pacchioni, and F. Parmigiani, J. Electron Spec-trosc. Relat. Phenom. 100, 215共1999兲.
9
G. R. Gruzalski and D. M. Zehner, Phys. Rev. B 42, 2768共1990兲.
10
P. H. Citrin, G. K. Wertheim, and Y. Baer, Phys. Rev. Lett. 41, 1425
共1978兲.
11
T. M. Duc, C. Guilliot, Y. Lassailly, J. Lecante, Y. Jugnet, and J. C. Vedrine, Phys. Rev. Lett. 43, 789共1979兲.
12
D. Spanjaard, C. Guillot, M. C. Desjonquères, G. Tréglia, and J. Lecante, Surf. Sci. Rep. 5, 1共1985兲.
13
W. F. Egelhoff, Jr., Surf. Sci. Rep. 6, 253共1986兲.
14
E. Wimmer, A. Neckel, and A. J. Freeman, Phys. Rev. B 31, 2370共1985兲.
15
L. I. Johansson, H. I. P. Johansson, and K. L. Håkansson, Phys. Rev. B 48, 14520共1993兲.
16
P. S. Bagus, C. R. Brundle, G. Pacchioni, and F. Parmigiani, Surf. Sci. Rep. 19, 265共1993兲.
17
B. Djellouli and H. Aourag, Phys. Status Solidi B 225, 265共2001兲.
18
J. Häglund, A. Fernández Guillermet, G. Grimvall, and M. Körling, Phys. Rev. B 48, 11685共1993兲.
19
A. Fernández Guillermet, J. Häglund, and G. Grimvall, Phys. Rev. B 45, 11557共1992兲.
20
A. F. Guillermet, J. Häglund, and G. Grimvall, Phys. Rev. B 48, 11673
共1993兲.
21
J. Häglund, G. Grimvall, T. Jarlborg, and A. F. Guillermet, Phys. Rev. B 43, 14400共1991兲.
22
A. Fernández Guillermet and G. Grimvall, J. Phys. Chem. Solids 53, 105
共1992兲.
23
A. F. Guillermet and G. Grimvall, Phys. Rev. B 40, 10582共1989兲.
24
J. Häglund, G. Grimvall, and T. Jarlborg, Phys. Rev. B 44, 2914共1991兲.
25
H. W. Hugosson, O. Eriksson, U. Jansson, and B. Johansson, Phys. Rev. B 63, 134108共2001兲.
26
H. W. Hugosson, O. Eriksson, U. Jansson, A. V. Ruban, P. Souvatzis, and I. A. Abrikosov, Surf. Sci. 557, 243共2004兲.
27
V. P. Zhukov and V. A. Gubanov, J. Phys. Chem. Solids 46, 1111共1985兲.
28
Y. Zhang, J. Li, L. Zou, and S. Xiang, Solid State Commun. 121, 411
共2002兲.
29
A. Simunek and J. Vackár, Phys. Rev. B 64, 235115共2001兲.
30
S. Zaima, Y. Shibata, H. Adachi, C. Oshima, S. Otani, M. Aono, and Y. Ishizawa, Surf. Sci. 157, 380共1985兲.
31
M. Aono, Y. Hou, R. Souda, C. Oshima, S. Otani, and Y. Ishizawa, Phys. Rev. Lett. 50, 1293共1983兲.
32
J. R. Noonan, H. L. Davies, and G. R. Gruzalski, J. Vac. Sci. Technol. A 5, 787共1985兲.
33
M. Tagawa, M. Okuzawa, T. Kawasaki, C. Oshima, S. Otani, and A. Nagashima, Phys. Rev. B 63, 073407共2001兲.
34
Y. Kido, T. Nishimura, Y. Hoshino, S. Otani, and R. Souda, Phys. Rev. B 61, 1748共2000兲.
35
D. L. Price, J. M. Wills, and B. R. Copper, Phys. Rev. B 48, 15301
共1993兲.
36
D. L. Price, J. M. Wills, and B. R. Copper, Phys. Rev. Lett. 77, 3375
共1996兲.
37
G. R. Gruzalski, D. M. Zehner, J. R. Noonan, H. L. Davis, R. A. Didio, and K. Müller, J. Vac. Sci. Technol. A 7, 2054共1989兲.
38
DMol3Module of Cerius2 by ACCELRYS Corp. San Diego, CA. 39
G. Kresse and J. Hafner, Phys. Rev. B 47, 558共1993兲.
40
G. Kresse and J. Furthmüller, Comput. Mater. Sci. 6, 15共1996兲.
41
G. Kresse and J. Furthmüller, Phys. Rev. B 54, 11169共1996兲.
42
J. Perdew, J. A. Chevary, S. H. Vosko, K. A. Jackson, M. R. Pederson, D. J. Singh, and C. Fiolhais, Phys. Rev. B 46, 6671共1992兲.
43
J. P. Perdew, K. Burke, and M. Ernzerhof, Phys. Rev. Lett. 77, 3865
共1996兲.
44
B. Hammer, L. B. Hansen, and J. K. Nørskov, Phys. Rev. B 59, 7413
共1999兲.
45
P. E. Blöchl, Phys. Rev. B 50, 17953共1994兲.
46
G. Kresse and D. Joubert, Phys. Rev. B 59, 1758共1999兲.
47
B. Delley, J. Chem. Phys. 92, 508共1990兲.
48
B. Delley, J. Chem. Phys. 113, 7756共2000兲.
49
S. Kurth, J. P. Perdew, and P. Blaha, Int. J. Quantum Chem. 75, 889
共1999兲.
50
M. Gajdoš, A. Eichler, and J. Hafner, J. Phys.: Condens. Matter 16, 1141
共2004兲.
51
See http://www.fiz-informationsdienste.de/en/DB/icsd/
52
M. Guemmaz, A. Mosser, R. Ahujab, and B. Johansson, Solid State Com-mun. 110, 299共1999兲.
53
J. C. Grossman, A. Mizel, M. Côté, M. L. Cohen, and S. G. Louie, Phys. Rev. B 60, 6343共1999兲.
54
T. Amriou, B. Bouhafs, H. Aourag, B. Khelifa, S. Bresson, and C. Mathieu, Physica B 325, 46共2003兲.
55
N. López, J. C. Paniagua, and F. Illas, J. Chem. Phys. 117, 9445共2002兲.
56
A. Markovits, M. K. Skalli, C. Minot, G. Pacchioni, N. López, and F. Illas, J. Chem. Phys. 115, 8172共2001兲.
57
K. Kobayashi, Jpn. J. Appl. Phys., Part 1 39, 4311共2000兲.
58
JANAF Thermochemical Tables, 3rd ed., edited by M. W. Chase, C. A.
Davies, J. R. Downey, Jr., D. J. Frurip, R. A. McDonald, and A. N. Syverud, J. Phys. Chem. Ref. Data, 1985, 14, Suppl. 1/2.
59
O. Kubaschewski and C. B. Alcock, Metallurgical Thermochemistry, 5th ed.共Pergamon, Oxford, 1979兲.
60
P. Roedhammer, W. Weber, E. Gmelin, and K. H. Rieder, J. Chem. Phys. 64, 581共1976兲.
61
M. Hillert and L. I. Staffansson, Acta Chem. Scand.共1947-1973兲 24, 3618
共1970兲.
62
C. Oshima, M. Aono, S. Zaima, Y. Shibata, and S. Kaiwa, J. Less-Common Met. 82, 69共1981兲.
63
P. A. P. Lindberg and L. I. Johansson, Surf. Sci. 194, 199共1988兲.
64
G. R. Gruzalski, S.-C. Liu, and D. M. Zehner, Surf. Sci. 239, L517