MEASURING COMPETENCE IN COMPUTER SKILLS* C. Filippucci, S. Pacei
1. INTRODUCTION
The aim of this paper is to suggest and to test a strategy for measuring and analysing personal, practical knowledge of core computer skills. These skills are crucial for success in the labour market and in nearly every field of human activity (Zang and Espinoza, 1997). The motivation for undertaking this research derives from the evident and increasing importance that ICT has in a knowledge-based economy. This in turn highlights the need for suitable statistical information on its development and diffusion (Romer, 1990; Foray and Lundvall, 1996; Colombo and Grilli, 2004). In spite of this clear need, official national and international sta-tistics have not provided adequate information for in-depth study about the dif-fusion, the characteristics of knowledge and skills in the new economy and some other important correlated aspects such as ICT skills shortage, gaps or mis-matches (European Commission, 2004). Furthermore, the lack of data does not concern computer spread and other electronic and communication devices but rather systematic and repeatable information about demand and supply of skilled workers, changes in capabilities, knowledge diffusion and utilisation, production process organization changes, foreign direct investments property links, etc.
Eurostat started a working group on statistics connected to the ICT society in 2001 to face the need of harmonized information on ICT usage in households/ individuals and enterprises. In Italy, in the field of business statistics, ISTAT car-ries out a survey on firms with more then 10 employees that includes some ques-tions suggested by Eurostat on computer and related technology usage, internet access and e-commerce (Demunter, 2004). The National Association of Cham-bers of Commerce performs another important survey on the demand for new employees and their skills in many activities including computers. In order to gather information at the household level, Eurostat designed a questionnaire to be added by most EU member States to their national household surveys every
This work has been carried out within the national project co-financed by the MURST (PRIN 2003) “Measurement and statistical analysis of territorial specialization of the Italian production system in a
kno-wledge-based economy” co-ordinated by Carlo Filippucci. The paper, though it is the result of a close
collaboration, was specifically elaborated as follows: sections 1 and 2 are due to Carlo Filippucci, while sections 3 and 4 are due to Silvia Pacei.
year (Demunter, 2004). In Italy this questionnaire, which includes some questions on computer and internet use, has been introduced since 2002 in the annual mul-tipurpose survey on “Aspects of daily life”. Moreover computer and internet us-age by individuals was analysed by ISTAT for the first time in 2000 within the five years survey “Citizens and their leisure time” (Morrone and Zanella, 2004), which collected information on the reasons, the places and the time spent using the computer. However, all the cited surveys do not provide detailed information on individual practical capabilities and skills and above all they do not satisfy the need to measure them adequately.
Because the lack of suitable statistics on individual competence we decided to identify and to evaluate actual individual skills in the use of core computer appli-cations, and to test an approach for collecting data on those capabilities through a fairly simple, cheap and repeatable survey. The aim of this analysis is to devise and suggest an instrument to measure computer skills that could eventually be integrated into current labour force surveys. Such an instrument could accord-ingly be used to improve current statistics on human capital and on the labour force. Data on personal knowledge and skills could be particularly useful for the estimation of economic models, such as earnings functions, where those charac-teristics are typically introduced as independent variables in order to predict workers’ wage. Because of the lack of information on these variables, they are of-ten simulated or treated as laof-tent (Farber and Gibbon, 1996; Chiappori et al., 1999; Altonji and Pierret, 2001).
This paper also focuses on the need to provide data for local analysis where lack of data is well known. Analysis of the economic performance of regions is increasingly important and this is particularly true in Italy where the economic landscape is characterised by some important economic areas (industrial districts: Sforzi, 1997). Many small business which are highly specialized and intercon-nected are concentrated in industrial districts. Thus studying their competition and capacity to employ skilled workers seems very useful.
Checking the population’s practical skills in crucial fields for economic compe-tition means that in practice one can monitor the performance of individuals in managing such knowledge. This is a not simple problem to solve from a statistical point of view. According to the literature in fact, international research on meas-uring human capabilities has been carried out above all by international agencies. These agencies have used three main approaches: 1) aptitude and psychological testing, aiming at evaluating capabilities by cognitive tests proposed by psycholo-gists (OECD, 2002; Gallina, 2005); 2) statistical surveys which ask individuals di-rectly if they have specific capabilities and skills for certain tasks (Moss and Tilly, 1996; EUROSTAT, 2004); 3) self-evaluations of one’s own capabilities and skills, often used together with one of the previous strategies (UNESCO, 2003). The first solution allows a detailed investigation of very basic capabilities, like “prose” or “document literacy”, “numeracy” and “problem solving”. This approach is seful if it permits us to identify specific personal characteristics, which can be u-sed as proxies for the skills being researched. An important survey bau-sed on this approach is carried out by OECD - the Programme for International Student
As-sessment (PISA). The survey’s aim is to assess the skills of students who are fin-ishing their compulsory education. It seeks to measure if they have acquired knowledge and skills useful for participating in the labour market. Tests are ad-ministered to a sample of students ranging between 4,500 and 10,000 in each of the 43 countries involved. The domains of reading, mathematical and scientific literacy are covered in terms of the knowledge and skills needed in adult life (O-ECD, 2002). Hence skills investigated are very general and are not appropriate to the task of measuring practical capabilities like those required for computer appli-cations, even if some evidence has been found regarding the correlation between adult literacy and human skills in general (Gallina, 2005).
The first approach is time consuming, expensive and difficult to repeat, there-fore it is clearly useful for investigating a specific population at one specific points in time, while it is not suitable for meeting the objectives of statisticians asking for timely and repeated data on large populations.
The latter two strategies also have drawbacks, since they are based on respon-dents’ self-evaluations of their own capabilities. Both strategies are prone to a “subjective” bias. Even though self-evaluation on computer knowledge has been used in many studies on students, some authors who utilized self-evaluation methodologies (Duvel and Pate, 2004), admit there is concern about the reliability of self-reported information. Thus the question is how to check practical knowl-edge, if we cannot use an aptitude test. Our aim is to look for a strategy able to produce “objective” observation avoiding the risks of “subjective” bias. In our view this task can be achieved by using a statistical survey able to test respon-dent’s capabilities in a specific field. In the case of computer applications, our ba-sic idea was to administer a questionnaire based on questions similar to those asked to people seeking the European and Computer Driving Licence (ECDL). This is an internationally recognised qualification which enables people to dem-onstrate their practical competence in computer skills, which is adopted as stan-dard by governments in many countries (Matei, 2003). In this approach the can-didate’s skills in using computers in a wide range of applications is tested by ask-ing specific technical questions and makask-ing the respondent choose the correct answer from a set of different possible answers.
The approach described above has been implemented in 2004 in a sample sur-vey focused on individuals’ knowledge of computer applications. In particular we were interested in investigating skills related to some widely used software and not to the knowledge of hardware. Further, we decided to focus especially on the most commonly used operating system, Windows, as does the test for the Euro-pean and Computer Driving Licence. Hence we collected information on the ca-pabilities acquired in core applications and programs used in the Windows envi-ronment, because computer literacy has evolved beyond basic word processing and file management, to desktop publishing, spreadsheets and internet manage-ment (Lawson and de Matos, 2000).
If the strategy proposed works successfully it could be applied to other topics, becoming a very useful instrument to obtain statistical evidence on human capital skills.
In our experiment we also asked for a self-evaluation of skills considered. Com-paring self-evaluations with replies given in the test-questionnaire will make it pos-sible to check the reliability of self-evaluation of computer skills and to verify whether or not our assumption that self-evaluation of these skills is unreliable is a too pessimistic view.
The outline of the paper is as follows. Section 2 gives a description of the sam-ple survey (target population, sampling design, questionnaire, etc.). Section 3 pro-vides the analysis of main results which allows us to compare the effectiveness of the survey strategies described and to study the relationship between the inter-viewees’ level of competence and other characteristics like their employment status, their educational level and the district where they live. Some concluding remarks and possible further developments are offered in section 4.
2. THE SURVEY
The target-population is constituted by young people (from 20 to 35 years old) living in the 22 industrial districts of the Emilia-Romagna Region. Districts con-sidered are “Local System for Work” (LSW), that are groups of municipalities de-fined according to the number of workers commuting towards a municipality, which are defined as “industrial districts” if the business are mainly small or me-dium and if their output is mainly in the same sector. Districts contain about 45% of both municipalities and population of the Region and are specialized, accord-ing to the National Statistical Institute, in four economic sectors: “food industry”; “mechanics”; “furniture”; “textiles and clothing” (ISTAT, 1997). Our study’s re-striction to one region was due to budget constraints. However, the region se-lected is one of the most developed areas in Italy, having one of the highest levels of income in the country, as well as an integrated and extended network of com-petitive firms. Therefore it provides a very interesting observation point from which to study the Italian economy’s ability to face the challenges of the new economy1.
The choice of the target-population depends on the assumptions that these people are those that most need informatics skills and that the knowledge econ-omy’ capacity to grow depends upon them.
As we said our questionnaire is based on the approach used for obtaining the European and Computer Driving Licence (ECDL). On this basis we selected six basic computer applications which cover knowledge of different programmes generally used to solve many different problems: 1. “managing files”; 2. “word processing”; 3. “spreadsheets”; 4. “access database”; 5. “information and com-munication: basic web search task”; 6. “information and comcom-munication: web pages construction”.
Since one of our objectives is to check the reliability of self–evaluation, the
1 The interest of Emilia-Romagna Region on topics related to our purpose is shown by another sample survey on households, “The Spread of Internet among Emilia-Romagna Citizens”, carried out in 2003 in order to collect information on the use of internet and e-Governance.
discrepancies between self-evaluations and actual knowledge demonstrated in the test are evaluated for each of those six sections.
Moreover the questionnaire includes questions on several characteristics of the respondents and on their computer use (frequency, places and reasons for using the computer, how they learnt to use it, training courses, etc.). The particular knowledge of the different programmes listed above and the general knowledge of computer use is measured by both the self-valuation, given in a scale from 1 to 10, and the result of the test, that is the number of correct answers given to each section/application and on the whole test.
The sample is a stratified and the planned size is 1,200 units. Strata have been defined by the already mentioned four district typologies. The sample size allows to obtain reliable results for each strata2. The allocation of interviews per district
within each stratum keeps constant the district estimates’ standard error within the stratum. The same condition is valid for the municipality estimates’ standard error within each district. That choice implies an equal number of interviews in each municipality of the same district and an equal number of interviews in each district of the same stratum.
The CATI (Computer Assisted Telephone Interview) technique was used. The questionnaire was previously tested on a pilot sample of 20 units in order to check the comprehension of the questions and answers asked by telephone and no difficulties arose from the test.
Since a complete list of persons within the range of age of interest is obviously not available, households have been selected randomly from telephone directories and then eligible household’s members have been interviewed.
On the whole 9974 telephone numbers have been called to obtain 1,157 com-pleted interviews (a sample size slightly lower than planned). No person in the range of age of interest was found in two out three (6,696) calls. Telephone num-bers were incorrect in 236 cases, for 1,313 numnum-bers no one was found at home after four attempts and 524 contacted households having an eligible component refused to participate. Finally, we had no interruption of the interviews due to problems of understanding or inconvenience resulting from the specific type of interview-test administered.
For a survey with ineligible units, the response rate may be simply calculated as the ratio between the number of interviewed cases (I) and the sum of the inter-viewed and the refused interview cases (R). This ratio is in our case equal to 0.7. Conversely, the response rate may be obtained by adding at the denominator also the estimated number of cases that would be eligible among the non contacted sample units (not found at home after four attempts). If we let e be the propor-tion of households contacted in the study with eligible persons (0.2 in our sur-vey), the number of cases that would be eligible among the non contacted sample units may be estimated as the product between e and the non contacted sample
2 The strata sample dimension has been chosen so as to obtain estimates of a proportion per stratum with a sampling error which overcomes 6% with a probability equal to 0.05. This involved the execution of about 300 interviews for each of the four strata (Cochran, 1977).
units3 (McMillen et al., 2001). The response rate calculated in this way results in
our case equal to 0.6. Such rates are similar or lower than those obtained by other Italian surveys carried out by using a CATI technique, such as a recent survey on “the listening on the radio” carried out by the Tuscany Region (2005).
A first important result arises from this last piece of evidence. In spite of our doubts about people’s willingness to participate in such a survey, the approach proposed was basically accepted by people contacted. Some usual problems of CATI interview stems from our experiment essentially because we were looking at particular classes of ages, but the important finding was that it is possible to ask these particular types of questions through a telephone interview. It should be noted that refusals arose at the moment of the contact and not because of the questions. Interviewees generally understood the questions and showed interest in testing their skills. From this point of view it seems possible to say that the ex-periment has been successful given the response rate, the cooperation shown and the respondents’ good understanding of the questions asked.
However, to reduce possible bias effects on estimates induced by refusals and coverage errors in telephone directories, sample weights have been adjusted ac-cording to the last Census results, which date from 2001. Coverage errors in tele-phone directories may be due to the increasing diffusion of mobile tele-phones which is leading to a gradually substitution with the home phones. However the per-centage of households having only mobile phones in Emilia-Romagna in 2002 was only 10% (ISTAT, 2003).
Hence, the sample structure was adjusted according to gender and quinquen-nial ranges of age within each district (the only two data available at the time of the survey for the district level). In each of the post-stratum so defined, weights have been calculated as the ratio between the number of persons in the popula-tion and the number of persons in the sample, taking into account of the three years difference between the results coming from the two sources.
A comparison between the structures of the sample and of the population with respect to other characteristics such as the education level or the employment status is not straightforward, since that information is available from the last Cen-sus only at regional and provincial level. However, the comparison between sam-ple results and the Census in Emilia-Romagna shows that our samsam-ple has an higher percentage of persons with a upper secondary education (63%) to the det-riment of the lower secondary education (22%) than the regional population where those percentages are 53% and 32% respectively. Furthermore, our sample is found to have a smaller percentage of the labour force (75%) than the regional population, where this percentage is 82%. Differences observed could be due to the territorial concentration of highly educated persons and students in districts which are often secondary school and university poles.
3 RR I
I R eU
= + +
3. RESEARCH FINDINGS REGARDING COMPUTER SKILLS
In this section some main findings are presented, according to the following outline. First of all computer use is analysed: frequency of use, where and why computers are used, skills achieved, participation in training courses on PC use, etc. (par. 3.1). Then, a comparison between results obtained by the two measure-ment strategies employed is carried out (par. 3.2). A more accurate analysis of the individual characteristics in connection with those results is outlined in paragraph 3.3. Finally, paragraph 3.4 provides a picture of different patterns of competence that persons demonstrate having in the six questionnaire sections.
3.1. PC usage
The population considered seems split among three different groups: about 2/3 (60%) uses computers daily, 20% use it only from time to time and the re-maining 20% never use it. Windows is found to be the most frequently used op-erative system: 99% of the population use it4. There is no prevailing reason for
using computers and most people use PCs for more than one task: 87% of them use the computer for leisure, and 86% of the workers use it for work reasons. Students using PC at school are a smaller fraction (67%).
The first results show that a very large portion of the population considered uses PCs (80%, 927 persons). It is possible to compare this last percentage with that obtained by ISTAT from the Multipurpose Survey on “Citizens and their lei-sure” which is, for the whole country in 2000, about 64% for persons aged from 20 to 24 years old and 54% for persons aged from 25 to 34 years old (ISTAT, 2004). Considering that ISTAT data refer to two years before and to the whole country, and that Emilia-Romagna is one of the most economically and socially advanced Italian regions , it becomes clear that our findings do not indicate that the Region occupies a leading position regarding population skills in the core computer applications. Further, our study found no evidence that the Region’s economic system favours the diffusion of qualified computer skills.
Skills considered are not acquired through a systematic training but rather based on self-training. Most of persons had not attended training courses and one or more training courses providing a certificate have been taken by only 22% of them. On the other hand, it is to be noted that such training was becoming in-creasingly important in the more recent years, where a higher concentrations of course attendance have been found: 2000 (12%), 2002 (17%) and 2003 (13%).
“Self-learning” is considered the most important way of getting and/or im-proving computer competence, followed by the “on-the-job training” for workers and by “training at school” for students (Table 1)5. If the analysis of the
4 They are the only interviewees that respond to the rest of the questions on the knowledge of informatics.
5 The percentage contribution to one’s own computer skills derived from: training at school, training at work, other courses attended on one’s own initiative and self-learning have been investi-gated. This analysis has been carried out for “employed and unemployed persons” and for
“stu-tion assigned to “other courses” is restricted to persons stating that they have taken training courses providing a certificate, the average of percentages increases to 21% for employees and unemployed persons and to 28% for students and per-sons looking for the first job, but the most frequent learning strategy remains “self-learning”.
TABLE 1
Different ways of learning for one’s own knowledge (average of percentage)
Employees and unemployed
persons Students and persons looking for the first job On-the-job training 34 -
Training at school 14 33 Other courses 7 7
Self-learning 45 60
3.2. Computer capabilities: evidence from the strategy suggested and analysis of the reliability of
self-evaluation6
Respondents were asked to assign an evaluation of their knowledge choosing a score in a scale from 1 to 10. The aspects to be evaluated were: i) general com-puter knowledge; ii) competence regarding “managing files”, “word processing”, “spreadsheets”, “access database”, “basic web search tasks” and “web page con-struction”, which constitute the six sections of the questionnaire. Each section also includes five specific questions chosen to provide an objective evaluation of the respondents’ knowledge in each topic, in order to evaluate the specific com-petence mentioned above by using the number of correct answers given to each section (from 0 to 5) and the number of correct answers given in the whole (from 0 to 30).
Since our test was designed to measure a specific field of knowledge, we wanted to evaluate if the selected multiple-choice questions covered this field adequately that is, if the test is likely to produce consistent scores. To this pur-pose we calculated the “Kunder-Richardson formula 20 statistic”7 (Kunder and
Richardson, 1937) providing a unique reliability coefficient which depends on the inter-correlation among the items-questions and which may vary between 0 and 1. High values mean that the questions are measuring the same underlying con-struct while low values mean that data have a multidimensional con-structure. The high value reached by that coefficient in our case, 0.85, confirmed the reliability or internal consistency of the test performed.
Looking at the general knowledge of computer applications and referring to
dents and persons looking for the first job” separately, since the last ones had obviously given a zero percentage to on-the-job training.
6 Persons interviewed who declared no computer use were excluded from this analysis. 7 20 1 1 2 KR k pq k ρ σ ⎛ ⎞ == ⋅ −⎜ ⎟ − ⎝ ⎠
∑ , where p is the proportion of respondents passing a given item, q
is its complementary, k is the number of items and σ2 is the variance of total score obtained by respondents.
self-evaluation, the mean score is 6.4 and its standard deviations is 1.7. Thus our population seems to have sufficient competence of core computer applications. The next question is to check if our test confirms that self-evaluation. The com-parison is not straightforward since the two variables have different ranges of variation8. For this reason the results of the test have been grouped by three (in
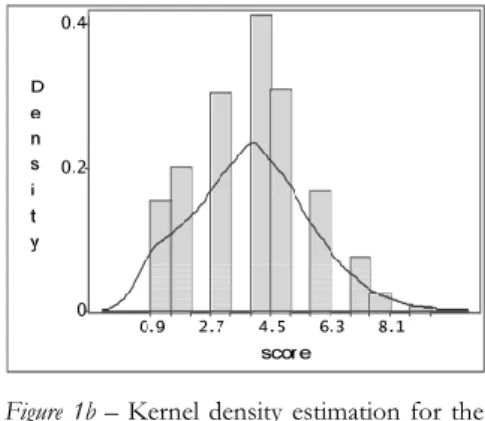
order to have it also expressed in a scale from 1 to 10) and a kernel non paramet-ric density (Silverman, 1986) has been estimated on the so rescaled domain for the test and on the original domain for the self-evaluation (Figure 1a, 1b). From the comparison between the two distributions it arises that the one concerning self-evaluation has an evident negative asymmetry, while the opposite is observed for the test distribution. Self-evaluation results in individuals to heaping their an-swers around some values. This result was expected, but the difference observed is very high. The mean score calculated on the rescaled tests results is 3.9 and the standard deviation is 1.7. Therefore, while persons tend to value their knowledge sufficient on average, their performance in the test on average is not sufficient and the variability is higher. Therefore, self-evaluation seems affected by a sys-tematic positive bias when compared to the results of the test, that would lead to a more optimistic image of reality. We can state that self-evaluation appears less reliable than a specific check.
The low scores in the test confirm findings of other studies concerning Italy (Gallina, 2005) where lower scores in comparison to other countries and also more inequality have been observed.
Figure 1a – Kernel density estimation for the
self-valuation*
* Mean = 6.4, Median = 7, Mode = 7, Stan-dard deviation = 1.7, Coefficient of variation = 26%
Figure 1b – Kernel density estimation for the
score**
** Mean = 3.9, Median = 4, Mode = 4, Stan-dard deviation = 1.7, Coefficient of variation = 43%
We also considered the extent of concordance between the results obtained from the two evaluation strategies for each individual. This task has been
8 The presence of two different score systems is due to the choice of using a scale from 0 to 10 for the self-evaluation, reminiscent of scores used at Italian primary and secondary schools, but has a maxim which differs from the number of questions introduced for the test.
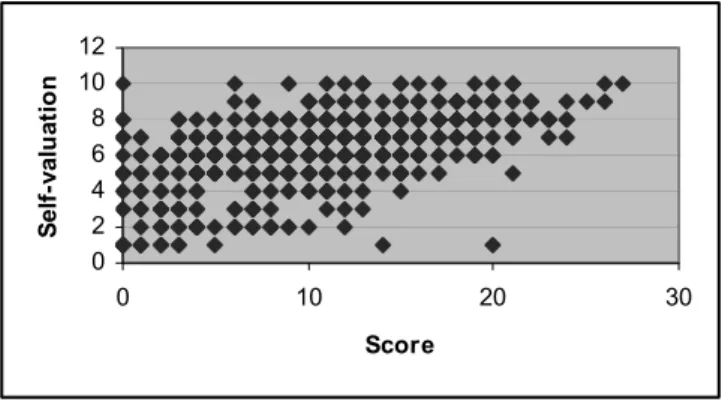
formed by using the following scatter-plot (Figure 2). Here respondents are rep-resented according to both self-evaluation and the test. The coefficient of correla-tion (ρ) between these variable is only 0.54. Most discrepancies derived from re-spondents who evaluate their knowledge more positively than their performance in the test. The percentage of persons whose self-evaluation is higher than their (rescaled) result in the test is 89. Percentage of cases where the contrary happens is 3. 0 2 4 6 8 10 12 0 10 20 30 Score S el f-va lua ti on
Figure 2 – Scatter-plot for self-evaluation against score.
The comparison between the two evaluation strategies is further developed on the basis of results obtained from the six specific sections of the questionnaire, which are given in Table 29.
Not all the 915 interviewees who state using a computer answered all sections (the number of respondents to each section is reported beside each section name). Clearly missing answers concern the sections where respondents gave as an answer to the first question of the section (do you have some skills about the issue asked?): “no knowledge at all”. It is to be noted that the respondents to the last two sections “access database” and “web page construction” are very few compared to the other sections, showing that these two specific capabilities are quite rare in our population.
When each application is considered, differences between scores in the two approaches are less evident probably because of the different variability of indi-vidual scores. We evaluated also the actual relevance of differences by the correla-tion between individual self-valuacorrela-tions and tests in each seccorrela-tion. Correlacorrela-tion is high (ρ: 0.86 and 0.89) for “access database” and “web page construction”. These tools are quite sophisticated and less spread applications so that respondents seem more aware of difficulties and of their real skills. On the contrary, correla-tion is slightly lower for “managing files” (0.58), “word processing” (0.62) and “basic web search” (0.61).
9 Also in this case, the comparability has been reached by rescaling the test scores which has been multiplied by two (it originally ranges from 0 to 5 because of the 5 questions per section).
TABLE 2
Results obtained for self-valuation and test in the six applications considered
MANAGING FILES (n = 888; ρ = 0.58)
Mean Coefficient of variation
Self-valuation 6.8 35%
Test 5.8 52%
WORD PROCESSING (n = 842; ρ = 0.62)
Mean Coefficient of variation
Self-valuation 6.3 40%
Test 5.6 46%
SPREADSHEETS (n = 692; ρ = 0.72)
Mean Coefficient of variation
Self-valuation 4.3 67%
Test 3.6 89%
BASIC WEB SEARCH (n = 825; ρ = 0.61)
Mean Coefficient of variation
Self-valuation 5.8 43%
Test 5.0 52%
ACCESS DATABASE (n = 167; ρ = 0.86)
Mean Coefficient of variation Self-valuation 0.9 244%
Test 0.8 250%
WEB PAGE CONSTRUCTION (n = 106 ; ρ = 0.89)
Mean Coefficient of variation Self-valuation 0.6 300%
Test 0.4 400%
3.3. The determinants of competence
In order to understand if some specific individual characteristics do influence the degree of skills measured by the test10, two different sort of analysis have
been carried out, distinguishing between undoubtedly exogenous characteristics and possibly endogenous ones. The existence of a dependence of the personal knowledge from the characteristics of the first type, that are: gender; age; educational
level; employment status (labour force, non labour force); district; kind of district and to have taken training courses, has been tested by using the “analysis of variance test”
(ANOVA) for more classification factors (Scheffe, 1959). Instead, regarding the endogenous characteristics, that are: occupation (ISCO88 International Standard Classification of Occupations); sector of activity (ATECO2002 classification);
fre-quency of PC use; use of PC at work; use of PC at home; use of PC at school; use of PC for work reasons; use of PC for study, entertainment or information, their interdependence
with competence acquired has been measured and tested by applying the canoni-cal correlation analysis. In fact, this analysis allows us to measure the correlation between a numerical variable (the evaluated knowledge) and a nominal variable (an interviewee’s characteristic) quantifying the nominal variable, that is providing for each of its modalities the numerical value that maximize the correlation be-tween the two variables (Anderberg, 1973; p. 80).
In the ANOVA, the averages of the test scores obtained by sub-groups of the per-sons defined by the modalities of the exogenous characteristics or, possibly, by com-binations of them are compared by using an F-test. The null hypothesis of the test is that all those means are equal in the population (and, consequently, differences in the sample means are due only to the sampling error). This hypothesis is tested against
the alternative that the population means are not all equal. If the null hypothesis is rejected, it means the characteristic used to create sub-groups has an influence on the test score, since its average assumes for those groups values which differ from each other significantly. Results obtained from this analysis are reported in Table 3.
TABLE 3
Analysis of variance results for the score test
Characteristic DF Deviance Variance F Pr > F
Gender 1 1444 1444 69 <.0001 Age (ten years ranges) 1 324 324 15 <.0001
Educational level 2 2280 1140 54 <.0001 Having taken training courses (yes/no) 1 772 772 37 <.0001 Gender*Age 1 79 79 4 0.0424 Age*Educational level 2 244 122 6 0.0031
For simplicity only results obtained for those characteristics resulting signifi-cant factors for the level of competence are reported. They are: gender, age, edu-cational level, having taken training courses and the interaction between gender and age and between age and educational level. Finally, the “industrial district” and the “district typology”, which are characteristics of the municipalities where the persons live, do not have a significant influence on the score obtained by the test. In general these variables used to stratify the sample are less relevant than the others reported in the table and this holds also in the analysis that will be de-scribed in the remaining section. In fact “industrial district” and the “district ty-pology” are characteristics of the municipalities where interviewees live, while the variables considered until now concern their own characteristics.
Besides, it is possible to evaluate the influence of these characteristics con-nected to the use of computer applications on the basis of the differences be-tween the group means compared by the test. Group means are given in Table 4, where the results of the analysis of variance test are provided for those character-istics leading to the rejection of the null hypothesis.
TABLE 4
Analysis of variance test results for characteristics with significant differences between group means
CHARACTERISTIC MODALITIES MEAN OF TEST
Gender Male 12.7
Female 9.7
Age 20-27 12.1
28-35 10.3
Educational level Up to lower secondary education 8.4 Upper secondary education 11.3
University degree 13.7
Have taken a training course Yes 12.2
No 10.1
Gender*Age Male, 20-27 13.2
Male, 28-35 12.2
Female, 20-27 10.9
Female, 28-35 8.4 Age*Educational level 20-27, Up to lower secondary education 10.3 20-27, Upper secondary education 12.0
20-27, University degree 13.8 28-35, Up to lower secondary education 6.5
28-35, Upper secondary education 10.6
Some of these results were expected while some others are somewhat surpris-ing. In particular, regarding the mentioned variables, the role of gender, age and education level agrees with findings of studies carried out on more general life skills (prose literacy, document literacy, numeracy and problem solving) (Gallina, 2005). Men gave on average three more correct answers than women. Someone (Gallina, 2005) explains the difference by referring to the greater opportunities of education, training and work that men still have in comparison with women. However, Gallina was referring to Italy as a whole, while our survey was carried out in Emilia-Romagna, where differences between genders in education and in the labour market are quite small, especially among young people who are our target population. Other authors (Valenduc and Vendramin, 2005) suggest an-other hypothesis for the gender gap in ICT in general, that is some features of work organization in the ICT profession (unpredictable working rhythms, cos-tumer driven flexibility, continuous time pressure) but they refer only to working people. Then our paper confirms that gender plays, at least presently, a significant role in differentiating capabilities in the informatics field.
According to the findings of those other studies, people between 16 to 25 years old are less skilled than older persons, meaning people between 26 to 35, and this holds for different countries. In our case the contrary happens, because the number of correct answers provided decreases when the age increases, but this is obviously due to the particular capabilities investigated in our study.
Education is also an important feature which confirms its use as proxy to im-prove the evaluation of human capital. The score average obtained for different educational levels increases with the orderly modalities of this characteristic. The increase is about 2.9 points moving from “lower secondary education” to “upper secondary education” and of approximately another 2.4 points moving from this last modality to the modality of “university degree”.
Regarding the interaction between gender and age, it should be stressed that on average men reach a much better result than women, whatever class of age men and women belong to. Looking at the averages obtained for the interaction be-tween age and educational level, we observe that university graduates give on av-erage the same number of correct answers whatever class of age they belong to, while for the other two educational levels the age plays an important role. This is particularly evident for the lower secondary education: the younger persons (class 20-27 years old) give on average four correct answers more than the older ones (class 28-35). From this evidence it seems possible to see the effect of social con-ditions: until few years ago who had a lower social status was excluded from PC utilisation and school was not able to help him, and only recently but quite quickly the gap has started to be overcame.
Taking into account endogenous characteristics, results of the canonical corre-lation analysis are reported in Table 5. For all of them the hypothesis of inde-pendence with the score test is rejected excepted for “the use of the computer at school”. Evidence suggests that for young people, school is not important in learning informatics. It seems that school does not provide adequate informatics teaching and self-learning or learning assisted by parents/friends are more
effec-tive. The estimated correlation coefficients are not very high. Obviously, the vari-able connected to the highest correlation is “the frequency of computer use”, that distinguishes between persons using the computer daily and persons using the computer from time to time.
TABLE 5
Canonical Correlation Results - Significant correlations (Ho : ρ = 0 rejected)
Characteristic Correlation with the score Frequency of computer use 0.38 Occupation (ISCO88)* 0.30 Sector of activity (ATECO2002)* 0.21 Use of computer for study, entertainment or information 0.27 Use of computer at home 0.20 Use of computer for work reasons* 0.19 Use of computer at work* 0.11 * Only for employees and unemployed persons
Also for these variables it is interesting to observe the differences between the averages of the test scores calculated for the sub-groups defined by their modali-ties (Table 6). The main differences between score means concern the “frequency of computer use” and “the use of computer for study, entertainment or informa-tion reasons”. Daily computer use increases the overall score obtained, on aver-age, by about 5 points, that means about 5 correct answers more than when computer is used only occasionally. About the same increase of the score average is connected with the use of computer for study, entertainment or information reasons in comparison to the absence of this kind of use. Consequently we con-clude that it is not enough to study computer diffusion among households to un-derstand the real degree of computer capabilities of population. Testing real knowledge owned seems necessary to appreciate the real human capital capabili-ties.
Regarding the “type of occupation” our expectations have been confirmed: the professions that obtained the highest score means are “technicians and associate professionals” (12.5) and “clerks” (12.2), while those obtaining the lowest score means are “service workers and shop and market sales workers” (6.4) and “ele-mentary occupations” (6.3). The category of “legislators, senior officials, manag-ers and professionals” reaches a high result (10.9), but it is not the highest one, which might have been expected. Even if there are evident differences in the scores showing strong differences in computer skills, an adequate knowledge on average is not found in any category essentially because of the large variability within each professional category.
Finally, findings concerning the “sector of activity” are in accordance with our expectations about the relevance of computer knowledge in the various economic sectors. The highest score averages are obtained by persons working in the fi-nance (14.3) and in the “real estate activities, rental service, informatics, research, enterprise services” (13.2) sectors, while the worst performances are related to persons working in “hotels and restaurants” (7.7) and “health and social assis-tance” (6.8).
TABLE 6
Means calculated for the modalities of the relevant endogenous characteristics
CHARACTERISTIC MODALITIES (n) MEAN OF TEST Frequency of computer use Daily (685) 12.0
From time to time (230) 7.2 Use of computer at work* Yes (541) 11.4 No (125) 8.8 Use of computer at home Yes (757) 11.4 No (158) 8.6 Use of computer for work * Yes (571) 11.2 No (95) 9.1 Use of computer for study,
entertainment or information Yes (793) 11.6 No (122) 6.8 Occupation* Legislators, senior officials, managers and
professionals (37) 10.9 Technicians and associate professionals (94) 12.5
Clerks (237) 12.2
Service workers and shop and market sales
workers (42) 6.4 Craft and related trades workers (15) 8.9 Plant and machine operators and assemblers (93) 8.7 Sector of activity* Agriculture (13) 10.5 Manufacturing industries (202) 10.5 Mining; production and distribution of electric
power, gas and water (9) 8.5
Buildings (26) 12.1
Wholesale and retail trade (107) 9.1 Hotels and restaurants (15) 7.7 Transport, storage and communication (20) 11.6
Finance (29) 14.3
Real estate activities, rental, informatics, research,
enterprise services (120) 13.2
Public administration (36) 12.6 Instruction (32) 9.9
Health and social assistance (25) 6.8 Other public, social and personal services (21) 9.1 * Only for employees and unemployed persons.
3.4. The analysis of different patterns of demosnstrated knowledge
In the sections 3.1 and 3.2 we have measured the performance of each individ-ual looking at the number of correct answers given on the whole. In that ap-proach we did not consider the different combination of computer applications that persons could have. Now we concentrate on which particular computer ap-plications (section of the questionnaire) persons are more/less capable and what are the combinations of competences more spread among individuals. With this purpose we analyse our survey information taking into account of the number of adequate answers provided in each computer applications and how the results for each application combines. In order to carry out such analysis the following stan-dards of competence for each section have been adopted:
– if a respondent gave at least three correct answers to the five questions of a section s/he was considered to have an adequate practical knowledge (S) in that application;
– otherwise the respondent failed the test in that application (I).
Since we considered six types of computer applications, following this ap-proach we get a total of 26 =64 different potential combinations (patterns) of
competences. Among them, 48 are followed by at least one respondent and the other 16 have frequency 0. Therefore several skill combinations arise pointing out the difficulty in defining the general degree of computer knowledge and the need to distinguish among different applications.
The most relevant patterns are reported in Table 7. Patterns observed for a very small number of respondents have been omitted (less than 1% of the set of 915 respondents). The resulting table then, refers to a sub-sample of 887 units.
Three patterns arise as the most frequent: a) persons who failed in all the six
applica-tions (14.5%); b) persons having adequate competence in the three applications “managing
files”, “word processing” and “basic web-search” (14.8%); c) persons having adequate
compe-tence in the four applications “managing files”, “word processing”, “spreadsheets” and “basic web-search” (14.1%).
The most important conclusions that can be drawn from these results is that competence in computer applications is not satisfactory (better quite poor) par-ticularly because it is often limited to very few kinds of core applications. In fact a high proportion of individuals did not pass the test in any section, moreover 15.7% passed the test in just one section, and another large set of individuals was able to pass the test in just a couple of sections (23%) and, finally, only 23% of those who decided to try to answer the test shows a broad knowledge of the main computer programs used, broad knowledge being defined as passing the test in at least four sections whatever they are.
Probably these results depend on the fact that skills most commonly required at work places are mainly word processing or spreadsheet skills or because some persons use the computer only for entertainment (mostly basic web-searching). In any case, we cannot forget that another 20% of the population considered does not use computers at all.
TABLE 7
Different patterns of performances
N. of
pattern MANAGING FILES PROCESSINGWORD SPREAD-SHEETS BASIC WEB-SEARCH DATA-BASEACCESS
WEB PAGE CONSTRUC- TION % 1 I I I I I I 14.5 2 S I I I I I 4.7 3 I S I I I I 5.1 4 I I S I I I 1.0 5 I I I S I I 4.9 6 S S I I I I 8.6 7 S I S I I I 1.0 8 S I I S I I 5.4 9 I S S I I I 1.5 10 I S I S I I 4.9 11 I I S S I I 1.3 12 S S S I I I 3.9 13 S S I S I I 14.8 14 S I S S I I 1.9 15 I S S S I I 2.4 16 S S I S I S 1.2 17 S S S S I I 14.1 18 S S S S S I 3.4 19 S S S S I S 1.2 20 S S S S S S 1.1
Some serious concerns arise from these figures which demonstrate that a very large part of the young population does not have adequate computer skills to face the challenges of the new economy. But another question arises: is it only a prob-lem of lack in individual computer skills or do results also depend upon a scarce supply of qualified computer skills within firms operating in the region? These are important questions that would require further study.
A second aspect concerns the absence of a “hierarchy” among various skills. In fact the most relevant patterns are combinations of capabilities that do not seem to depend on each other. In fact three kinds of competence prevail, those related to “managing files”, “word processing” and “basic web-search”, which are asso-ciated with competences in different other computer applications.
From the evidence presented we conclude that in general, computer education is not systematic and mostly based on self-learning. Schools should pay more at-tention and devote more resources to teaching computer science and its applica-tions.
Finally, knowledge on database management and building web pages is very rare, as demonstrated by the very low percentages of persons passing the tests in these sections (Table 8). The absence of these skills, which are considered to be crucial for businesses in the new economy, probably indicates an educational gap and a problem for businesses looking for qualified workers. It might also indicate a lack of demand from businesses for these skills because of the lag in developing new processing strategies and new goods.
TABLE 8
Demonstrated competence per application
APPLICATION n % Managing files 582 63.6 Word processing 592 64.7 Spreadsheets 493 34.2 Basic web-search 529 57.8 Access database 147 7.4 Web page construction 98 4.0
The next question that should be addressed is to understand if some relation-ship between computer skills and particular individual characteristics can be found. In other words, are persons’ computer skills independent from their socio-demographic characteristics? Are persons demonstrating approximately the same competences also similar with respect to some other characteristics? This analysis would be useful to shed light on the role played by demand for labor on human capital skills.
Not all patterns could be considered because of the sample size, therefore we focused on the largest and more significant subsets of respondents as those where individuals obtained the best and the worst results. In particular we de-cided to perform the analysis in two steps. First, the largest patterns (number 1, 13 and 17) have been considered. They represent the worst results (pattern 1), good results (number 17), and an intermediate situation (pattern 13). Next, we considered a different approach which consisted of looking at six groups of
re-spondents made up by people with adequate knowledge in each of the six sec-tions, independently from their performance in the other sections. This second sort of analysis allows us to investigate possible connections between the charac-teristics of individuals and adequate knowledge of a single application.
In both steps the distributions of the mentioned patterns/subsets, according to both the endogenous and exogenous characteristics listed in section 3.3, were compared to those of the whole set of respondents (n=915). The comparison was carried out by performing a chi-square goodness-of-fit test for one-way ta-bles, whose null hypothesis specifies equal proportions of the total sample size for each class. Findings of these tests highlight that some distributions are signifi-cantly different and patterns are strongly characterized by some individual fea-tures (Table 911).
Persons failed in all sections (pattern 1, n = 133) are mainly occasional PC us-ers. In fact this pattern is characterized by a higher incidence of the features con-nected to the lowest averages of the test score (higher percentage of women, per-sons with an “up to lower secondary education”, older perper-sons, part-time work-ers, “plant and machine operators and assemblers”, see section 3.3).
On the contrary pattern 17 (n = 129), persons that passed the test in the four sections “managing files”, “word processing”, “spreadsheets” and “basic web-search”, is characterized by higher percentages of those features associated to the highest average scores (university graduates, full-time workers, clerks and techni-cians and associate professionals, workers in “real estate activities, hiring, informat-ics, R&D, services to firms”, persons having taken one or more training courses). All persons of this group use the computer daily and the score they obtained in the test (15.6) is much higher than that observed in the whole sample (10.6).
The last pattern (13, n = 135), containing persons with an adequate compe-tence in the three sections “managing files”, “word processing” and “basic web-search”, represents an intermediate situation between the whole set of the re-spondents and the previous pattern (in fact it differs from pattern 17 only in the lack of “spreadsheet” abilities). This result is not surprising as this pattern is con-nected to a medium level of knowledge. It is interesting to note that the group is composed above all by students (40%) (students represent only 13% in the pat-tern 17 and only 25% in the whole sample) showing that students utilize only the very basic computer applications and in any case to applications do not finalized to data analysis.
Therefore the new evidence arising from this analysis, with respect to the re-sults of the previous section, is that the three patterns analyzed are substantially representative of three individuals typologies: the part-time workers (pattern 1), the full-time workers (pattern 17) and the students (pattern 13).
Regarding the second step of analysis, we observe that the first four groups of persons who passed the test in “managing files” (n=582), “word processing” (n=592), “spreadsheets” (n=313) and “basic web-search” (n=529) show
11 In table 9 results of the chi-square test are reported only for those groups and those characte-ristics leading to the rejection of the null hypothesis.
teristics very similar to the whole sample but their performance on the test was slightly higher. Obviously, this is due to the exclusion of individuals who failed in all the six sections that represent a large pattern as we have already seen. On the other hand, groups composed of those who passed the test in “access database” and in “web page construction” show very specific characteristics as reported in Table 9. Even though the small size of these groups limits the reliability of the analysis (respectively 68 and 37 units) it is useful to report on their characteristics. In the group of persons with an adequate knowledge of “access database”, there is a high percentage of men, of university graduates, of workers, of technicians and associate professionals and of individuals who have taken a training course. This group also obtained particularly high scores in the other computer applica-tions showing a high global practical knowledge of computer use. They achieved, an average a score of 19 in the test (the average of the total is 10.6). Also the group of individuals with adequate knowledge of “web page construction” is found to be highly skilled with an average score of 19, and with characteristics similar to those from the previous group.
TABLE 9
Features characterizing the most relevant patterns and different kinds of knowledge
PATTERN
n. Modalities of the relevant characteristics Group % sample % Whole
1 Female
Up to lower secondary education Part-time workers
Plant and machine operators and assemblers
Workers in the sector of activity “Wholesale and retail trade” Persons using the computer from time to time
75 29 12 30 20 52 56 14 8 17 12 25 13 University graduates Students
Clerks and technicians and associate professionals
Workers in “real estate activities, rental, informatics, R&D, services to firms” Persons having taken a training course
Persons using the computer daily
19 41 26 12 27 79 18 25 36 13 26 75 17 University graduates Full-time workers
Clerks and technicians and associate professionals
Workers in “real estate activities, rental, informatics, R&D, services to firms” Persons having taken a training course
Persons using the computer daily
28 60 53 22 34 100 18 50 36 13 26 75 Adequate
knowledge of Modalities of the relevant characteristics Group % sample % Whole
Access
database Male University graduates Workers
Persons having taken a training course Persons using the computer daily
Persons working in the “real estate activities, rental, informatics, research, enterprise services” sectors
Technicians and associate professionals
71 37 81 41 91 28 28 44 18 71 26 75 13 18 Web page
construction Male Persons with a upper secondary education and graduates Students
Persons having taken a training course Persons using the computer daily
Persons working in the “real estate activities, rental, informatics, research, enterprise services” sectors 73 97 65 32 89 24 44 85 25 26 75 13
It seems interesting to note that only a third of those who passed the test in “web page construction” also passed the test in “access database”. This demon-strates that there is not a strong relationship between these two types of skills. Another interesting difference between the last two groups is related to “em-ployment status”, because the group with adequate knowledge of “web page con-struction” is characterized by the presence of a high percentage of students (35%), while that percentage is only 16% in the group “access database” (25% for all respondents). Therefore the knowledge of data base management seems to be more related to some specific professions.
4. CONCLUDING REMARKS AND FUTURE WORK
This paper presents the results of a survey carried out to evaluate computer skills of young people in the specialized districts of the Emilia-Romagna Region. We had two main goals. First to evaluate the practical knowledge of core com-puter applications of a large part of the population in a rich and high industrial-ized area of Italy. The results should serve to obtain insights about the Italian economy’s ability to tackle the challenges arising from the new economy. The second goal was to experiment with and to identify a measurement strategy able to evaluate computer skills using a common survey strategy and questionnaire and avoiding the traditional psychological approach to the evaluation of skills which is time consuming, expensive and requires highly qualified staff. The idea was to test an instrument that can be applied frequently, and if possible, in con-nection with traditional labor force surveys, in order to obtain reliable statistics on human capital’s practical skills. Moreover, we were interested in checking the reliability of data based on self-evaluations about personal skills, because of the difficulties associated with properly evaluating one’s own capabilities.
To this purpose we designed a questionnaire whose questions concern the knowledge of some important and general computer applications. The questions asked were based on the European and Computer Driving License. As in a writ-ten examination, the criteria for judging individual skills was the number of cor-rect answers. Test results were compared with those obtained from the self-evaluations.
The experiment has been successful and the evidence is interesting. People did not refuse to participate in the survey, and they were involved and interested in the survey-test. The average duration of interviews was about 20 minutes. Thus it seems clear that it is possible to apply the approach proposed here to further sur-veys. Survey results demonstrate that often self-evaluation fails to capture an ac-curate portrayal of actual individual knowledge. In many cases people’s evaluation of their own skills was not confirmed by the answers given to the specific test questions on the computer applications in question. Consequently, another con-clusion is that it is necessary to be cautious about using self-evaluation in the field of skills measurement.
pro-posed to collect data on other particular competences and skills. Since some data about skills requested by firms is available (Grubb, 1996; Moss and Tilly, 1996), our methodology could be used to obtain information on labor force skills, and subsequently to evaluate any mismatch between demand for and supply of quali-fied workers. This comparison would constitute a crucial aspect of the labor mar-ket analyses.
Finally, in a country like Italy with strong educational and occupational territo-rial differences, a comparison with other regions, above all with regions of the South, would be important for understanding and measuring the territorial dis-parities in the computer skills. For instance, from the multipurpose surveys car-ried out by ISTAT at national level, the “region” results as one of the strongest determinants of access to multimedia among children (Morrone and Zannella, 2004). Hence the extension of our experiment to other regions would be an im-portant goal for future work.
Regarding the evidence stemming from the survey, some important issues were found. First of all we conclude that the spread of practical computer skills is un-satisfactory. This is especially true since the target population of this study is quite young (20-35 years old) and therefore should be quite familiar with computers and their applications. In fact, since computer use is widespread (80% of the population considered use computers), we found that about 1/3 of persons who tried to reply to questions failed the test in all applications or passed the test just in one of them. Thus, real practical knowledge of different (more than three) computer applications is limited to some small subsets of the whole population. This is especially true when the most sophisticated applications are considered, such as “data base management” and “web page construction”, knowledge of which is very rare.
Secondly, we discover that competencies in computer skills are strongly corre-lated to some personal socio-demographic characteristics: gender, educational level, occupation and sector of activity. In particular, the best performances in the test, in terms of both global score and number of applications for which the competences are demonstrated, are mainly obtained by persons having particular features, such as “male”, “university graduate”, persons working in the “real es-tate activities, rental service, informatics, research, enterprise services” sectors and people working as “technicians and associate professionals. Similarly the worst performances are often observed jointly with some other particular features as “female”, “up to lower secondary education”, “part-time workers”, persons working in the sectors of activity “wholesale and retail trade” and “health and so-cial assistance” and persons working as “plant and machine operators and assem-blers” or “service workers and shop and market sales workers”. This evidence in-creases understanding which characteristics should be taken into account as prox-ies when it is necessary to incorporate human skills in the analysis but specific data on those skills are not available.
A third issue arises from our data: schools and companies need to make a seri-ous and joint effort to improve computer knowledge, as demonstrated also from studies carried out in other countries (Valenduc and Vendramin, 2005). The
“de-signing of innovative ICT skills training solutions” is also one the European Commission’s main priority actions. In particular, the EC is concerned to take into account the particular needs of women and different age groups, offering ef-fective incentives and applying the most appropriate teaching and pedagogic techniques (European Commission, 2004). Moreover the need for Governments to develop specific training policies in order to compensate for the lack of highly skilled workers for high-skilled jobs, is highlighted in various studies (O’Sullivan and Lloyd, 2004; Gallina, 2005). These studies emphasize that the consequences arising from shortages of highly skilled labor force could be negative effects on employability, productivity development and competitiveness (European Com-mission, 2004).
Dipartimento di Scienze Statistiche CARLO FILIPPUCCI
Università di Bologna SILVIAPACEI
REFERENCES
M.R. ANDERBERG, (1973), Cluster Analysis For Applications, Academic Press, New York. J. ALTONJI, C. PIERRET, (2001), Employer Learning and Statistical Discrimination, “The Quarterly
Journal of Economics”, 116, 4, pp. 313-350.
P.A. CHIAPPORI, B. SALANIÉ, J. VALENTIN, (1999), Early Starters versus Late Beginners, “Journal of
Political Economy”, 107, 4, pp. 731-760.
W.G. COCHRAN, (1977), Sampling Techniques, New York, Wiley.
M.G. COLOMBO, L. GRILLI,(2004), Does Founders’ Human Capital Affect the Growth of New Tech-nology-based Firms? A Competence-based Perspectiv, paper presented at the 10th Conference
of the Schumpeterian Society, Milan, 9-12 June.
C. DEMUNTER, (2004), Digital Divide and Access to ICT Skills, a Comparative Overview, The
European E-Skills Conference, 20-21 September 2004.
C. DUVEL, S. PATE, (2003), Computer Knowledge: Report from a Student Self Evaluation, “Journal of
Industrial Technology”, vol. 20, n. 1, pp. 2-16.
EUROPEAN COMMISSION, (2004), E-Skliis For Europe: Towards 2010 and Beyond, The European
E-Skills Conference, 20-21 September 2004, Synthesis Report.
EUROSTAT,(2004), Digital Divide abd Access to ICT Skills, a Comparative Overview, The
Euro-pean E-Skills Conference, 19-20 September 2004, Thessaloniki (EL).
H.S. FARBER, R. GIBBONS, (1996), Learning and Wage Dynamics, “The Quarterly Journal of
Eco-nomics”, 111, 4, pp. 1007-1047.
D. FORAY, B.A. LUNDVALL, (1996), The Knowledge-Based Economy: from the Economics of Knowledge to the Learning Economy, in OECD, “Employment and Growth in a Knowledge-based
Economy”, Paris. Repris en extrait in D. Neef, G.A. Siesfeld & J. Cefola (Eds.), The
Economic Impact of Knowledge, Butterwoth/Heinemann, Boston, pp. 115-121.
V. GALLINA,(2005), Adult Literacy and Life Skills, Statistics Canada-OCESE, http://www.
invalsi.it/ri2003/all/pdf/Prima_sintesi_risultati.pdf.
W.N. GRUBB, (1996), Learning to Work: The Case for Reintegrating Job Training and Education,
Russel Sage Foundation, New York.
ISTAT,(1997), I sistemi locali del lavoro, Roma.
ISTAT, (2003), Telefono fisso e cellulare: comportamenti emergenti, “Statistiche in breve”.
ISTAT,(2004), Cultura, società e tempo libero. Indagine multiscopo sulle famiglie “Aspetti della vita quo-tidiana” Anno 2002, “Collana di informazioni”, 17.
J.C. KUNDER, M.W. RICHARDSON, (1937), The Theory of the Estimation of Test Reliability,
“Psycho-metrika”, 2, pp. 151-160.
R. LAWSON, C. DE MATOS, (2000), Information Technology Skills in the Workplace: Implications for Bachelor of Art Degrees, “Australian Journal of Education”, 16, 2, pp. 87-103.
L. MATEI, (2003), Impact of New Technology on Public Organisations, “The 11th NISPAcee
An-nual Conference”, Bucarest, 10-12 April 2003.
M. MCMILLEN, B. HARRIS-KOJETIN, R. MILLER, A. WARE-MARTIN, (2001), Nonresponse Error, in
Sta-tistical Policy, Working Paper 31, Measuring and Reporting Sources of Error in Sur-veys, Executive Office of the President of the United States.
A. MORRONE, L. ZANELLA, (2004), IT and Mass Media Use among Italian Youth, “IT&Society”, 1,
6, Fall/Winter, pp. 59-67.
P. MOSS, C. TILLY,(1996), Growing Demand for “Soft” Skills in Four Industries: Evidence from In-Depth Employer Interviews, Russel Sage Foundation, New York.
OECD, (2002), PISA 2000 Technical Report, edited by Ray Adams and Margaret Wu.
J. O’SULLIVAN, N. LLOYD, (2004), Background Papers, “The European E-Skills Conference”,
20-21 September 2004.
REGIONE TOSCANA, (2005), Indagine I cittadini toscani e la radio. http://www.regione.toscana.
it/cif/pubblica/indradio05/Rapporto_Radio_Locali.pdf
P.M. ROMER, (1990), Human Capital and Growth: Theory and Evidence, Unit Roots, Investment Measures and Other Essays, “Carnegie Rochester Conference Series on Public Policy”, 32,
Spring, 1990, 251-86.
H. SCHEFFE, (1959), The Analysis of Variance, John Wiley & Sons, New York.
B.W. SILVERMAN,(1986), Density Estimation for Statistics and Data Analysis, Chapman and Hall,
London.
F. SFORZI,(1997), I sistemi locali del lavoro 1991, Istituto Nazionale di Statistica, Roma. UNESCO,(2003), Report of the Global Review of the Unesco Associated Schools Project. Results,
Rec-ommendations and Conclusions, UNESCO ASPnet, “Quality Education of the 21th
Cen-tury”, Auckland, New Zealand, 2-8 August 2003.
G. VALENDUC, P. VENDRAMIN, (2005), Work Organisation and Skills in ICT Professions: the Gender Dimension, “Conference ICT, the Knowledge Society and Changes in Work”, Den
Haag, 9-10 June 2005.
Y. ZANG, S. ESPINOZA, (1997), Affiliations of Computer Self-Efficacy and Attitudes with Need for Learning Computer Skills, “Journal of Educational Computing Research”, 14, 4, pp.
371-383.
SUMMARY Measuring competence in computer skills
The increasing importance of ICT in a knowledge-based economy highlights the need for statistical information on its diffusion. In Italy, a few information is collected from sample surveys on firms, while no information on labor force capabilities is available. We carried out a sample survey on individual skills, focusing on the use of core computer ap-plications. The aim is to suggest an instrument that could be integrated into current la-bour force surveys for improving statistics on human capital. The experiment was suc-cessful and results highlight practical knowledge of different computer applications is lim-ited to some subsets of the population.