2015
Publication Year
2020-04-04T09:51:04Z
Acceptance in OA@INAF
Analysis of phase patterns in photochromic polyurethanes by a holographic
approach
Title
BIANCO, ANDREA; Coppola, Giuseppe; Ferrara, Maria Antonietta; PARIANI,
Giorgio; Bertarelli, Chiara
Authors
10.1364/OME.5.002281
DOI
http://hdl.handle.net/20.500.12386/23846
Handle
OPTICAL MATERIALS EXPRESS
Journal
5
Number
Analysis of phase patterns in photochromic
polyurethanes by a holographic approach
Andrea Bianco,1,* Giuseppe Coppola,2 Maria Antonietta Ferrara,2 Giorgio Pariani,1 andChiara Bertarelli3
1INAF – Osservatorio Astronomico di Brera, via Bianchi 46, Merate, 23807, Italy 2CNR – Institute for Microelectronics and Microsystems, via P. Castellino 111, Napoli, 80131, Italy 3Dipartimento di Chimica Materiali ed Ingegneria Chimica, Politecnico di Milano, P.zza L. da Vinci 32, Milano,
20133, Italy
Abstract: Photochromic polyurethanes based on diarylethene units show a large reversible modulation of refractive index in the Vis-NIR spectral region. The change of refractive index in the material is easily induced by visible laser illumination, without any optical or chemical post-process. In this paper, patterns at the micron scale range have been written by a suitable direct laser writing machine and characterized at 1550 nm by means of a digital holographic approach. The refractive index profile has been retrieved, its dependence on the film thickness and writing speed was shown. The writing process has also been modelled by means of a kinetic model, showing theoretically the dependence of the pattern width and profile on the writing conditions. It is demonstrated that the photochromic films are suitable for developing a reconfigurable platform for complex phase patterns working in the NIR.
©2015 Optical Society of America
OCIS codes: (160.5335) Photosensitive materials; (160.4670) Optical materials; (090.1995)
Digital holography; (310.6860) Thin films, optical properties
References and links
1. B. V. Gemert, “The commercialization of plastic photochromic lenses: A tribute to John Crano,” Mol. Cryst. Liquid Cryst. 344(1), 57–62 (2000).
2. C. Yun, J. You, J. Kim, J. Huh, and E. Kim, “Photochromic fluorescence switching from diarylethenes and its applications,” J. Photochem. Photobiol. Photochem. Rev. 10(3), 111–129 (2009).
3. C. Bertarelli, A. Bianco, R. Castagna, and G. Pariani, “Photochromism into optics: Opportunities to develop light-triggered optical elements,” J. Photochem. Photobiol. Photochem. Rev. 12(2), 106–125 (2011). 4. A. Bianco, S. Perissinotto, M. Garbugli, G. Lanzani, and C. Bertarelli, “Control of optical properties through
photochromism: a promising approach to photonics,” Laser Photonics Rev. 5(6), 711–736 (2011).
5. M. Irie, T. Fukaminato, K. Matsuda, and S. Kobatake, “Photochromism of diarylethene molecules and crystals: Memories, switches, and actuators,” Chem. Rev. 114(24), 12174–12277 (2014).
6. I. Bennion, A. G. Hallam, and W. J. Stewart, “Optical waveguide components in organic photochromic materials,” J. Int. Electron. Rad. Eng. 53(9), 313–320 (1983).
7. N. Tanio and M. Irie, “Photooptical Switching of Polymer Film Wave-Guide Containing Photochromic Diarylethenes,” Jpn. J. Appl. Phys. 33(1), 1550–1553 (1994).
8. J. Biteau, F. Chaput, K. Lahlil, J. P. Boilot, G. M. Tsivgoulis, J. M. Lehn, B. Darracq, C. Marois, and Y. Levy, “Large and stable refractive index change in photochromic hybrid materials,” Chem. Mater. 10(7), 1945–1950 (1998).
9. J. W. Kang, J. S. Kim, C. M. Lee, E. Kim, and J. J. Kim, “1 x 2 all-optical switch using photochromic-doped waveguides,” Electron. Lett. 36(19), 1641–1643 (2000).
10. J. W. Kang, E. Kim, and J. J. Kim, “All-optical switch and modulator using photochromic dye doped polymer waveguides,” Opt. Mater. 21(1-3), 543–548 (2003).
11. S. W. Jang, Y. H. Yun, D. E. Kim, S. J. Lim, S. Y. Park, Y. H. Lee, and S. W. Kang, “Refractive index change by photoinduction of a UV-sensitive SMF-to-PWG coupler,” IEEE Photonics Technol. Lett. 18(1), 220–222 (2006).
12. S. Luo, K. Chen, L. Cao, G. Liu, Q. He, G. Jin, D. Zeng, and Y. Chen, “Photochromic diarylethene for rewritable holographic data storage,” Opt. Express 13(8), 3123–3128 (2005).
13. P. Spanò, F. M. Zerbi, C. J. Norrie, C. R. Cunningham, K. G. Strassmeier, A. Bianco, P. A. Blanche, M. Bougoin, M. Ghigo, P. Hartmann, L. Zago, E. Atad-Ettedgui, B. Delabre, H. Dekker, M. Melozzi, B. Snÿders, R. Takke, and D. D. Walker, “Challenges in optics for Extremely Large Telescope instrumentation,” Astron. Nachr.
327(7), 649–673 (2006).
14. Y. Boiko, “Improvement of thermal stability in photochromic holograms,” Opt. Lett. 34(8), 1279–1281 (2009). 15. A.-L. Baudrion, A. Perron, A. Veltri, A. Bouhelier, P.-M. Adam, and R. Bachelot, “Reversible Strong Coupling
in Silver Nanoparticle Arrays Using Photochromic Molecules,” Nano Lett. 13(1), 282–286 (2013).
16. D. Nau, R. P. Bertram, K. Buse, T. Zentgraf, J. Kuhl, S. G. Tikhodeev, N. A. Gippius, and H. Giessen, “Optical switching in metallic photonic crystal slabs with photoaddressable polymers,” Appl. Phys. B 82(4), 543–547 (2006).
17. D. Sridharan, E. Waks, G. Solomon, and J. T. Fourkas, “Reversible tuning of photonic crystal cavities using photochromic thin films,” Appl. Phys. Lett. 96(15), 153303 (2010).
18. T. Cai, R. Bose, G. S. Solomon, and E. Waks, “Controlled coupling of photonic crystal cavities using photochromic tuning,” Appl. Phys. Lett. 102(14), 141118 (2013).
19. C. Toccafondi, L. Occhi, O. Cavalleri, A. Penco, R. Castagna, A. Bianco, C. Bertarelli, D. Comoretto, and M. Canepa, “Photochromic and photomechanical responses of an amorphous diarylethene-based polymer: a spectroscopic ellipsometry investigation of ultrathin films,” J. Mater. Chem. C Mater. Opt. Electron. Devices
2(23), 4692–4698 (2014).
20. A. Bianco, G. Pariani, C. Bertarelli, and F. M. Zerbi, “Photochromic polymers for making volume phase holographic gratings: between theory and practice,” Proc. SPIE 7739, 77394P (2010).
21. G. Pariani, R. Castagna, G. Dassa, S. Hermes, C. Vailati, A. Bianco, and C. Bertarelli, “Diarylethene-based photochromic polyurethanes for multistate optical memories,” J. Mater. Chem. 21(35), 13223–13231 (2011). 22. A. Bianco, G. Pariani, A. Zanutta, R. Castagna, and C. Bertarelli, “Photochromic materials for holography:
Issues and constraints,” Proc. SPIE 8281, 828104 (2012).
23. M. K. Kim, “Principles and techniques of digital holographic microscopy,” SPIE Rev. 1, 018005 (2010). 24. L. Xu, X. Peng, J. Miao, and A. K. Asundi, “Studies of digital microscopic holography with applications to
microstructure testing,” Appl. Opt. 40(28), 5046–5051 (2001).
25. F. Charrière, N. Pavillon, T. Colomb, C. Depeursinge, T. J. Heger, E. A. D. Mitchell, P. Marquet, and B. Rappaz, “Living specimen tomography by digital holographic microscopy: morphometry of testate amoeba,” Opt. Express 14(16), 7005–7013 (2006).
26. G. Di Caprio, M. A. Ferrara, L. Miccio, F. Merola, P. Memmolo, P. Ferraro, and G. Coppola, “Holographic imaging of unlabelled sperm cells for semen analysis: a review,” J. Biophotonics to be published.
27. F. Verpillat, F. Joud, P. Desbiolles, and M. Gross, “Dark-field digital holographic microscopy for 3D-tracking of gold nanoparticles,” Opt. Express 19(27), 26044–26055 (2011).
28. C. A. Schneider, W. S. Rasband, and K. W. Eliceiri, “NIH Image to ImageJ: 25 years of image analysis,” Nat. Methods 9(7), 671–675 (2012).
29. J. Goodman, Introduction to Fourier Optics, 2nd ed. (McGraw-Hill, New York, 1996).
30. C. Wagner, S. Seebacher, W. Osten, and W. Jüptner, “Digital recording and numerical reconstruction of lensless fourier holograms in optical metrology,” Appl. Opt. 38(22), 4812–4820 (1999).
31. G. Di Caprio, P. Dardano, G. Coppola, S. Cabrini, and V. Mocella, “Digital holographic microscopy characterization of superdirective beam by metamaterial,” Opt. Lett. 37(7), 1142–1144 (2012).
32. G. Coppola, P. Ferraro, M. Iodice, S. D. Nicola, A. Finizio, and S. Grilli, “A digital holographic microscope for complete characterization of microelectromechanical systems,” Meas. Sci. Technol. 15(3), 529–539 (2004). 33. P. Ferraro, S. De Nicola, A. Finizio, G. Coppola, S. Grilli, C. Magro, and G. Pierattini, “Compensation of the
inherent wave front curvature in digital holographic coherent microscopy for quantitative phase-contrast imaging,” Appl. Opt. 42(11), 1938–1946 (2003).
34. E. Cuche, F. Bevilacqua, and C. Depeursinge, “Digital holography for quantitative phase-contrast imaging,” Opt. Lett. 24(5), 291–293 (1999).
35. U. Schnars and W. Jüptner, “Direct recording of holograms by a CCD target and numerical reconstruction,” Appl. Opt. 33(2), 179–181 (1994).
36. D. C. Ghiglia and M. D. Pritt, Two-Dimensional Phase Unwrapping: Theory, Algorithms, and Software (Wiley-Interscience, New York, 1998).
37. G. Pariani, A. Bianco, R. Castagna, and C. Bertarelli, “Kinetics of Photochromic Conversion at the Solid State: Quantum Yield of Dithienylethene-Based Films,” J. Phys. Chem. A 115(44), 12184–12193 (2011).
1. Introduction
Photochromic materials have been known for a long time thanks to their reversible change in color that has found application in photochromatic lenses [1]. Actually, the potential applications of photochromic materials are wider and not only related to the change in color; indeed, the photochromic conversion induces a change in many properties other than color, such as refractive index, vibrational spectrum, fluorescence signal [2–5]. Among the different classes of photochromic materials, diarylethenes have found a large interest thanks to the good overall photochromic properties and their thermal stability [5].
The reversible change in refractive index of photochromic systems has been proposed for making different devices, namely waveguides and phase modulators [6–11], holographic memories [12] and holographic optical elements [13, 14]. Moreover, they have been applied to tune the coupling with metallic nanoparticles [15] and to optical switch and tune photonic crystal properties [16–18].
The key advantages of using photochromic materials are two: i) the device is ready to be used just after the film deposition or the laser writing procedure; in other words, no post processing is required (chemical developing, fixation, etching,…); ii) the photochromic switching is reversible, hence the written patterns are rewritable. Therefore, looking at the change in the refractive index, a photochromic film can be considered as a reconfigurable platform to easily make phase patterns, such as computer generated holograms, optical waveguides, etc.
The extent of modulation of the refractive index and transparency depends on the chemical structure of the photochromic moiety and, more important, on its concentration in the active substrate [3]. For this reason, the largest values of Δn have been obtained in backbone diarylethene polymers [3, 19, 20]. We have recently demonstrated a photochromic polyurethane that combines an effective and tuneable photochromic switching with very good optical properties [21], the latter being a fundamental requirement to develop optical elements.
The issue is actually more complex, since the whole photochromic material has to be converted through the whole volume of the film to achieve the maximum modulation of the target property (e.g. refractive index) . However, this is prevented when both photochromic forms absorb the switching radiation (it occurs in the UV range) and the film thickness is large [22]. The film thickness is one of the design parameters in phase modulators such as in waveguides, therefore its optimization is strongly related to the performances of the device.
It is also worth noting that the refractive index modulation (Δn) is usually measured by means of ellipsometry or spectral reflectance on very thin films (50 – 400 nm), which are not often suitable for practical applications such as for waveguides and holographic volume phase elements. For such thin films, a full conversion can be surely achieved, therefore the measured Δn corresponds to the maximum achievable. Moreover, the photochromic layer is irradiated over the whole area, without writing any pattern. All these conditions are far from reality, hence the Δn measurement of the substrate that is actually used for the device fabrication is crucial.
Digital holographic (DH) imaging is a technique that builds a 3D structure of a sample exploting the unique properties of holography, so basically by generating a 3D phase map of the sample [23]. For this reason, DH has been successfully applied for testing microelectro- mechanical systems (MEMS) [24], bioorganisms recognition [25, 26], and nanoparticle detection [27].
Using digital holography, we study here not only the modulation of the refractive index in the near-infrared (throught the phase modulation), but also the refractive index profile of micro-scale structures written with direct laser writing technique on a photochromic polymer layer. Moreover, we model both the light-triggered coloration and decoloration processes in order to understand the photochromic fast conversion through the thickness and the effect of the writing parameters in determining the size and shape of the final features. We find a strong dependence of the feature size on the writing speed that can be suitably exploited in the transferring of complex patterns and we show the strong modulation of refractive index and transparency in photochromic substrates.
2. Film preparation and experimental setups
2.1 Photochromic films
The synthesis of the photochromic polyurethane consists in the reaction between an aliphatic diisocianate (H12MDI) a polyol and a photochromic dialcohol belonging to the class of
diarylethenes (namely, 1,2-bis-(5-p-hydroxymethylphenyl-2-methyl-3-thienyl)hexa-fluorocyclopentene) in butylacetate. Details on the procedure are described in the reference [21]. The relative quantity of the photochromic monomer was varied between 20 and 40% wt. on the total mass, always maintaining the stoichiometry of the reaction. All the reagents were mixed, the solution batch was filtered (0.20 μm PTFE) and deposited by means of a control coater (RK K control coater) equipped with Wedge bars or spin coating (LAURELL WS-400 B-6NPP Lite) on glass substrates. The in situ polymerization was carried out at 130°C for eight hours. The film thickness was calculated by fitting the reflectance spectrum of the film in the uncolored form (measured with a Filmetrics F20EXR) in the spectral range 400 – 1700 nm.
2.2 Direct laser writing set-up
The direct laser writing setup consists in two perpendicular motorized stages that support the sample and allows for translations in the XY directions. A red diode laser (650 nm) is fiber fed and is focused on the sample by means of an aspheric lens. A simple focusing monitor makes the finding of the best focus position possible. A custom made software reads a dxf file with the list of structures to transfer and drives the stages and the switching of the laser. The laser power at the exit of the focusing lens was 0.66 mW, and the beam diameter 7.5 μm. The photochromic films were initially exposed to an UV lamp at 365 nm (2.5 mW/cm2) to convert the material to the colored form. The transferred pattern consists in a grating with a period of 15 μm over an area of 5x5 mm2. The translation rate of the stages was set to 0.7 mm/s for
sample C1 and 1.1 mm/s for sample C2.
2.3 Optical microscopy and atomic force microscopy (AFM)
The optical images were collected in transmission using an Olympus BX60 microscope equipped with an Olympus objective 20x, NA = 0.4, an halogen lamp as illuminator and an Infinity 2 camera. ImageJ software [28] was used to analyze the collected images (RGB) and determine the intensity profile of the pattern as sum of the three channels (RGB) signal. The AFM (stand-alone Veeco ExplorerTM) has been used in tapping mode with an Antimony-doped Silicon probe (freq. 100-250 kHz) and maps (50x50 μm) of the two samples in the region of the grating pattern have been collected.
2.4 Digitial holography characterizations
The holographic set-up [29–31] is based on a classical Mach–Zehnder configuration (see Fig. 1) and it is aligned onto an optical table provided with active self-leveling isolators, in order to reduce the mechanically introduced noise. A polarized pigtailed external cavity laser (ThorLabs SFL1550P) emitting at a wavelength of λ = 1.55 μm is employed as optical source. The monomodality of the optical fiber of the pigtailed laser assures the spatial filtering of the optical radiation emerging from the fiber. This radiation is collimated by an achromatic fiberport and it is split into two beams, the reference and the object beam respectively, by a polarized beam splitter. The object beam is focused by means of a long-working-distance Mitutoyo microscope objective, with magnification 20× and NA = 0.4, on the transferred pattern of the photochromic film. The beam emerging from the film is then collected by a long-working-distance Mitutoyo microscope objective, whose magnification is 50× and NA = 0.42.
Fig. 1. Holographic setup working with an Infrared fiber laser Source; OFR: collimating lens, WP: λ/2 waveplate, (P)BS: (Polarized) beam splitters with a planarity of λ/8@633nm, AF: adjustable attenuation filter, M: mirrors with a planarity of λ/10@633nm, MO: microscope objectives, L: optical lens, CCD: InGaAs charge-coupled device camera, S: sample.
The object and reference beams are recombined by a second beam-splitter and the resulting interference pattern (i.e. the hologram) is collected onto the surface of a InGaAs CCD camera (XenICs: XEVA-USB-FPA-1.7 with a 320x256 pixels array and a pixel dimension Δx = Δy = 30μm). The interferometric recombination makes possible to encode the phase distribution of the complex wavefield scattered by the photochromic film into an intensity distribution. A λ⁄2 retardation waveplate is mounted on the reference arm in order to maximize the contrast of the fringe pattern compensating some small ellipticity introduced by the optical setup. Moreover, in the optical setup a small angle between the reference and the object beams is introduced. This off-axis configuration permits a spatial separation of the diffraction orders due to the holographic reconstruction [32].
Finally, a double exposure technique was used to remove and/or compensate the unwanted wavefront variations (such as: optical aberrations, slide deformations etc.) introduced by the optical components [33]. The first exposure is made on the region of the transferred pattern, while the second one is made on a reference surface without any transferred pattern. This second hologram contains information about all the aberrations introduced by the optical components, i.e. the defocusing due to the microscope objective.
The image reconstruction procedure allows to rebuild a discrete version of the complex optical wavefront present on the photochromic film. This optical wavefront is obtained by a numerical back propagation of spatially filtered product between the acquired hologram and a numerical replica of the reference beam [32, 34]. The off-axis configuration of the employed setup gives a spatial separation of the diffraction orders due to the holographic reconstruction. Thus, the first diffraction order can be separated from the whole spatial frequency spectrum with a bandwidth filter and shifted to the origin of the plane, providing the spectrum of the retrieved object field. This reconstruction procedure allows to simultaneously determine both the intensity and especially the phase distribution φ(i,j) of the optical wavefront scattered by the film. φ(i,j) is the discretized version of the phase distribution φ(x,y) which incorporates information about the refractive index and thickness of the photochromic film, and i, j identify the i-th row and j-th column of the pixels matrix of the CCD camera. In particular, considering an uniform thickness of the film (d), the distribution of refractive index changes Δn(i,j) can be obtained as follows:
[
]
[
]
Im ( , ) ( , ) ( , ) arc tan 2 2 Re ( , ) Q i j n i j i j d d Q i j λ φ λ π π ∆ = = (1)where Q is the discrete version of the optically reconstructed wavefront, and Im and Re are the imaginary and real part of the reconstructed optical field, respectively.
Since the phase distribution is obtained by a numerical evaluation of the arctan function, its values are restricted in the interval [−π, π], i.e., the phase distribution is wrapped into this range. In order to resolve possible ambiguities arising from thickness differences greater than λ/2, phase-unwrapping methods have to be generally applied [35, 36].
3. Results and discussion
3.1 Modelling and characterization of photochromic patterns
Polyurethane films having different concentrations of the photochromic unit have been produced, with the thickness being reduced while increasing the dye content in order to maintain the overall absorbance for all the samples. Specifically, film C1 is characterized by a content of photochromic diarylethene of 20% wt. and a thickness of 9.2 μm, whereas film C2 by a content of 40% wt. and a thickness of 3.2 μm.
The photochromic polyurethane shows an extinction coefficient as function of the wavelength, as reported in Fig. 2. As in the UV region both the colored and uncolored forms absorb photons, the converted chromophores on the film surface screen out the UV-light during the coloration process. It follows that the photoreaction progressively slows down preventing, in some cases, the total conversion in the whole volume. This effect becomes more relevant for thicker and highly concentrated films, resulting in a threshold thickess that can be completely converted to the colored form, independently on the exposure time and light intensity. A strategy to increase the conversion through the thickness is the illumination of both sides of the samples, if possible. Recently, a kinetic model has been developed to describe this behaviour, that is to simulate the photoconversion at the solid state. The local conversion inside the film thickness is calculated by considering a first order kinetics, as function of the illumination conditions at the film surface, film parameters (film thickness and dye concentration), and the properties of the photochromic moiety (absorption coefficients and photoreaction quantum yields) [37].
Fig. 2. Molar extinction coefficient (ε) of the photochromic films in the colored and uncolored forms (left); photoreaction of the photochromic monomer used for the polyurethane synthesis (right).
The simulations show a similar behavior for C1 and C2 (see Fig. 3): at the beginning, the UV-exposure leads to a fast conversion through the thickness, while it becomes almost constant after 500 s. Therefore, both samples have a threshold thickness for the complete conversion to the colored form which depends on their photochromic content. This threshold can be conveniently calculated as the thickness where the 75% of conversion is reached at the end of the exposure and corresponds to 5 μm for C1 and 2.2 μm for C2. As the film thicknesses of C1 and C2 are actually higher than the threshold values, the complete conversion of the photochromic moieties from the uncolored to the colored forms can be hence achieved only by illuminating the sample on both sides. The knowledge of this threshold limit is essential for the applications, and the correct estimation of the exposure time
is crucial to avoid any unnecessary overexposure to UV light. In fact, when the threshold thickness is reached, a further exposure may turn into degradation of the photochromic film without any remarkable gain in the conversion thickness.
Fig. 3. Conversion maps (fraction of uncolored species) as function of the exposure time at 365 nm (2.5 mW/cm2) through the film thickness; in all maps, the exposure light comes from the left side. a) sample C1 exposed on one side; b) sample C1 reversed after the first exposure and illuminated on the other side; c) sample C2 exposed on one side; d) sample C2 reversed after the first exposure and illuminated on the other side.
The back reaction, i.e. the fading of the film from the colored to the uncolored forms, was induced by means of red laser light. Under visible light, the film becomes more and more transparent with the increasing light dose, and the total conversion of the photochromic moieties always occurs when an enough dose is delivered to the film. If we consider a direct laser writing machine, the beam shows an intensity profile moving over the sample at a specific velocity. Therefore, the transferred pattern depends on the writing parameters, namely the light intensity, the beam size, and the translation rate. The same photoconversion model used above was applied to the bleaching reaction, considering a Gaussian light beam profile moving at constant speed on the film surface. The results on sample C2 are reported in Fig. 4 and analogous conclusions have been obtained for sample C1.
Fig. 4. a) Transmittance map at 650 nm in a section perpendicular to the writing direction as function of the exposure time (gaussian profile, 650 nm, 0.66 mW, 7.5 μm beam diameter) for sample C2 at 1.1 mm/s writing speed; b) transmittance profile in a section perpendicular to the writing direction after the writing process; c) duty cycle of the transferred grating (DC, uncolored region/grating period) for a grating with 15 μm period as function of the scan rate.
Once fixed the beam size and the laser light intensity, the conversion profile depends on the translation rate: increasing the writing speed, the local dose provided to the film decreases and the conversion profile becomes narrower, until a non complete penetration inside the film occurs. Therefore, by acting on the scan rate, it is possible to tune in a large extent the feature size of the transferred pattern and, consequently, the duty cycle (DC) of the grating (the DC is calculated as the feature size at transmittance 0.5 over the grating period). This is an important conclusion, which allows for an easy control over the feature size using a constant laser beam power and size, and only changing the writing speed. The experimental evidence is reported in Fig. 5, where the optical microscope images of the grating patterns are shown for the sample C1 (scan rate: 0.7 mm/s) and C2 (scan rate: 1.1 mm/s). By fitting the intensity profile with sinusoidal functions, we extrapolated the duty cycles, resulting in a DC of 0.5 for the sample C1 and 0.35 for the sample C2, which were written at lower and higher speed, respectively. Results are in agreement with the simulations reported in Fig. 4(c).
Fig. 5. White light optical microscopy images of C1 (a) and C2 (b); corresponding intensity profiles as sum of the RGB values (c, d): measured (black) and fitted (red) lines.
The photochromic films and corresponding patterns have been also characterized by AFM in order to measure the surface roughness and exclude the presence of a surface modulation induced during the pattern writing. We found a roughness (as RMS value) of 63.8 nm for the C1 sample and 5.5 nm for the C2 sample and no periodic patterns related to the transferred grating. As a consequence, we can consider the thickness of the two films a constant value. The lack of thickness patterns seems to be in contrast with recent results reported in the literature [19] for a diarylethene-based polymer that shows a small thickness variation upon photoisomerization. However, this change was measured on very thin films of a polyester (a few tens of nm), which differ from the samples here studied.
3.2 Holographic measurements
The photochromic pattern obtained by converting the photochromic units from the colored to the uncolored form provides a pattern of transparency in the visible with high contrast close to the absorption peak of the colored form. Since the two forms of the photochromic molecule show also a different polarizability (so a different refractive index), a refractive index pattern is achieved, which directly turns into a pure phase pattern in the spectral region where both of the photochromic forms are transparent, hence in the NIR. To determine the refractive index profile in the patterned polyurethane films, digital holography microscopy performed in the NIR was used since the measured phase shift is proportional to the product d⋅Δn. Details on the set-up are reported in section 2.4.
Here, the aim of holography is to capture the complete wavefront scattered by the transferred pattern in the polyurethane films; i.e.:
( , )
( , ) ( , ) j x y
O x y = O x y eφ (2)
where |O| is the amplitude and φ the phase, x and y denote the Cartesian coordinates in the plane where the wavefield is recorded (CCD plane). The phase φ(x,y) incorporates information about both the refractive index distribution (n) and the thickness (d) of the photochromic film:
( )
2 ( , )x y π n x y, d φ λ = ⋅ (3)The holographic approach allows encoding the phase variation into an intensity fringe pattern generated and acquired with the setup sketched in Fig. 1. A numerical elaboration of the acquired interference pattern provides the retrieval of a discrete version of the complex optical wavefront generated by the transferred pattern. The phase of the retrieved wavefront, except for a constant, is related to thickness of the film and the refractive index distribution n(i,j) of the transferred pattern. Thus, digital holography gives the unique possibility to manage quantitatively the reconstructed phase information. Unlike the conventional phase contrast microscopy, it makes possible the estimation of both the shape and the value of the refractive index modulation, hence allowing to determine the refractive index difference between the colored and uncolored forms of the film.
In Fig. 6, the phase maps are reported for the two samples. The resulting line pattern immediately confirms the presence of a modulation of the refractive index. Moreover, the colorbar indicates the mapping of the quantitative phase distribution values into the grayscale map of each figure.
Fig. 6. Phase map for the C1 (a) and C2 (b) samples.
The noise in the phase-contrast maps is mainly due to both superficial and volumetric non-homogeneity of the photochromic films. Because of the high coherence of the laser source, these non-homogeneities act as scattering centers altering the retrieved phase-contrast map. In particular, the greater roughness of the C1 sample entails the greater noise of the Fig. 6(a) (of the order of ± 125mrad) compared to the Fig. 6(b) (of the order of ± 15mrad). From these images, the period and duty cycle of the pattern can be also evaluated, obtaing the values reported in Table 1. The results are in good agreement with both the simulations and the measurements carried out by white light optical microscopy.
Table 1. Period and duty cycle of the transferred pattern evaluated from the holographic analysis.
Sample C1 Sample C2 Period [μm] 14.5 ± 0.7 14.8 ± 0.4 Duty cycle 0.50 ± 0.01 0.38 ± 0.05
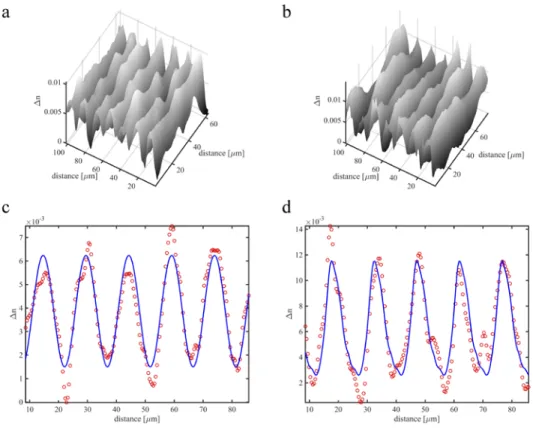
Knowing the real thickness from the spectral reflectance measurements and using Eq. (1), it is possible to evaluate the three-dimensional distribution of the refractive index modulation (Fig. 7).
Fig. 7. Refractive index modulation for C1 (a) and C2 (b) samples with the corresponding period and Δn. Profiles of the refractive index modulation (red circled line) with the corresponding fitting curve (blue solid lines) for C1 (c) and C2 (d) samples.
In particular, the maximum value of the refractive index modulation (Δn = nmax – nmin) is
about 0.004 for the C1 sample and 0.008 for the C2 sample. The latter value of Δn is double the former, in agreement with the double concentration of photochromic switching units in the C2 film. As the refractive index is proportional to the concentration of active units, this result gives a clear indication of the reliability of the method.
The bidimensional refractive index distributions are used to evaluate the change in shape of the periodic pattern with writing speed. In particular, in Fig. 7(c) and Fig. 7(d) two profiles relative to C1 and C2 samples are reported. The lower writing speed used to write the sample C1 provides a sinusoidal-like signal; in fact if this profile (circled line in Fig. 7(c)) is fit with a pure sinusoidal signal (solid line in Fig. 7(c)) a goodness-of-fit (R2) of about 0.9 is achieved. In order to achieve almost the same value of R2 for the C2 sample a fitting signal given by the sum of eight sine waves has to be used (solid line in Fig. 7(d)). In other word, the periodic pattern obtained with the higher writing speed can be represented as the sum of eight simple
sine waves. Thus, the higher writing speed induces a shape of the transferred pattern for the C2 sample that is more complex than a simple sine wave. In fact, for a high writing speed the transferred line is more spatially confined with respect to a low writing speed. For this reason, the duty-cycle of the transferred pattern is not 50%. The results in terms of Δn resemble the results we obtained monitoring the change in transparency, which is consistent with the fact that the refractive index is proportional to the conversion of the photochromic unit.
A further important advantage provided by the holographic imaging is the possibility to be performed in line during the pattern writing, since it works in the NIR, thus not affecting the conversion of the photochromic materials. In this way also the phase map will be readily available at the end of the writing procedure. Certainly, this represents a relevant tool for the design and production of devices such as waveguides with complex geometry.
4. Conclusions
An innovative approach to study and characterize microstructures written in high performance photochromic polyurethanes has been reported. In particular, digital holography in the NIR has been used to measure the refractive index modulation profile in a grating written by direct laser approach in the visible. Values of the order of 10−2 have been achieved in the high content photochromic films. The digital holography in the NIR can be also potentially used as in line method to characterize the phase patterns directly during the writing, providing at the end the full phase map.
At the same time, a kinetic model of the photochromic reaction has been used for the first time to model the dynamic writing process that occurs in the direct laser writing machine. We demonstrated how the size of the transferred feature can be tuned in a large extent with the scan rate, in other words with the writing speed. This is an interesting feature of the photochromic systems that makes simpler and more efficient the writing step. These theoretical conclusions were confirmed by performing experimental tests on polyurethane films with different photochromic content, where a grating pattern has been written changing the scan rate. Indeed, the grating duty cycle changed from 0.5 to 0.35 just by increasing the writing speed from 0.7 mm/s to 1.1 mm/s in accordance with the simulations.
Acknowledgments
This work was partly supported by the European Community (FP7) through the OPTICON project (Optical Infrared Co-ordination Network for astronomy) and by Italian Ministry of Education, University and Research (MIUR) through the PANDION project, in the framework of the National Operational Program – PON01_00375.