DOTTORATO DI RICERCA IN
Scienze della Terra
Ciclo XXVI
Settore Concorsuale di afferenza: 02/C1Settore Scientifico disciplinare: FIS/06
ORIGIN AND VARIABILITY OF PM
10AND ATMOSPHERIC
RADIOTRACERS AT THE WMO-GAW STATION OF MT. CIMONE
(1998-2011) AND IN THE CENTRAL PO VALLEY
Presentata da: Dott.ssa BRATTICH ERIKA
Coordinatore Dottorato Relatore
Prof. Vincenzo Picotti Prof.ssa Tositti Laura
Particulate matter is one of the main atmospheric pollutants, with a great chemical-environmental relevance. Aerosol deeply affects climate, local weather, visibility, human health, damages environment and cultural heritage. In the last two decades particulate matter has increasingly attracted the interest of the scientific community because, in spite of the ever improving efforts in the abatement technologies, its concentration is locally still very high often exceeding the thresholds. Despite many studies, the knowledge of sources, formation mechanisms and chemical characterization is still limited. Improving knowledge of the sources of particulate matter and of their apportionment is needed to handle and fulfill the legislation regarding this pollutant, to support further development of air policy as well as air pollution management.
Various instruments have been used to understand the sources of particulate matter and atmospheric radiotracers at the site of Mt. Cimone (44.18° N, 10.7° E, 2165 m asl), hosting a global WMO-GAW station. Thanks to its characteristics this location is suitable investigate the regional and long-range transport of polluted air masses on the background Southern-Europe free-troposphere.
In particular, PM10 data sampled at the station in the period 1998-2011 were analyzed in the
framework of the main meteorological and territorial features: the time series is characterized by a strong seasonal fluctuation with a winter minimum and a summer maximum, attributed to the seasonal fluctuation of the mixed layer height as well as to the intense vertical exchange occurring in the warm season at this latitude. A receptor model based on back trajectories was applied to study the source regions of particulate matter. Highest PM10 data at the site can be attributed to
three classes of events:
- Saharan dust transports from the northern African deserts;
- Uplift of polluted air masses from the Italian areas north of the Apennines range (i.e., Po Valley), especially during intrusion events from the boundary layer favoured by deep convection;
- Advection of PM10 enriched air masses from the European continent North and East of the
Italian peninsula.
Simultaneous measurements of atmospheric radionuclides 210Pb and 7Be acquired together with particulate mass load have also been analysed to acquire a better understanding of vertical and horizontal transports able to affect atmospheric composition. Due to their contrasting natural origin,
210
Pb and 7Be have often been used as a pair to investigate vertical transport and the scavenging of the aerosols. At Mt. Cimone 210Pb is characterized by a seasonal fluctuation similar to that of PM10,
radiotracers have been studied both analysing the long-term time series acquired at the measurement site as well as by means of a state-of-the-art global 3-D chemistry and transport model (GMI CTM): in particular, the use of the model enabled a better understanding of the transport and precipitation scavenging processes on the 210Pb and 7Be seasonalities at Mt. Cimone.
Advection patterns characterizing the circulation at the site have been identified by means of clusters of back-trajectories. The analysis revealed that the seasonality of transports is a relevant factor affecting atmospheric composition. In particular, one of the most interesting aspects of this study is the connection between Saharan Dust incursion events and increases not only in 210Pb (and PM10) but also
in 7Be, linked to two independent mechanisms occasionally acting together: the desert dust uplift and a strong downward movement from the upper troposphere. The analysis showed also that in general the cold period is mainly affected by long-range transports, while on the contrary short-range transports dominate the warm season. The relationship between NAO (North Atlantic Oscillation) and advection patterns has all-year-long important effects in terms of atmospheric composition at Mt. Cimone.
The study of source regions of the ratio 7Be/210Pb and of high potential vorticity values pointed out once more the usefulness of these tracers in the understanding of vertical transports. Locations highlighted by this kind of analysis are areas frequently affected by mechanisms promoting Stratosphere-to-Troposphere transport (areas interested by lee cyclogenesis, preferred regions for cyclone formation, and areas where the polar jet stream is generally stronger): North America, Northern Atlantic, the Arctic region and the Alps. Analysing the seasonal and trend components of the time series, it was highlighted that, even though some advection patterns and 210Pb and PM10 are
associated to a decreasing trend, the largest variability of the time series is in general associated with seasonal fluctuations and small time-scale changes.
Finally, the results of a source apportionment study of particulate matter carried on in a midsize town of the Po Valley (actually recognised as one of the most polluted European regions) are reported. Receptor models have identified six sources, interpreted as mineral dust, road dust, traffic, secondary aerosol, biomass burning and a pseudo-marine factor linked to the use of salt as de-icing agent on roads during winter. The source apportionment result was that on the average about 30% of PM10 is attributed to the coarse fraction, while the fine fraction contributes to about the 70%.
An approach exploiting different techniques, and in particular different kinds of (mostly, but not only receptor) models, successfully achieved a characterization of the processes/sources of particulate matter at the two sites, and of atmospheric radiotracers at the site of Mt. Cimone.
Il particolato atmosferico è uno degli inquinanti secondari di maggiore rilevanza chimico-ambientale. L’aerosol esercita importanti effetti sul clima, sul tempo atmosferico, sulla visibilità, sulla salute umana, danni all’ambiente ed ai beni culturali. Negli ultimi due decenni il particolato atmosferico ha attratto sempre più l’attenzione della comunità scientifica perché, nonostante le sempre migliori tecnologie di abbattimento, la sua concentrazione è ancora molto alta a livello locale, superando spesso i limiti legislativi. Nonostante il gran numero di studi, la conoscenza delle sorgenti, dei meccanismi di formazione e della caratterizzazione chimica del particolato sono ancora limitate. Una migliore conoscenza delle sorgenti di particolato e del loro apporzionamento sono necessarie anche a fini legislativi, a supporto di ulteriori sviluppi delle politiche in materia di qualità dell’aria e per il contenimento dell’inquinamento atmosferico.
Vari strumenti sono stati utilizzati volti alla comprensione delle sorgenti di particolato atmosferico e radiotraccianti al sito di Monte Cimone (44.18° N, 10.7° E, 2165 m asl), che ospita una stazione globale WMO-GAW e che, grazie alle sue caratteristiche, rappresenta un luogo utile all’investigazione del trasporto regionale ed a lungo raggio di masse d’aria inquinate al di sopra del fondo fornito dalla troposfera libera sud-europea.
In particolare, i dati di PM10 raccolti alla stazione nel periodo 1998-2011 sono stati analizzati nel
contesto delle principali caratteristiche meteorologiche e territoriali: la serie temporale mostra una forte fluttuazione stagionale con un minimo invernale ed un massimo estivo, attribuito alla fluttuazione stagionale dell’altezza dello strato di rimescolamento ed all’intenso scambio verticale che avviene nella bassa troposfera a questa latititudine. Un modello a recettore basato sull’utilizzo di back trajectories è stato utilizzato per studiare le regioni sorgente di particolato atmosferico. Gli aumenti di PM10 al sito di misura sono attribuibili a tre classi di eventi:
- Trasporti di sabbia sahariana dai deserti del Nord-Africa;
- Trasporto verso l’alto di masse d’aria inquinate dalle aree italiane a nord dell’arco appenninico (Pianura Padana), specie durante eventi di intrusione dal boundary layer favoriti dalla convezione spinta;
- Avvezione di masse d’aria arricchite dal continente europeo a Nord ed a Est della penisola italiana, inclusa l’area balcanica.
Sono state anche analizzate le misure simultanee di radionuclidi atmosferici 210Pb e 7Be raccolti assieme alla massa di materiale particolato per ottenere una migliore comprensione dei trasporti verticali ed orizzontali in grado di influire sulla composizione atmosferica. Infatti, grazie alla loro origine naturale contrapposta, la coppia 210Pb e 7Be è stata spesso usata per studiare il trasporto verticale e lo
la stagione fredda legato al trasporto Stratosfera-Troposfera ed uno nella stagione calda, principalmente associato alla subsidenza troposferica che bilancia l’ascesa di masse d’aria dalla bassa troposfera. Le variazioni stagionali dei radiotraccianti atmosferici sono state studiate sia tramite l’analisi della lunga serie temporale acquisita al sito di misura, sia tramite un modello globale 3-D di chimica e del trasporto (GMI CTM), che ha consentito in particolare una migliore comprensione dell’influenza dei processi di trasporto e dello scavenging della precipitazione sulle stagionalità di 210Pb e 7Be a Monte Cimone.
I patterns di avvezione che caratterizzano la circolazione al sito sono stati identificati per mezzo dell’analisi dei clusters di back trajectories. L’analisi ha rivelato che la stagionalità dei trasporti è un fattore rilevante per la sua influenza sulla composizione atmosferica. In particolare, uno degli aspetti più interessanti risultante da questo studio è la connessione degli eventi di trasporto di sabbia sahariana con aumenti non solo di 210Pb (e PM10) ma anche di 7Be, legata a due meccanismi indipendenti che agiscono
talvolta contemporaneamente: la salita di polvere desertica con un forte movimento verso il basso dall’alta troposfera. La ricerca ha mostrato anche che in generale il periodo freddo è interessato in prevalenza da trasporti a lungo raggio, mentre al contrario i trasporti a corto raggio dominano la stagione calda. La relazione tra la NAO (North Atlantic Oscillation) e patterns di avvezione ha importanti effetti in termini di composizione atmosferica a Monte Cimone, lungo tutto il corso dell’anno.
L’analisi delle regioni sorgente del rapporto 7
Be/210Pb e di valori elevati di vorticità potenziale ha messo ancora una volta in rilievo la loro utilità nella comprensione dei trasporti verticali. Le regioni evidenziate da questo tipo di analisi sono aree interessate frequentemente da meccanismi promotori del trasporto stratosfera-troposfera (regioni interessate da ciclogenesi di lee, regioni preferite per la formazione di cicloni, ed aree dove si localizza generalmente la corrente a getto polare): il Nord America, l’Atlantico settentrionale, la regione artica e le Alpi. Lo studio delle componenti stagionali e dei trends delle serie temporali hanno posto in evidenza come, sebbene per alcuni patterns di avvezione e per 210Pb e PM10 sia stato rivelato un trend in calo, la maggiore variabilità delle serie temporali è
associata alle fluttuazioni stagionali ed alle fluttuazioni a piccola scala temporale.
Da ultimo, vengono riportati i risultati di uno studio di source apportionment di particolato atmosferico condotto in una città di medie dimensioni della Pianura Padana, attualmente riconosciuta come una delle regioni più inquinate dell’intera Europe. I modelli a recettore hanno individuato sei sorgenti, interpretate come polvere minerale, polvere stradale, traffico, aerosol secondario, combustione di biomassa ed un fattore pseudo-marino legato all’utilizzo di sale come agente anti-gelo sulle strade durante l’inverno. Il risultato del source apportionment è stato che in
L’utilizzo di un approccio che ha sfruttato diverse tecniche, ed in particolare diversi modelli (principalmente, ma non solo, a recettore), ha consentito di caratterizzare completamente sorgenti/processi di particolato ai due siti, e quelle dei radiotraccianti atmosferici al sito di Monte Cimone.
INDEX
ABSTRACT RIASSUNTO
CHAPTER 1 – General Introduction
Premise ... 1
1.1 Atmospheric particulate matter ... 4
1.1.1 Physical characteristics ... 4
1.1.2 Sources of atmospheric aerosol ... 9
1.1.3 Effects of aerosol ... 14
1.1.4 Chemical composition ... 20
1.2 Environmental radiotracers ... 24
1.3 Receptor modelling ... 33
1.3.1 Back trajectories ... 34
1.3.2 Source-receptor models incorporating back trajectories ... 35
1.3.3 Source apportionment ... 38
References ... 45
CHAPTER 2 – Short-Term Climatology of PM10 at Mt. Cimone 2.1 Introduction ... 61
2.1.1 Site description ... 63
2.2 Experimental ... 64
2.2.1 Trajectory model description and source apportionment technique ... 66
2.3 Results and discussion ... 68
2.3.1 PM10 trend ... 68
2.3.2 The regional framework ... 71
2.3.5 The dust episode on 12-15 March 2004 ... 81
2.4 Conclusions ... 86
Acknowledgements ... 86
References ... 87
CHAPTER 3 – Temporal Changes of 7Be and 210Pb Activity Concentrations at Mt. Cimone 3.1 Introduction ... 95
3.2 Material and methods ... 98
3.2.1 Measurement site ... 98
3.2.2 Experimental ... 99
3.3 Results and discussion ... 100
3.3.1 Seasonality and interannual variability ... 100
3.3.2 Basic statistics ... 108
3.3.3 Correlations with other atmospheric species ... 115
3.4 Summary and conclusions ... 121
Acknowledgements ... 122
References ... 123
CHAPTER 4 – Processes Controlling the Seasonal Variations of 210Pb and 7Be at Mt. Cimone: A Model Analysis 4.1 Introduction ... 135
4.2 Data and methods ... 140
4.2.1 Radionuclide measurements at Mt. Cimone ... 140
4.2.2 GMI model ... 141
4.3 Seasonal variations of transport and precipitation at Mt. Cimone: observations vs. model simulations ... 143
4.5 Sources and seasonality of 210Pb and 7Be at Mt. Cimone: a model analysis ... 154
4.6 Summary and conclusions ... 160
Acknowledgements ... 161
References ... 162
CHAPTER 5 – Advection Patterns at the WMO-GAW station of Mt. Cimone: Seasonality, Trends and Influence on Atmospheric Composition 5.1 Introduction ... 171
5.2 Material and methods ... 175
5.3 Results and discussion ... 178
5.3.1 Characteristics of the main advection patterns ... 178
5.3.2 Atmospheric and meteorological parameters by advection patterns ... 183
5.3.3 Temporal analysis of transport patterns and atmospheric composition ... 201
5.3.4 Association of air flow types and meteorological/atmospheric parameters with NAO .... 208
5.4 Summary and conclusions ... 215
Acknowledgements ... 217
References ... 218
CHAPTER 6 – Influence of Stratospheric Air Masses on Radiotracers and Ozone at Mt. Cimone 6.1 Introduction ... 231
6.2 Material and methods ... 234
6.3 Results and discussion ... 237
6.3.1 Source areas of atmospheric radiotracers and ozone ... 237
6.3.2 Analysis of potential vorticity values ... 243
6.4 Summary and conclusions ... 247
Acknowledgements ... 249
Southeastern Po Valley (Bologna, Italy)
7.1 Introduction ... 261
7.2 Material and methods ... 264
7.3 Results and discussion ... 266
7.3.1 PM levels ... 266
7.3.2 Chemical characterization and seasonal patterns ... 268
7.3.3 Enrichment factors ... 272
7.3.4 PCA/MLRA ... 273
7.3.5 PMF ... 280
7.3.6 Analysis of a case study occurred during the sampling campaigns ... 285
7.4 Conclusions ... 289
Acknowledgements ... 290
References ... 290
General Conclusions ... 301
Acknowledgements/Ringraziamenti ... APPENDIX I – Aerosol Characterization at the WMO-GAW Station of Mt. Cimone (2165 m asl) by 7Be, 210Pb and PM10 1. Introduction ... 311
2. Material and methods ... 312
2.1 Experimental ... 312
2.2 Measurement site ... 312
3. Results ... 312
APPENDIX II – Comparison of Radioactivity Data Measured in PM10 Aerosol Samples at
two Elevated Stations in Northern Italy during the Fukushima Event
1. Introduction ... 315
1.1 Measurement sites ... 316
1.1.1 Montecuccolino ... 316
1.1.2 Mt. Cimone ... 317
2. Material and methods ... 317
2.1 Experimental activity ... 317
2.2 Dose estimation ... 320
3. Results and discussion ... 320
4. Conclusions ... 325
Acknowledgements ... 326
Premise
Particle pollution (also called particulate matter or PM) is the term indicating a mixture of solid particles and liquid droplets found in the air. Some particles, such as dust, dirt, soot, or smoke, are large or dark enough to be seen with the naked eye. Others are so small that they can only be detected using an electron microscope. These particles come in many sizes and shapes and can be made up of hundreds of different chemicals. Particle pollution includes “inhalable coarse particles”, with diameters larger than 2.5 micrometres and smaller than 10 micrometres and “fine particles” with diameters that are 2.5 micrometres and smaller. Particle pollution contains solid or liquid droplets that are so small that they can get deep into the lungs and cause serious health problems (Davidson et al., 2005; Pope and Dockery, 2006; Pope et al., 2009). Particles have also deep effects on climate, cloud formation, and visibility reduction (Finlayson-Pitts and Pitts, 1999; Usher et al., 2003; Seinfeld and Pandis, 2006; Forster et al., 2007; Myhre et al., 2013), and can damage the environment and cultural heritage (Camuffo et al., 2001; Godoi et al., 2006; Nava et al., 2010). At present, fine and coarse particles are regulated in the USA and in Europe. At European level, Directive 2008/50/EC on ambient air quality and cleaner air for Europe requires Member States to limit the exposure of citizens to the airborne particles and sets limit values for PM10 and PM2.5. Improving knowledge of the
sources and apportionment of these sources of airborne particulate matter is useful to handle and fulfil the legislation regarding this pollutant, to support further development of air policy as well as air pollution management.
The main objective of this work is to understand the sources of particulate matter and atmospheric radiotracers 7Be and 210Pb at the global WMO-GAW station of Mt. Cimone (44.18°N, 10.7°E, 2165 m asl, Italy) and in the Po Valley, recognised as one of the most polluted regions in Europe. Aside from being the most elevated peak of the Northern Apennines, lying above the planetary boundary layer during most of the year, Mt. Cimone is also fairly off cities and industrialized areas and has a 360° free horizon. Owing to these characteristics, it represents a suitable location to investigate the regional and long-range transport of polluted air masses on the background Southern Europe-Mediterranean free troposphere (Fischer et al., 2003; Marinoni et al., 2008). It is to note in this framework that Southern Europe and the Mediterranean basin are considered as a hot-spot region both in terms of climate change (e.g., Forster et al., 2007; Hesselbjerg et al., 2013) and air quality (Monks et al., 2009), also representing a major crossroad of different air mass transport processes (Lelieveld et al., 2002; Millàn et al., 2006; Duncan et al., 2008; Tositti et al., 2013). Various approaches are used in this work for the purpose of studying the
sources of particulate matter and atmospheric radiotracers at the site of Mt. Cimone, both in terms of physical processes as well as of long-range and regional transport: the main tool which will be applied in the present work is receptor modelling, especially incorporating the use of back trajectories, but other analyses have been carried out and will be thoroughly described to gain better insights into the processes responsible of PM10 and atmospheric radiotracers variabilities.
Because of their contrasting natural origin, atmospheric radiotracers 7Be and 210Pb can be used to understand the atmospheric composition and its variations, and the vertical motions in the atmosphere. In particular, this pair has been often used in the study of Stratosphere-to-Troposphere Exchange (STE) and to determine the contribution of Stratosphere-to-Troposphere Transport (STT) to tropospheric ozone (O3). As a matter of facts, while 7Be, being a cosmogenic radionuclide mostly
produced in the stratosphere and upper troposphere, is considered a tracer of stratospheric influence,
210
Pb is considered a tracer of air masses with continental origin, as it is the decay daughter of 222Rn emitted from soils. O3 is a greenhouse gas and one of the most important gases involved in
photochemical reactions (Crutzen et al., 1999; Volz-Thomas et al., 2002), one of the key agents determining the oxidation capacity of the troposphere (Gauss et al., 2003), but most of all is a secondary pollutant in the lower troposphere dangerous to human health (Hoek et al., 1993; Kinney, 1993), ecosystems (Scebba et al., 2006), and agricultural yields (Fuhrer and Booker, 2003), playing also a central role in the radiative budget of the atmosphere (Ramaswamy et al., 2011). Due to anthropogenic emissions, tropospheric O3 concentrations have increased significantly since
pre-industrial ages (Staehelin et al., 1994), leading to an equivalent radiative forcing of about 19% of that from carbon dioxide as from the last IPCC (Intergovernmental Panel on Climate Change) assessment (Myhre et al., 2013). In fact, there are two sources of O3 in the troposphere:
photochemical production from oxidation of carbon monoxide and hydrocarbons in the presence of nitrogen oxides, and transport from the stratosphere (Crutzen, 1973; Jacobson, 2002), often in connection with tropopause folding events (e.g., Holton et al., 1995 and references therein). While the former process is directly affected by anthropogenic emissions of O3 precursors, the downward
branch of the Brewer-Dobson circulation in middle and high latitudes (Haynes et al., 1991) is the process controlling the total amount of O3 that is exchanged from the stratosphere to the
troposphere. It is to note here that besides being very suitable to study tropospheric background conditions (Wotawa et al., 2000; Stohl et al., 2000; Cuevas et al., 2013), mountain peak stations are also appropriate locations to investigate specific aspects of STT (Cristofanelli et al., 2006). Data acquired so far at the station constitute a time series long enough to provide a sort of short-term climatology of the site. Moreover, the data time extension is so long that the application of receptor modeling in order to identify the sources of atmospheric particulate matter is possible. In fact,
receptor modeling tools typically use complex chemical composition dataset to characterize and estimate the contribution of each source type to the observed concentration, but can also be based on the identification of the locations of the sources through the use of ensembles of air parcel back trajectories. Both the methods are used in the present work. In particular, statistical techniques based on a long term series of back trajectories calculated at the Mt. Cimone site is aimed at a thoroughly elucidation of the role of atmospheric transports (most of all, but not only, vertical) affecting variations in atmospheric composition. The use of receptor modeling tools based on complex chemical composition dataset to characterize and estimate the contribution of each source type to the observed concentration was instead applied to gain insights into the sources of particulate matter in Bologna, a mid-size town located in the central Po Valley, and in quantifying their contribution.
This work consists of 8 chapters and is organized as follows. The remainder of Chapter 1 is used to pose the scientific basis for the understanding of the thesis work: a general introduction to particulate matter, atmospheric radiotracers and receptor modelling tools is given in the following sections of this chapter. Chapter 2 describes the average behaviour of PM10 at the Mt. Cimone site and investigates its
variations both in relation to data acquired at the station and on the regional scale as well as with receptor modelling involving back trajectories techniques. A source receptor modelling based on the application of back trajectories is specifically applied to investigate the source regions associated to events of elevated PM10 measured at Mt. Cimone. Chapter 3 presents a basic overview of the 7Be and 210
Pb time series collected at the site and discusses the data in terms of seasonal and interannual variations with the purpose of gaining better insights into physical mechanisms responsible of their variabilities. To the same aim in Chapter 4 simulations of 7Be and 210Pb at Mt. Cimone are conducted with a state of the art global 3-D chemistry and transport model: the use of the model enables to examine how transport and precipitation scavenging affect their concentrations. In Chapter 5 the main advection patterns at Mt. Cimone are examined by means of back trajectories clustering analysis. The temporal series of air masses back trajectories and of the data acquired at the station are analysed in terms of seasonal fluctuations, trends and association to NAO (north Atlantic Oscillation). The roles of atmospheric transport and NAO in the observed variations of atmospheric composition are also studied. Chapter 6 uses a different statistical trajectory analysis to investigate the influence of stratospheric air masses on radiotracers and ozone. In particular, the geographical areas associated to events of high 7Be,
210
Pb and ozone are identified, and the major mechanisms promoting stratosphere-to-troposphere exchange events are investigated. In Chapter 7 a more classical source apportionment study applied on a chemical composition dataset is carried on. The study evaluates the source contributions in a midsize town located at the centre of the Po Valley by means of multivariate statistical techniques and receptor
modelling. The impact of a long range transport event due to Saharan Dust outbreaks is also evaluated. Finally, conclusions coming from all of these works are drawn.
During the first year of my PhD, a relevant event occurred on March 11th, 2011: the accident in the Fukushima Dai-ichi nuclear power plant after the devastating tsunami in Japan. This event has been the occasion for me to deal not only with natural but also with artificial radioactivity released in the atmosphere during the nuclear accident. The analysis of radioactivity also served to me as a tool to test atmospheric transport models capabilities in representing this (very) long-range transport event. The work carried on during this event is presented in Appendix II, while Appendix I describes my first studies of natural radiotracers with more rudimental tools, also conducted during the first year of my PhD in occasion of a IAEA (International Atomic Energy Agency) conference held in Monaco.
1.1 Atmospheric particulate matter 1.1.1 Physical characteristics
Atmospheric particulate matter is generally defined as a complex and dynamic mixture of solid and/or liquid particles present in suspension in a gas (air) having organic and inorganic components (vanLoon et al., 2000). Particulate matter has extremely variable dimensions, origin and chemical composition and for this reason forms a complex and heterogeneous mixture. Atmospheric PM has a profound effect on our lives, as it affects global climate, local weather, visibility, personal health and conservation of built heritage. Nevertheless, the knowledge of sources, formation mechanisms, fate and properties of PM is still limited, most of all regarding some constituent compounds and some aspects related to formation processes.
Atmospheric PM can be emitted by a wide variety of sources that influence its physical properties (size, surface area, density), chemical composition and size distribution. Particulate matter is produced by lots of sources and processes, both of natural and anthropogenic origin, from crumbling of material by abrasion/erosion to complex photochemical mechanisms in troposphere (Manahan, 2000). In particular, PM may be classified as primary or secondary in accordance with its formation mechanism: primary particles are directly emitted into the atmosphere (dust, pollen, smoke) while secondary particles are formed after chemical transformation of their gaseous precursors and lead to production in condensed phase. In this case both organic and inorganic particles are involved in oxidative reactions (vanLoon et al., 2000).
Bio-geo-chemical cycle of atmospheric aerosol may be outlined as in Figure 1.1:
1 primary particles and precursor gases of secondary aerosol are emitted by natural and anthropogenic sources;
2 particles may undergo further modifications after chemical-physical processes of different nature; 3 particles may be removed from the atmosphere by either wet (meteorology) or dry deposition; 4 removed particles may rearrange their chemical content to the deposition environment
(hydrosphere and pedosphere), interacting with the biosphere in direct or indirect way (Pöschl, 2005).
Figure 1.1 Natural cycle of atmospheric aerosol (Image downloaded from Pacific Northwest National
Laboratory, http://www.pnnl.gov/atmospheric/research/aci/aci_aerosol_indeffects.stm).
Atmospheric particles are mainly characterized by their size. It is mainly expressed in terms of equivalent (or effective) radius or diameter, assuming that particles have spherical shape. In reality, atmospheric particles are characterized by various shapes: from the rough edge-shape of a crustal particle, to the long branched chains of small nanoparticles characterizing diesel exhausts emission, to the flat appearance of a skin fragment, to the cubic shape of a sodium chloride crystal. For this reason, the concepts of radius or diameter have a relative value and the concept of equivalent diameter, depending from physical rather than geometric characteristics, is introduced to assign a diameter to any (even irregular) particle. The equivalent diameter is generally defined as the diameter of a sphere or circle having some specific property or behaviour as the particle under consideration. The most used is the aerodynamic diameter Da, that is the diameter of a sphere of
unity density (1 kg m-3) with the same settling (sedimentation) velocity as the particle in question (Heyder et al., 1974). The mathematical law that describes Da is:
√ ⁄ (1.1)
where Dg is geometrical diameter, p the particle density, 0 the density of the reference spherical
PM2.5 are related to this definition, and define suspended masses of particulate formed by particles
less than 10 and 2.5 m, respectively. In both cases the choice of these upper limits refers to the ability to penetrate into the respiratory system depending on their size (PM10 can be inhaled and
accumulate in the respiratory system, while PM2.5 can lodge deeply into the lungs, and PM1 can
reach alveolar area thereby depositing deep inside respiratory tract).
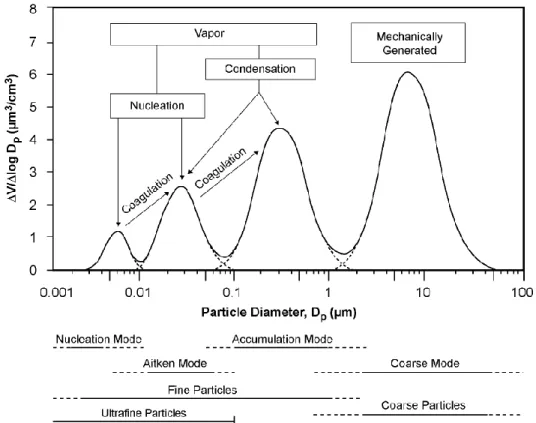
PM may vary in size from a few nanometres to several tenths of micrometres. Its typical size distribution, shown in Figure 1.2, includes four different modes, differing also in terms of generation processes (John, 2001). Moreover, size controls and determines also environmental fate of the particle. Basically, the number of particles decreases increasing the size of particles. The four modes in the distribution are interpreted as follows:
the coarse mode (over 1 or 2.5 m, depending on the adopted convention). Generally this mode has the highest volume (or mass) concentration. Particles in this mode are mainly formed by natural mechanical processes, such as erosion of the earth surface (mineral dust) and of other materials, including the ocean surface (sea spray), but also processes of anthropogenic origin such as the abrasion on tyres and on brakes of motor vehicles. The chemical composition reflects that of the source originating the particles: if aerosol has a coastal or marine origin, it is mainly constituted by minerals and NaCl (Hueglin et al., 2005); a component having organic origin is also present (e.g., Cass et al., 1982), and most of the components having biological origin, such as pollen and spores, is in this interval. Although coarse mode is dominated by primary particles, also secondary particles formed by the chemical interaction of gases with primary particles of crustal and marine origin can be found in this mode;
the accumulation mode generally has the highest number concentration and includes particles in the range between 0.08 and 1-2 m; these particles are formed by coagulation of small size particles and by condensation of gaseous species on the surface of pre-existing particles. Their chemical composition comprehends lots of organic substances and insoluble inorganic salts such as NH4+, NO3- and SO42-;
Aitken nuclei mode includes particles having diameter between 0.07 and 0.08 m, originated by heterogeneous reactions of gas-particle conversion (condensation) and in the combustion processes at high temperatures. They act as condensation nuclei for water vapour and for gaseous species with low vapour pressure;
the nucleation mode includes particles having equivalent diameter below 0.01 m, which are formed by the homogeneous nucleation of precursor gases and from combustion processes. The size limit that allows distinguishing these particles from big sizes molecules is in reality not certain (US EPA, 2004).
Figure 1.2 Typical size distribution of atmospheric aerosol and origin of particulate matter (US EPA, 2004).
Other classifications often employed distinguish among (Oberdörster, 2000):
coarse particles, diameter larger than 2.5 or 1 m;
fine particles, diameter between 0.1 and 1 m;
ultrafine particles or nano-aerosol, diameter shorter than 0.1 m (that can be further divided into ultrafine particles, with at least one of the three dimensions shorter than 100 nm, and nanoparticles, with all the three dimensions shorter than 100 nm).
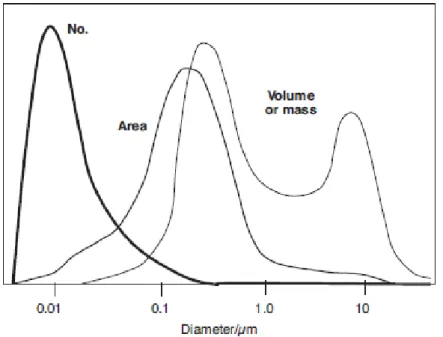
Ultrafine particles (UFP) comprehend particles of nucleation mode and most of Aitken nuclei. Although they are so small that do not contribute in a significant way to the total mass, they make up more than 80% of the atmospheric aerosol, as can be seen in Figure 1.3. UFP are also very important from the sanitary point of view, both because of reduced dimensions and of their concentration.
Figure 1.3 Simplified comparison among number, area and volume of particles as a function of the
logarithm of the particles diameter (Tiwary and Colls, 2002).
The residence time of particles in the atmosphere depends also on their size. After the production/emission, particles undergo redistribution and transport processes through the atmosphere, and are finally removed by wet and dry deposition. The most efficient removal mechanism of PM is wet scavenging, which corresponds to 80% of the total removal processes and is formed by transport processes to the ground through precipitations (rain, snow, hail, but also “hidden” precipitations such as fog, frost and dew). The main mechanisms of wet deposition are:
rainout, that is removal in between the cloud (also called in-cloud processes);
washout or below-cloud processes, in which a particle is absorbed in a pre-existing falling droplet. This process is less efficient than rainout as there is a limited probability of collision between the droplet and the particle during the fall of the droplet.
There are three main mechanisms of dry deposition: gravitational settling, diffusive deposition and contact with surfaces. Owing to the effect of gravity, coarse particles are rapidly removed from the air by sedimentation (residence time between some minutes and some hours). Particles in the nucleation mode are rapidly transformed into coarser particles by coagulation processes and then are also removed by sedimentation. The highest residence time in the atmosphere (up to some weeks) is shown by particles in the accumulation mode, which are too large to have sufficient Brownian diffusivity and too light to be removed by gravitational settling; these particles can be easily transported by the wind up to thousands of kilometres far from the area where they are formed. Usually aerosol particles in accumulation size mode are less effectively washed out and prone to remain distributed in the atmosphere even after a spell of heavy rainfall (Chate, 2005). Dry deposition
of particles in the accumulation mode is due to collision with surfaces, even if wet deposition is the most efficient removal mechanism. The residence time of particles in the accumulation mode varies from some days to some weeks depending on climatic conditions and altitude. The term “accumulation interval” is due to the long life-time with respect to other classes of particles and to the dependence of the removal by meteorological phenomena (Baird and Cann, 2008). The residence time of Aitken nuclei is short, due to the rapid coagulation. The residence time is also a function of the injection height: with increasing injection height, the residence time increases. Aerosols from volcano eruptions which reached stratosphere may stay there for about one year.
Figure 1.4 Residence time of particles as a function of their dimensions (Prospero et al, 1983; Jaenicke, 1980).
1.1.2 Sources of atmospheric aerosol
Sources of particulate matter can be natural or anthropogenic. Naturally occurring particles are produced by volcanoes, sea spray, grassland fires, desert dust and by a variety of biological sources (pollen, bacteria, fungal spores, fragments of vegetable organisms and animals). Anthropogenic particles derive from human activities, such as the burning of fossil fuels in vehicles, domestic heating, power plants and industrial processes. The composition of PM reflects that of the source from which it is originated.
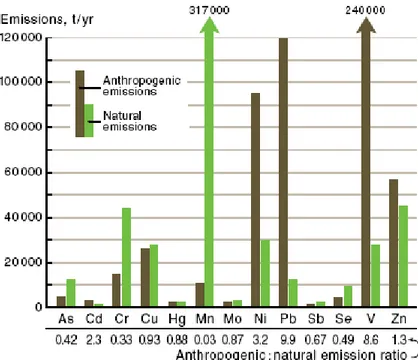
Table 1.1 summarizes natural and anthropogenic sources for the main constituents of primary and secondary aerosol for fine and coarse particles. It also highlights that, on a global scale, estimated fluxes of anthropogenic origin are overall equivalent to those of natural origin.
Table 1.1 Estimate of fluxes (Tg*yr-1) of particulate matter as a function of the source, natural and anthropogenic (Seinfeld and Pandis, 2006).
One of the main sources of natural primary particles is the formation and resuspension of dusts from soil and rocks erosion operated by winds and other atmospheric agents (physical and chemical weathering). It depends from wind and atmospheric agents, but also from the structure and chemical composition in the location, variable depending on climate, geology, geography and topography (sea, mountain, desert …). Generally particles originated by these processes are coarse-sized and constituted by silicates such as quartz, clays (most of all kaolinite, illite, feldspars, carbonates and dolomite) and to a less extent calcium sulphates (gypsum) and iron oxides. The most common chemical elements (both in soil and in rocks) are Si, Al, Fe and soluble elements such as Ca2+, Mg2+, Na+ and K+, in form of minerals. Organic material is also present in soils, in different percentages depending on environmental conditions in the area.
Another important natural source of aerosol is represented by seas and oceans (sea-spray). Sea-spray is considered the second largest contributor in the global aerosol budget and reflects the composition of seawater, consisting mainly of sodium chloride (NaCl) and sulphates (Na2SO4,
MgSO4, K2SO4). This kind of aerosol is mainly originated by sea foam produced by wind, that
generates lots of sea droplets that are suspended in the atmosphere and there remain as solid particles after evaporation processes. These particles are both coarse and fine-sized. Sea-spray can have a deep influence on the composition of PM in coastal areas and on islands.
Volcanic emissions are another natural source of primary mineral particles but also gases (most of all sulphur dioxide, carbon dioxide and water vapour). The contribution of volcanic emissions is generally localized and variable in time.
Natural PM comprehends also a biogenic fraction, generally made up by vegetal debris, pollen, spores and microorganisms (e.g., bacteria, viruses, fungi and seaweeds). While viruses and bacteria have dimensions less than 2 m, vegetal debris, pollen and spores are generally in the coarse size (Pòsfai and Molnàr, 2000).
Natural sources do not originate only primary aerosol, but also gaseous precursors of secondary aerosol; for instance SO2 emitted by volcanoes, but most of all dimethyl sulphide [(CH3)2S] of
biogenic marine (and biomass) origin, that once diffused from the marine surface to the atmosphere, is oxidised to SO2. SO2 is further oxidized by OH radical, forming H2SO4 (sulphuric acid). This
acid component is neutralized by gaseous ammonia emitted by natural cycle of nitrogen. The acid-base reaction forms (NH4)2SO4, a salt that represents one of the most abundant components of
secondary aerosol (Finlayson-Pitts and Pitts, 1999).
Also a small part of nitrates coming from NOx in the nitrogen cycle (Roelle et al., 2001) and from
lightning (Price et al., 1997a, b) are part of natural aerosol. Their presence is as important as that of NaCl, since water vapour can condensate (formation of clouds and precipitation) only owing to their hygroscopicity and to their ability of absorption/adsorption1 in the form of ultrafine crystals. In fact it is well known that, because of low pressure and rarefaction of gases with height in the atmosphere, it would be extremely hard for water vapour to meet the necessary thermodynamic conditions to homogenous condensation, despite low temperatures.
A carbonaceous fraction is also part of secondary natural PM, constituted by both elemental carbon produced by natural combustion of forests and by organic substances emitted by vegetation (Harrison
1
Absorption is the process by which one substance melts in the mass of a particle, whereas adsorption is the process by which molecules of a substance, such as a gas or a liquid, collect on the surface of another substance. In the case of adsorption, the molecules are attracted to the surface but do not enter the solid’s minute spaces as in absorption; an important example is adsorption of big organic molecules on carbon molecules (soot).
et al., 2001). Vegetal biosphere releases in the atmosphere many organic unsaturated molecules such as isoprene and terpenes (generally called bio-VOC’s) whose oxidation originates more polar organic compounds, characterized by a reduced vapour pressure and by a higher probability to undergo nucleation processes that form secondary aerosol (Christoffersen et al., 1998; Koch et al., 2000).
The main anthropogenic sources are mostly localized in urban and industrial areas. Generally, anthropogenic sources contribute mostly to the secondary fraction, associated to the huge quantities of gaseous precursors emitted by combustion processes both from stationary (electric energy production, industries, incinerators, heating) and mobile sources (light and heavy duty, off-road, air and ship traffic). Also catalytic converters installed inside internal combustion engines with the aim at cutting down harmful emissions of exhausts, promoting (through catalysts) their complete oxidation and in particular converting unburned hydrocarbons, nitrogen oxides NOx, carbon
monoxide CO to CO2, H2O and N2, emit platinum-palladium in the form of PM. Moreover, the
excess of operation of catalytic converters caused increased emissions of ammonia in PM.
In urban environment primary PM is generated by erosion processes of roads operated by traffic and by wear of motor vehicles’ mechanical components (engine, brakes, tyres). Moreover in exhaust carbonaceous particles are also present (most of all elemental carbon, EC), of primary origin and typically submicron-sized.
Also industrial activities, such as concrete production, mineral industries, ceramic and building materials manufacture, are typically sources of coarse particles, but associated with emissions of gaseous precursor which can generate secondary aerosol.
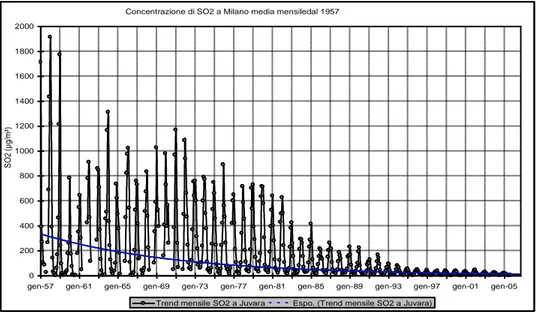
Secondary anthropogenic PM is mainly formed by sulphates, ammonium nitrates and organic carbon. Sulphur dioxide is emitted by coal and diesel oil combustion, fuels by which sulphur impurities are only partially removed before sale and use. In the past the extensive use of coal as fuel caused serious episodes of atmospheric pollution, in particular linked to acid rains. In fact coal is a fuel containing elevated amounts of sulphur; the concentration of sulphur dioxide in the atmosphere was so elevated that ammonia was no more able to neutralize sulphuric acid, very hygroscopic. Wet deposition produced precipitations with very acid pH (with values up to 3-4 units), and consequent serious damages to entire ecosystems. Nowadays SO2 levels are strongly
reduced thanks to the use of fuels containing reduced concentrations of sulphur, such as diesel and fuel oil, and to the phase out of coal’s production. In Figure 1.5 the historic series of SO2
concentrations in Milan is reported: a notable decrease of this gas since the end of ‘50s due to the decrease of the coal’s use is observed (Cazzuli et al., 2005). A similar decrease was observed in all developed countries. Anyway, in many areas, most of all in developing countries such as China and India, acid rains still occur due to high local industrialization (Wenche et al., 2006; Larssen et al.,
2006; Muthukumara et al., 2012). Driven by the rapid economic development, SO2 emissions from
India and China have been continuously increasing over the past two decades (Garg et al., 2006; Lu et al., 2011; JRC/PBL, 2013; Kurokawa et al., 2013). According to a new analysis of data from NASA’s Aura satellite (Lu et al., 2013), emissions of sulphur dioxide from power plants in India increased by more than 60% between 2005 and 2012, due to the rapid growth of electricity demand and the absence of regulations.
Figure 1.5 Historic series of SO2 concentrations in Milan since 1957 until 2005 (Cazzuli et al., 2005).
Nitrogen oxides are among other gaseous precursors formed during combustion processes. An elevated temperature is needed to combine atmospheric nitrogen and oxygen (Finlayson-Pitts and Pitts, 1999), and therefore nitrogen oxides are mostly emitted by urban traffic and industrial processes at high temperatures. NOx are oxidized in the atmosphere by OH to HNO3 and, similarly
to H2SO4, after the neutralization with NH3 form condensed vapour droplets and/or crystal salts
(condensation nuclei).
Even in the case of anthropogenic sources precursors of secondary PM exist. These are mainly fugitive emissions, which are the fractions of volatile hydrocarbons emitted by vehicles because of evaporation, and organic solvents widely used both in industry as well as in daily life. VOCs (Volatile Organic Compounds) are compounds with high vapour pressure and low solubility in water. They include a great variety of chemical substances, some of which can have adverse effects on health. Many VOCs are produced and used in the production of paints, pharmaceutical and cooling substances. Typically VOCs are industrial solvents such as trichlorethylene, fuel additives such as MTBE or by-products generated by chlorine addition to water such as chloroform.
Concentrazione di SO2 a Milano media mensiledal 1957
0 200 400 600 800 1000 1200 1400 1600 1800 2000
gen-57 gen-61 gen-65 gen-69 gen-73 gen-77 gen-81 gen-85 gen-89 gen-93 gen-97 gen-01 gen-05
S O2 ( µ g /m³ )
On a global scale, the most important anthropogenic sources of VOCs are associated to extended cultivated areas and to forests combustion, an activity linked to large scale variations of land use in behalf of farm areas (Odum et al., 1996; 1997a, b). Same as bio-VOCs, even these substances can be oxidized in the atmosphere and transformed in more polar and condensable species.
While 80-90% of PM emitted by combustion is less than 1 m diameter, less than 10% of the mass of dust from geologic material is PM2.5.
1.1.3 Effects of aerosols
It is widely recognized that atmospheric PM influence climate through at least two main pathways: its effect on both the absorption and scattering of solar radiation (direct effect) and its role in cloud formation processes (indirect effect). In fact, as an indirect effect, aerosols in the lower atmosphere can modify the size of cloud particles, changing how the clouds reflect and absorb sunlight, thereby affecting the Earth’s energy budget.
In the atmosphere, when particles are sufficiently large, we notice their presence as they scatter and absorb sunlight. Their scattering of sunlight can reduce visibility and redden sunrises and sunsets.
Figure 1.6 Reduction of visibility by aerosols. The visibility of an object is determined by its contrast with
the background (2 vs. 3). This contrast is reduced by aerosol scattering of solar radiation into the line of sight (1) and by scattering of solar radiation from the object out of the line of sight (4) (http://acmg.seas.harvard.edu/people/faculty/djj/book/bookchap8.html#20531).
Earth’s climate is influenced not only by greenhouse gases which heat up the planet absorbing the infrared component of the Earth’s radiation and re-emitting it towards the Earth’s surface. The action of aerosols on climate is more complex: they can behave such as greenhouse gases and produce a heating effect or act as cooling, depending on their chemical-physical characteristics (D’Alessio et al., 2005; Mitra et al., 2002).
The interaction of aerosol particles with the solar radiation depends on their chemical composition. Some components of the aerosol can scatter incoming solar radiation reducing its flux to the Earth’s surface, and are thus capable of reducing the heating due to greenhouse gases (for example, sulphate). Other components, such as elemental carbon, have a continuous absorbing
spectrum that extends to IR, and can contribute to the heating effect. The ability of the atmospheric aerosol to influence the way solar radiation is transmitted through the atmosphere has relevant consequences in terms of radiation budget and thus in terms of climate change.
Figure 1.7 represents mean global radiative forcing for year 2011 starting from a pre-industrial situation of 1750 (IPCC, 2013) and aggregated uncertainties for the main drivers of climate change. Values are global average radiative forcing (RF) partitioned according to the emitted compounds or processes that result in a combination of drivers. The best estimates of the net radiative forcing are shown as black diamonds with corresponding uncertainty intervals; the numerical values are provided on the right of the figure, together with the confidence level in the net forcing (VH-very high, H-high, L-low, VL-very low). Aerosols result to have a “cooling” effect on climate, by scattering sunlight and by leading to smaller but more numerous cloud droplets, which makes clouds brighter and extends their lifetimes (IPCC, 2007; IPCC, 2013). However, the net effect of all contributes on climate is positive in agreement with the trend of atmospheric temperature observed in the troposphere. The net effect of aerosol, which includes cloud adjustments due to aerosols, is negative (-0.9 W m-2, medium confidence) and it is a balance of positive forcing mainly due to “black carbon” absorption of solar radiation and a negative forcing of reflecting aerosol from most aerosols. Despite its importance for climate, atmospheric nucleation is poorly understood (Almeida et al., 2013). There is high confidence that aerosols and their interactions with clouds have offset a substantial portion of global mean forcing from well-mixed greenhouse gases. They continue to contribute the largest uncertainty to the total RF estimate (IPCC, 2013). The forcing from stratospheric volcanic aerosols can have a large impact on the climate some years after volcanic eruptions. Several small eruptions have caused a radiative forcing of -0.11 W m-2 for the years 2008-2011, which is approximately twice as strong as during the years 1999-2002 (IPCC, 2013).
Figure 1.7 Radiative forcing estimates in 2011 relative to 1750 and aggregate uncertainties for the main
drivers of climate change. Values are global average radiative forcing (RF) partitioned according to the emitted compounds or processes that result in a combination of drivers. The best estimates of the net radiative forcing are shown as black diamonds with corresponding uncertainty intervals; the numerical values are provided on the right of the figure, together with the confidence level in the net forcing (VH-very high, H-high, L-low, VL-very low). Albedo forcing due to black carbon on snow and ice is included in the black carbon aerosol bar. Total anthropogenic radiative forcing is provided for three different years relative to 1750. The net effect of aerosol includes cloud adjustments due to aerosols is negative (-0.9 W m-2, medium confidence) and it is a balance of positive forcing mainly due to “black carbon” absorption of solar radiation and a negative forcing of reflecting aerosol from most aerosols. There is high confidence that aerosols and their interactions with clouds have offset a substantial portion of global mean forcing from well-mixed greenhouse gases. They continue to contribute the largest uncertainty to the total RF estimate (IPCC, 2013. Figure 5 from Approved Summary for Policymakers).
PM deposition exerts a significant influence on aquatic and terrestrial ecosystems. Deposition of acid pollutants such as sulphuric acid contributes to soil acidification with adverse effects on forests and crop cultivation and on the economy. Enhanced rates of nitrates deposition, instead, contributes to eutrophication of aquatic ecosystems, causing a negative impact on the life of aquatic animals.
The relationship between ecosystems and particulate depends on size, origin and chemical composition of particles; the effects of acid rains strongly depend on soil composition.
Deposition of particulate matter on plants can have direct effects if it resides long time on leaves or indirect effects in the case in which it is deposited to soil, where it can be absorbed by roots. When particulate permeate in soil spread by dry and wet depositions, the environmental impact is increased as chemical composition is modified by deposition.
Acid rains can damage forests and slow their growth strongly modifying the acidity of the soil, ruining leaves, solving nutritive substances and releasing toxic substances for plants (e.g., aluminium, easily absorbed by plants). When pH of soil is reduced, nutritive substances such as potassium, calcium and magnesium are exchanged with H+ and are washed. Soil has a natural ability to neutralize acidity, on the basis of chemical composition and of rocky underlayer (US EPA, 2012).
Acid components in soil can penetrate deep into it and reach aquifers, rivers and lakes, adding to the direct effect of precipitation. Rivers and lakes completely acidify when both water and soil are no more able to neutralize the acid component: pH can be reduced from normal values of 6-8 units to 2-4 units. In acidified lakes elevated concentrations of Al3+ in solution are normally found. Aluminum comes from washing of rocks by H+: in neutral pH conditions aluminum ions are blocked into rocks thanks to their reduced solubility. Acid pH and aluminum released by soil into waters are extremely dangerous to aquatic ecosystems, and in particular for ichthyic species (US EPA, 2012).
Materials exposed to air and atmospheric agents are naturally subject to degradation processes due to the effects of heat, humidity, oxidative capacities of the atmosphere and presence of microorganisms. The presence of aggressive pollutants can speed up already existing degrading processes and activate new ones. The main pollutants responsible for such acceleration are SOx,
NOx, CO2, O3 and derivatives, and PMx (Vandini et al., 2000). Acid aerosol can attack cultural
heritage and construction materials, altering their chemical composition.
The effects of PM on human health have been widely studied in the last twenty years and include asthma, lung cancer and cardiovascular issues. An important relationship has been found between current PM10 concentration in ambient air and the number of hospitalizations and deaths due to
respiratory and cardiovascular diseases (Pope et al., 1995; Dockery and Pope, 1996). The threat of atmospheric particles to health depends on their size, shape, and chemical composition. In particular, researches demonstrated that the most important parameter determining the toxicity of particles is its size, as it is correlated to the ability of penetration into the respiratory system: while PM10 is able to
penetrate in the bronchi, PM2.5 can reach the lungs and nanoparticles are able to pass through the
lungs and enter the circulatory system (Dockery and Stone, 2007; Pérez et al., 2009).
In fact, inhalation constitutes the main exposition pathway to particulate. For this reason, a concentration limit under which there is no adverse effect on health does not exist (WHO, 2002).
Human respiratory system acts a “filter” against foreign bodies: before reaching the lungs, particles have to pass through a series of natural barriers, as shown in Figure 1.8:
Figure 1.8 Depositioned particle size in respiratory tract
(http://www.tus.ac.jp/rist/lab/introduction/2research-centers/906.html).
Particles having sizes higher than 1 m are easily intercepted and deposited in nose and throat, from where are then thrown out; those having size in the range 1 m – 100 nm can deposit in bronchioles, and then be carried into the throat and thrown out in about two hours.
Ultrafine particulate is the most dangerous as it can reach alveoli and be transported by circulatory system to different organs of respiratory system. It is removed in a slower and less complete way: it can escape phagocytosis of macrophages of pulmonary alveoli and can reach lymphatic system, epithelial tissues and pulmonary pits causing wounds, inflammations and preventing gaseous exchanges with blood. Moreover, due to the particular surface structure, particles can adsorb carcinogenic chemical substances, toxic or reactive substances that are deposited on cells with which they interact (Oberdörster, 2000).
The specialized cancer agency of the World Health Organization (WHO), the International Agency for Research on Cancer (IARC), recently announced that it has classified outdoor air as carcinogenic to humans (IARC, 2013). Particulate matter, a major component of air pollution, was evaluated separately and was also classified as carcinogenic to humans (IARC, 2013). The IARC evaluation showed an increasing risk of lung cancer with increasing levels of exposure to outdoor
air pollution and particulate matter.
Anenberg et al. (2010) published an estimate of the global health effects of air pollution based on a single atmospheric model. More recently, Silva et al. (2013) improved these calculations by using results from a range of atmospheric different models—six in all—rather than relying on just one. They concluded that 2.1 million deaths occur worldwide each year as a direct result of fine particulate matter.
The map of Figure 1.9 shows the model estimate of the average number of deaths per 1,000 square kilometers (386 square miles) per year due to air pollution. The researchers used the difference in pollution levels between 1850 and 2000 as a measure of human-caused air pollution. Dark brown areas have more premature deaths than light brown areas. Blue areas have experienced an improvement in air quality relative to 1850 and a decline in premature deaths. Fine particulate matter takes an especially large toll in eastern China, northern India, and Europe—all areas where urbanization has added considerable quantities of PM2.5 to the atmosphere since the start of the Industrial Revolution. A few
areas—such as the southeastern United States—saw PM2.5 concentrations decline relative to
pre-industrial levels (shown in blue). In the southeastern United States, the decrease in PM2.5 is likely related
to a decline in local biomass burning that has occurred over the last 160 years.
Figure 1.9 Model estimate of the average number of deaths per 1000 square kilometers per year due to air
pollution. The researchers used the difference in pollution levels between 1850 and 2000 as a measure of human-caused air pollution. Dark brown areas have more premature deaths than light brown areas. Blue areas have experienced an improvement in air quality relative to 1850 and a decline in premature deaths. (http://earthobservatory.nasa.gov/IOTD/view.php?id=82087&src=eoa-iotd)
Some metals such as Fe, Cu and Mn in contact with pulmonary tissues can produce chemical reactions adverse on human health (Fenton reactions) (Harrison et al., 2001). Moreover, metals can undergo oxidation-reduction reactions or act as catalysts of chemical reactions, forming free
radicals such as OH radical, well-known for its inflammatory capabilities (Harrison et al., 2000). Ultrafine particles are also supposed to directly interact with central nervous system, being deposited on nasal mucous membrane and diffused through olfactory nerve to the brain: this can lead to adverse neurotoxic effects (Oberdörster et al., 2004).
1.1.4 Chemical composition
Particulate matter is extremely complex in terms of size and formation mechanisms and for this reason is extremely heterogeneous also from the chemical point of view. Emission and formation processes affect not only the size distribution of particles, but also their chemical composition (Raes et al., 2000). Figure 1.10 reports a schematic representation of the main mechanisms of formation of particles of atmospheric particles together with their corresponding chemical components.
Figure 1.10 Chemical composition of atmospheric aerosol (elaboration of the scheme of Seinfeld, Brice
Temine, Department of Chemistry, UCC http://crac.ucc.ie/tour/Brice1.pdf)
During recent years, substantial improvements have been carried out in the chemical characterization and identification of the main atmospheric aerosol components (Viana et al., 2008). All the individual inorganic species, typically representing more than 1% of the total PM mass, can be easily determined and their main sources identified: crustal elements (silicon, aluminium, calcium, carbonate), sea-salt aerosol (sodium chloride), inorganic secondary species (nitrate, sulphate, ammonium), primary anthropogenic species (elemental carbon).
Much more complex is the situation for organic compounds, as this class constitutes a relevant fraction of PM mass (20-60%) but includes a wide variety of individual species, each one at very low concentration levels. Organic matter can be measured as a whole, but only a small part of the species that constitute this group can be determined individually; for this reason the monitoring of organic species in PM is generally addressed only to harmful (toxic and carcinogenic) co mpounds or to specific species that can be considered tracers of specific PM emission sources.
Chemical components constituting PM are not homogeneously distributed on all size fractions, but tend to accumulate in specific intervals, as a function of the source and the corresponding formation mechanism (Raes et al., 2000).
Generally speaking, sulphates, ammonium, hydrogen ions, elemental carbon, the organic component and trace elements are mainly present in the fine fraction, while crustal (calcium, aluminium, silicon, magnesium and iron) and biological material (spores, pollen, organic fragments) are in the coarse fraction (Chiari et al., 2004; Hueglin et al., 2004; Moreno et al., 2004). Sulphates, nitrates and ammonium are among the most abundant components in PM. In gaseous phase sulphur dioxide and nitrogen dioxide react with OH radical producing sulphuric and nitric acid (Finlayson-Pitts and Pitts, 1999). As of Figure 1.11, sulphuric acid then reacts with ammonia and form ammonium sulphate, while HNO3 is neutralized by reaction with calcium carbonate of
crustal origin or by substitution with marine NaCl.
Figure 1.11 Formation processes of nitrates and sulfates (Brice Temine, Department of Chemistry UCC,
http://crac.ucc.ie/tour/Brice1.pdf)
Neutralization by ammonia is not always complete: in strongly man-made environments a sub-stoichiometric concentration of ammonia is often observed, which determines a typical acid character of PM. Sometimes acidity can be more than neutralized, such as in Saharan Dust, due to the typically basic composition of minerals that form this natural aerosol.
Nitric acid is more volatile and as a consequence significant concentrations are in form of gas, while sulfuric acid has a very low vapor pressure in environmental conditions and exist in form of particles in aerosol phase (Hewitt, 2001).