Active Android Malware Analysis:
An approach based on Stochastic Games
Riccardo Sartea
[email protected]
[email protected]
Mila Dalla Preda
[email protected]
Alessandro Farinelli
Roberto Giacobazzi
[email protected]
[email protected]
Isabella Mastroeni
University of Verona Department of Computer Science Strada le Grazie 15 - Verona, Italy
ABSTRACT
Active Malware Analysis focuses on learning the behaviors and the intentions of a malicious piece of software by inter-acting with it in a safe environment. The process can be formalized as a stochastic game involving two agents, a mal-ware sample and an analyzer, that interact with opposite objectives: the malware sample tries to hide its behavior, while the analyzer aims at gaining as much information on the malware sample as possible.
Our goal is to design a software agent that interacts with malware and extracts information on the behavior, learning a policy. We can then analyze different malware policies by using standard clustering approaches. In more detail, we propose a novel method to build malware models that can be used as an input to the stochastic game formula-tion. We empirically evaluate our method on real malware for the Android systems, showing that our approach can group malware belonging to the same families and identify the presence of possible sub-groups within such families.
CCS Concepts
•Security and privacy → Malware and its mitigation; Mobile platform security; •Computing methodolo-gies → Multi-agent reinforcement learning; Adver-sarial learning; Stochastic games;
Keywords
malware analysis, active analysis, malware model genera-tion, android systems
1.
INTRODUCTION
The first line of defense in IT security is threat detection, and common antivirus or firewalls attempt this, by using
Permission to make digital or hard copies of all or part of this work for personal or classroom use is granted without fee provided that copies are not made or distributed for profit or commercial advantage and that copies bear this notice and the full cita-tion on the first page. Copyrights for components of this work owned by others than ACM must be honored. Abstracting with credit is permitted. To copy otherwise, or re-publish, to post on servers or to redistribute to lists, requires prior specific permission and/or a fee. Request permissions from [email protected].
SSPREW ’16, September 05-06, 2016, Los Angeles, CA, USA
c
2016 ACM. ISBN 978-1-4503-4841-6/16/09. . . $15.00 DOI:http://dx.doi.org/10.1145/3015135.3015140
some kind of known information. This is possible thanks to threat analysis, aiming at achieving a better understanding of something recognized as a threat. Nowadays, malware analysis is mostly done by human security experts aided by specific tools, often built ad hoc for each new malware sam-ple detected into the wild. These tools help to identify how malware penetrate a system, how they propagate to other systems and what is the payload. This is a time consuming process, often requiring to manually analyze binary code by executing it and examining logs.
Automated techniques for threat analysis are valuable tools aiding human security experts. Specifically, such techniques can be broadly classified as static (i.e., techniques that in-spect the source or object code), or dynamic, (i.e., tech-niques that execute the malicious program and analyze the execution traces). Static techniques include several approaches such as Eureka [16], BinJuice [13], and BinHunt [10], which are frameworks for analyzing malware code producing a pos-sibly approximated representation of the control flow graph for code similarity analysis or as DroidMiner[21], a mali-cious Android app detection system that mines malimali-cious program logic from known malware. On the other hand, dynamic analysis includes execution traces analysis and the attempt to classify them using various metrics, as discussed in [3, 4, 5, 18].
Notice that, all the mentioned automated techniques are passive, i.e., they do not interact with malware during ex-ecution. However, in most realistic settings, malicious be-haviors on the infected systems are triggered by specific user actions. In this perspective, active analysis methods analyze malware by interacting with the malicious software in order to reveal the behavior. The first steps towards an active type of analysis, have been presented in [14], where authors discussed the existence of malware requiring specific inputs to show their malicious behaviors. Recently, active analy-sis has been applied to malware for smartphones [17]. In this approach the analyzer tries to reproduce very specific activation conditions in order to trigger malicious payloads, relying on stochastic models.
While previous approaches provide significant contribu-tions to active malware analysis, they still rely on human expertise to decide which actions should be executed by the analyzer in order to gain the most possible information on malware behaviors. This important issue can be addressed by considering machine learning approaches and stochastic
games. Specifically, in the context of active malware analy-sis, we have two interacting agents with opposite goals: the malware sample wants to hide its behavior from the ana-lyzer and to perform malicious activities. In contrast, the analyzer aims at learning the maximum possible amount of information regarding the malware sample behaviors in order to build countermeasures for protecting the system. This interaction can be conveniently formalized using game theory, and more in detail, the uncertainty associated to the actions of malware can be captured by stochastic games. In a recent work (Williamson et al. 2012) [19] authors apply learning algorithms for stochastic games [7] so as to devise the most informative action that the analyzer should exe-cute for reducing the uncertainty on a malware sample pol-icy. However, the learning algorithms operate on models for malware behaviors which are manually designed by human security experts.
In this work, we follow a similar methodology, but we pro-pose an automated technique for generating malware models and we apply such methodology to the Android operating system (whereas the work in [19] focuses on the Windows OS).
In more detail, this work provides the following contribu-tions to the state of the art:
1. An automated method for generating Android malware models;
2. An Active Android Malware Analysis technique allow-ing us to automatically:
(a) Safely execute malware in an isolated environ-ment;
(b) Driving the interaction with malware performing different actions using a strategy for the stochas-tic game and observing malware reactions on the system;
(c) Extract information on malware behaviors, based on the executed actions on the system;
3. An experimental analysis of real Android malware, clustering the obtained policies in relation to malware families with centroid-based and hierarchical agglom-erative clustering.
The remainder of the paper is organized as follows: in Section 2 we introduce a stochastic game model suitable for the active malware analysis, along with a heuristic method to learn malware behaviors in such model. In Section 3, we present an automated technique for building malware models using our framework. Section 4 describes our frame-work for the practical analysis of real Android malware. The malware policies obtained with our approach are analyzed in Section 5, where we apply clustering techniques to group malware in families. Finally, Section 6 concludes the paper and outlines possible future directions.
2.
BACKGROUND
Williamson et al. [19] proposed a new approach to mal-ware analysis. Analyzing malmal-ware behaviors can be seen as a process involving two agents: an analysis agent and a malware agent. The analysis agent wants to learn about the malware agent, while the latter tries both to penetrate the
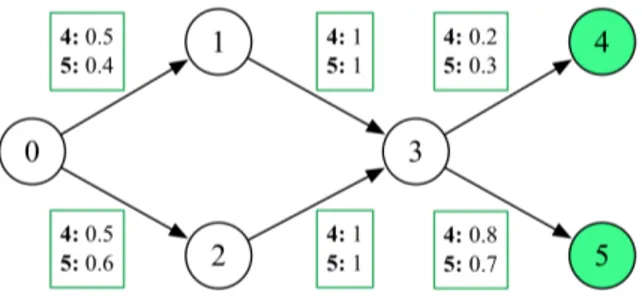
Figure 1: Malware model example
analyzed system and, maybe, to avoid the analysis. A pos-sible method for achieving this goal, is to use the concept of probability embedded in stochastic games, to model uncer-tainty about a possibly unknown adversary policy. We made a few changes to the model used in [19] in order to conduct an analysis on malware execution traces based on function calls, instead than looking at the sequence of system com-ponents affected by execution. The active malware analysis (AMA) game is played on a model consisting in a weighted graph, where each vertex represents an action that can be executed. In particular, there are malware actions (the in-ternal vertices in Figure 1) and trigger actions, performed by the analyzer (the leaves in Figure 1). Edges represent the transitions between actions and the weight on each edge is the transition probability (conditioned by analyzer cur-rent executed action) from the edge source vertex to the destination one. Those probability values are the policy of a malware sample, seen also as a behavioral signature. A malware model is a graph of the kind depicted in Figure 1, where malware starts from vertex 0, vertices 1-2-3 are the malware possible actions and vertices 4-5 are the possible actions of the analyzer. A path from the start vertex to a leaf represents a behavior (an execution trace) that malware exhibits and that the analyzer agent wants to learn.
The game is an interaction in which the analyzer chooses an action from its set of possible actions and then awaits for malware response. Once the malware sample execution ends (potentially reaching a destination leaf) then the analyzer updates the weights on the edges based on the observation of the malware sample behavior (updating the policy) and chooses another trigger action, repeating the process. The game continues till the analyzer stops. In order to trace complete behaviors we fix the maximal number of trigger-ing actions that the analyzer can execute, while in [19] the termination of the analysis is limited by the number of time-steps (possibly interrupting the response before the end of it).
In the next part of the section we present a heuristic prin-ciple that can be used by the analyzer in order to select which action to play for triggering malicious behaviors, fol-lowed by two algorithms that we employed in the experi-ments for resolving stochastic games. The section is con-cluded with a brief explanation of the clustering techniques we applied for analyzing results.
2.1
Entropy as a Reward Function
The analyzer needs a strategy for choosing the next ac-tion to execute in order to trigger malicious behaviors and acquiring the maximum possible amount of information. As
the goal of AMA is to learn about malware policies, this no-tion is incorporated in an informano-tion-centric reward func-tion based on entropy. The learning process then, will try to minimize the entropy at each step, given the fact that lower-ing the entropy means acquirlower-ing new information about the policy.
A policy π is defined as the probability distribution over the edges towards the possible actions VH, given the current analyzer executed action vhand the malware position vm. The aim is to learn this policy, based on the location of the analyzer current executed action s ∈ VH. Malware initial probability of taking an edge en∈ Evi of vertex vi is unin-formative, meaning that each edge has the same probability of being taken.
P r(en|s = vh) = 1 |Evi|
(1) Malware historical frequency of taking an edge en∈ Evi
of vertex vi, is computed based on the observation of past interactions. Specifically, if a malware sample has visited vertex vifor l times and an edge en∈ Evihas been taken m
times, when the action executed by the analyzer was s, the malware historical frequency of taking the edge enbecomes:
P r(en|s = vh) = 1 + m |Evi| + l
(2) By definition of probability, a vertex vi with outgoing edges Evi must respect the invariant:
X
en∈Evi
P r(en|s = vh) = 1 (3) A path can be defined as a sequence of edges e0, ..., ekand the probability for malware of taking a path pi∈ PH is:
P r(pi|s = vh) = Y
en∈pi
P r(en|s = vh) (4) Finally, the entropy reward function for the policy π is the following: U (π) = − X s∈VH X pi∈PH P r(pi|s)log(P r(pi|s)) (5) The resolution of an AMA game can be automated using algorithms for playing stochastic games. The decision of which analyzer action to execute is taken selecting the one with highest associated reward, computed using equation 5, and the observation of malware response to that action, leads to an update of edges probabilities given by equation 2[19].
2.2
R-Max
Multi-agent learning within stochastic games, can be ac-complished using R-Max[7] algorithm, which is capable of learning near-optimal policies of unknown agents and for this reason it can be used also within AMA games. The model is initialized optimistically: all actions in all states return the maximal possible reward. R-Max computes the expected reward associated to an action as the average of observed entropy gains of past executions of that action. The model then, is updated only if an action has been executed multi-ple times, in this way it is possible to retrieve a reasonable
amount of information on the policy in a specific state. In-deed, the information acquired in a single action execution could be misleading, since the behavior of an agent could differ between same action executions, hence, doing many repetitions before updating the model can help to handle uncertainty.
2.3
MYOPIC
R-Max assumes the near-optimal policy will be learnt in polynomial time. In a real environment this is not feasi-ble, since executing a particular action on the system could take seconds. As a result, the interest is no more in ob-taining the optimal policy, but in learning the most possible about a malware sample in very few interactions. The con-cept is applied in an extension of R-Max algorithm called MYOPIC[19], in which the entropy reward equation 5 is used as a 1-step look-ahead action selection function. The heuristic suggests that the higher is the entropy, the higher is the information to be acquired, so choosing an action fol-lowing this principle gives good results most of the times. MYOPIC then, selects the action with the current highest entropy value, ignoring past observations. The downside of this approach is that MYOPIC drops the near-optimal guar-antee of R-Max.
2.4
Clustering
Analyzing a malware sample gives insights on how it works and what are its behaviors, but there is often an additional step to be done. Knowing how different samples are related to others, measuring how similar they are to existing fam-ilies, allows to classify them into one or more categories. Clustering comes in help with this task, since it is used for partitioning a given set of datapoints into a set of groups which are as similar as possible.
2.4.1
K-Medoids
K-Medoids is a known method to perform centroid-based clustering. To use this algorithm it is necessary to know a priori the exact number of clusters the data is partitioned into. The goal is to minimize the distance between data-points of the same cluster and the datapoint designated as representative of that cluster. The representative of a cluster is called medoid and it is defined as the datapoint of a clus-ter, whose average dissimilarity from all other datapoints in the same cluster is minimal. That makes the medoid the most centrally located point of a cluster[12]. We will use K-Medoids with the purpose of allocating malware samples belonging different families, to the most related ones.
2.4.2
Hierarchical Agglomerative Clustering
Hierarchical clustering is employed when there is the ne-cessity of keeping track of the history of the clusters con-struction. The dendogram is a tree that embeds this concept of merge history. Unlike centroid-based clustering, there is no need to know a priori the number of clusters the data is partitioned into, since the process will end up with just one cluster. The agglomerative approach is bottom up, starting off with the individual datapoints and successively merging the two closest clusters in order to create a dendogram[1]. We will use Hierarchical Agglomerative Clustering so as to dissect the composition of the malware families, finding the possible existence of subfamilies composed by variations of the same malware.
3.
MODEL GENERATION
The starting point of the AMA game is always the model: its construction technique is fundamental in order to obtain a good solution. The generation of such model, though, de-pends on many factors and there exists not a well defined technique, moreover, different models can give different re-sults in terms of computed policies. In the following we present one of our main contributions: the development of an automated technique for generating malware models to be used in the AMA game. We will use our generated model for a specific malware kind in order to test if other unknown samples are somehow related to that model (using cluster-ing).
3.1
Model Structure
In the model, graph cycles are avoided because the game requires the computation of entropy for all possible paths towards every leaf vertex, hence, cycles make this computa-tion imprecise. Moreover, we need to be able to associate a sequence of malware actions to a sequence of edges of the model, retrieving a path. The correspondence is obtained labeling vertices with function calls and sequentially build a path reading the execution log, starting from the initial vertex.
3.2
Manual Generation
Williamson et al. [19] use a fixed model manually gen-erated by a security expert that knows exactly which sys-tem components to monitor. This kind of model could miss malicious behaviors if the actions taken by malware do not influence system components that are being observed.
In our approach we monitor function calls and the model can be manually generated executing a malware sample in-side the framework, manually performing interactions with the system, selecting the actions from a defined input set. After each interaction, the log is read and the sequence of function calls we consider important to define a malicious behavior is converted into a path. The process is repeated multiple times, since a behavior triggered by an action could differ because of multiple factors, thus, an action should be tested more than once for being sure of capturing all the possible paths. This results in small and fine tuned models containing as much information as required. Indeed, useless function calls can be discarded, lowering the number of edges and vertices of the model, multiple equivalent vertices can be merged into a single one and many other considerations can be done.
3.3
Automated Generation
As opposed to the manual generation, an automated one can be employed to speed up the process. This solution builds bigger models, because it can not discard edges and vertices based on the knowledge that a function call is “use-less” at certain times, but not at others. For this reason a model could contain information not strictly needed, but this is not a game breaking problem. An automated gener-ation can indeed be helpful even if not used “as is”, because it can be just manually refined instead of being built com-pletely by hand. Automated generation requires the subset of function calls to track in order to restrict the field only to the ones we are interested into, since observing all of them can generate much useless information.
Algorithm 1 builds a model starting from a set of
func-Algorithm 1 Model Generator Require:
F - set of function calls to observe A - set of actions to execute
repetitions - number of times an action has to be exe-cuted
Ensure: Model
1: root ← M akeV ertex(∅)
2: N ← [∅] . Matrix of semantically equivalent vertices 3: for all a ∈ A do
4: for i ← 1 to repetitions
5: Start malware sample in the framework
6: log ← Exeutea(a) . Log after action execution 7: Stop framework
8: c ← root
9: for all calls f ∈ log do
10: if f ∈ F then . If it’s a call to observe 11: if f ∈ N then . If previously observed
12: added ← F alse
13: for all vertices n ∈ Nf do
14: link(c, n) . Create edge
15: if ExistsCycle(root) then
16: unlink(c, n) . Avoid cycles
17: else
18: added ← T rue
19: break
20: if added = F alse then . Create new
21: n ← M akeV ertex(f )
22: Nf ← Nf+ n
23: link(c, n) . Create edge
24: else . Create first vertex for this call 25: n ← M akeV ertex(f )
26: N ← N + [n]
27: link(c, n) . Create edge
28: c ← n
tion calls to observe, for a varying level of abstraction, and an action set to execute for triggering malicious behaviors. The creation of redundant vertices is avoided when possible, trying to create only one copy of a vertex associated to the same function call. Each action is repeated for a repetition number of times, starting the malware sample in the frame-work, executing the action and then retrieving the log (lines 5-7). The execution log is parsed and for each function call, if comprised in the set of those to be observed, a semanti-cally equivalent vertex is linked to the previous parsed one. If this creates a cycle in the model, the link is undone and another vertex is tried. If a cycle is created at every linking attempt, a new vertex is generated, linked and added to the lists of semantically equivalents (lines 13-23). Appendix A reports a brief example of the application of this algorithm for the generation of a fictitious malware model.
3.4
Model Merging
Executing the AMA game on a single malware model can give hints on samples of the same family. It can show a family decomposition into different subfamilies or if a mal-ware sample is not related to any other one belonging to that family. Nevertheless, it may be useful to execute even a more sophisticated analysis, where the model analyzed is the composition of multiple malware families, with the aim of allocating samples to the correct belonging family. Starting from single malware family models, they have to be merged into a single one. We investigated two different strategies for this purpose: plain merge and semantic merge.
3.4.1
Plain Merge
The plain merge strategy is straightforward. It simply takes each single malware family model and merges their initial vertex into a new one. Each single model will con-tinue to exist in the result, maintaining all of its vertices and edges, along with the original semantics. At the end, in the model there can be redundant vertices representing the same function call.
3.4.2
Semantic Merge
The semantic merge strategy, tries to keep only one copy of a vertex if there are multiple copies of it across the single models (the check is done comparing vertex labels). This re-sults in a smaller model, maintaining the original semantics, plus additional possible behaviors generated by new paths that were not present in the single models. Indeed, an edge of a single model might be redirected to a new vertex having outgoing edges coming from other single models, obtaining paths that did not exist before the merge.
This kind of merge can be obtained starting from the sin-gle models and performing a slight variation of algorithm 1, in which there is no need to execute any malware. Each sin-gle model is analyzed, acquiring the action vertices directly from the model (instead of parsing an execution log) and linking them using the same approach of avoiding cycles.
4.
ANALYSIS FRAMEWORK
The analysis framework built is based on the existing open source sandbox project Cuckoo[8] that we have extended with the required functionality of the AMA game. The em-ulator used runs an operating system which base is the An-droid image version 4.1.2, compiled for ARM architecture. The Host runs the core component modules of the sandbox
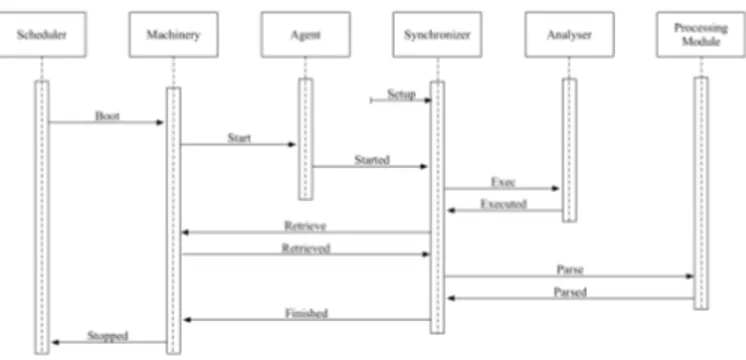
Figure 2: Analysis pipeline
that manage the whole analysis process, while the Guest is the isolated environment where the malware samples get actually safely executed and analyzed. Additionally, a col-lection of anti-detection techniques are installed for hiding the Android emulator from malware.
We modified the sandbox Machinery module in order to be able to execute the AMA game. Specifically, we added func-tions for: pausing/resuming the emulator and retrieving the malware execution log. Moreover, we built an extendable set of “actuators”, for executing analyzer actions on the system: send/receive an SMS, make/receive a call, add/remove con-tacts, touch the screen, read/write a file, open an URL. We chose to work with those high level set of actions, since they are the most common user interactions in a mobile environ-ment. Communication between modules of the framework inside the Host and the Guest makes us of Python RPC. We created two additional modules: a Synchronizer for the correct scheduling of an analysis and a log Parser, for re-trieving a model path from a sequence of function calls in the execution log. The analysis execution pipeline for one analyzer action is visible in figure 4, where time flows from top to bottom.
5.
EXPERIMENTS AND RESULTS
The main goal of the experiments was to highlight the difference in learning between R-Max, MYOPIC and an ad-ditional Random algorithm for benchmark purposes (which randomly chooses the next analyzer action to execute), ap-plied to AMA in a constrained time limit. We also investi-gated the two different strategies adopted for merging mal-ware models: plain and semantic. Results of the analy-sis have been processed with K-Medoids[12] clustering algo-rithm, in order to allocate a malware sample policy into its most related family, and with Hierarchical Agglomerative Clustering[1], so as to dissect a family composition into pos-sible subfamilies. Analysis have been conducted on models generated by the automated technique presented in section 3.
Active analysis is especially effective in analyzing malware showing malicious behaviors only if triggered by some ac-tions, such as spywares or bots. For this reason, to conduct our experiments, we chose four existing Android malware families categorized as spywares (or private data stealers) and bots: ZSone, GoldDream, SMSReplicator and Tiger-Bot. The malware samples have been downloaded from [20], which is an online malware repository for research purpose.
5.1
Clustering Evaluation
To make use of clustering of malware policies obtained from analysis, it is necessary to define a distance metric between policy πa and policy πb, by means of L1 norm as follows: distance(πa, πb) = X s∈VH X p∈PH |P ra(p|s) − P rb(p|s)| (6) The metric computes the sum of the distance for each transition in all states, to give a measure over the entire policy that becomes a multi-dimensional datapoint to be used in clustering[19].
Results of centroid-based clustering process must be eval-uated using some reference parameters. There are two main measures that can be used: Purity and Inverse Purity. In the explanation of these measures we will refer to C as the set of clusters to be evaluated, to F as the set of families (reference distribution) and to N as the total number of malware samples.
5.1.1
Purity
Purity focuses on the frequency of the most common cat-egory in each cluster. It is computed by taking the weighted average of maximal precision values:
P urity = X Ci∈C
|Ci| N Fmaxj∈F
P recision(Ci, Fj) (7) where the precision of a cluster Ci for a given family Fj is defined as:
P recision(Ci, Fj) =
|Ci∩ Fj| |Ci|
(8) Purity penalizes the noise in a cluster, but it does not reward grouping samples from the same family together[2].
5.1.2
Inverse Purity
Inverse Purity focuses on the cluster with maximum re-call for each family. It is computed by taking the weighted average of maximal recall values:
InverseP urity = X Fi∈F
|Fi| N Cmaxj∈C
Recall(Fi, Cj) (9) where the recall of a family Fi for a given cluster Cj is defined as:
Recall(Fi, Cj) =
|Fi∩ Cj| |Fi|
(10) Inverse Purity rewards grouping items together, but it does not penalize mixing samples from different families[2].
5.2
Empirical Methodology
The dataset for the experiments was composed by 40 mal-ware samples, 10 for each family. Hence, we had a knowledge of which was the belonging family of each analyzed sample. The K-Medoids clustering process has been evaluated us-ing purity and inverse purity measures, based on precision and recall respectively[2]. To compute K-Medoids centroid-based clustering, since the result could vary depending on
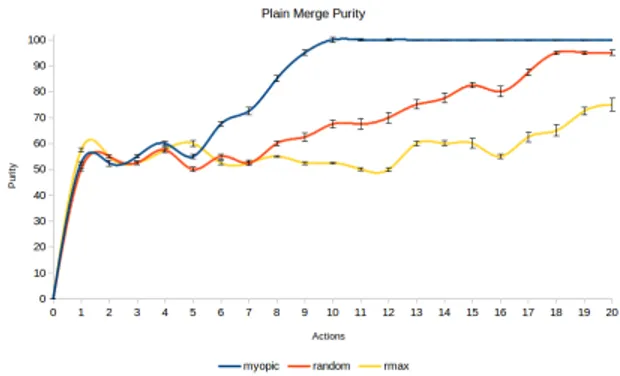
Figure 3: Plain merge purity analysis benchmark
Figure 4: Plain merge inverse purity analysis bench-mark
the choice of initial medoids, we repeated the process mul-tiple times, keeping the best result in terms of purity. From that, we computed the inverse purity of the partitioning. Each malware sample analysis has been repeated 10 times, obtaining the average as the final result.
5.3
Plain Merge Experiments
Figure 3 and 4 show the curves of purity and inverse purity respectively of the 3 tested algorithms. It is clear that MY-OPIC has an advantage over the others, when the number of actions to play is constrained.
As can be seen, there is a progress in the purity and inverse purity values at the increase of the actions limit. MYOPIC is the best in learning celerity, thanks to its entropy reducing heuristic associated to a 1-step look-ahead strategy. R-Max is the slowest in learning, because of the need of more actions to compute a policy, even though it aims to a near-optimal one.
5.4
Semantic Merge Experiments
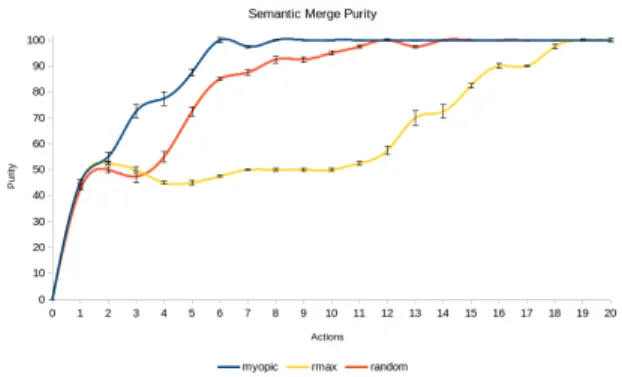
Figure 5 and 6 show the curves of purity and inverse purity respectively of the 3 tested algorithms. It is clear again that MYOPIC has an advantage over the others, when the number of actions to play is constrained, whereas R-Max is again the slowest.
MYOPIC is still the fastest learning algorithm, but all three learn faster compared to the plain merge strategy. As mentioned before, this is due to the fact that, with this merging technique, more paths become available to be fol-lowed compared to the single models. For this reason, even
Figure 5: Semantic merge purity analysis bench-mark
Figure 6: Semantic merge inverse purity analysis benchmark
if the action played is not specific of the malware sample being tested, there is a greater chance that it will move on the graph anyway, because there might exists a new corre-sponding path available.
The semantic merge strategy embeds more information in the resulting model compared to the plain one. As can be seen from the purity in figure 7, the Random algorithm (which uses no reward function nor heuristics) has a strong advantage in learning rate using the semantic merge strat-egy, because the model used is more informative by itself. The same stands for inverse purity and the other tested al-gorithms too.
Figure 7: Random purity rates comparison
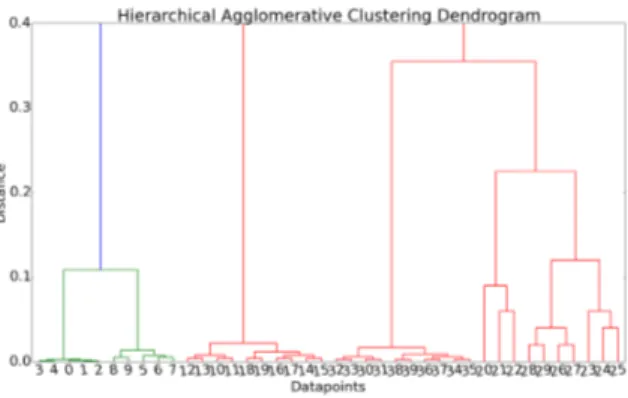
Figure 8: MYOPIC semantic merge subfamilies den-dogram
5.5
Dendogram for the Subfamilies
Dendogram in figure 8, in which 4 clusters are clearly dis-tinguished, shows the families composition obtained by Hi-erarchical Agglomerative Clustering for the semantic merge model in combination with MYOPIC. It is visible that ZSone (green lines) is composed of two main subfamilies, along with the other three main families in red. The figure has been zoomed on its lower end for a better visibility.
5.6
Multi-Behavioral Malware
During the analysis, if an analyzer action with multiple paths leading to it is tried too few times, the resulting pol-icy could differ between samples of the same malware. MY-OPIC though, overcomes this problem with its entropy re-ducing heuristic: multiple paths toward an action vertex, mean higher entropy, because of the branches between ver-tices. The algorithm, by construction, tries an action mul-tiple times in order to lower its entropy level, until enough information about it has been acquired.
Figure 9, is the result of the semantic merge analysis per-formed by Random algorithm. It is visible that the samples belonging to TigerBot family (last group of datapoints on the right) are more far from each other, since the algorithm is not capable of figuring out that they are part of the same family, because of the described multi-behavioral responses to actions. The figure has been zoomed on its lower end for a better visibility. For MYOPIC instead, as visible in figure 8, TigerBot samples are closer to each other, thanks to the algorithm entropy reducing heuristic that allows it to insist on actions triggering different malware responses.
6.
CONCLUSIONS
Experiments confirmed that the theoretically near-optimal algorithm R-Max, does not give acceptable solutions in a real environment with a low number of actions to be executed. The random based algorithm instead, gives much better re-sults considering a constrained time limit. The best and capable of handling multi-behavioral malware responses to specific actions though, has been recognized to be MYOPIC, the R-Max extension for a fast learning. It does not give the theoretical guarantee of finding the near-optimal policy, but it works very well for real Android malware analysis.
In more detail, we examined computed policies with two different clustering algorithms. The first, K-Medoids,
cor-Figure 9: Random multi-behavioral clustering
rectly grouped the majority of the policies associated to malware belonging to the same family. Notice that some of those malware were variations of others, forming sub-families within our main family groups. The second, Hi-erarchical Agglomerative Clustering, clearly displayed the presence and the composition of those subfamilies.
We proposed an automated technique for generating mal-ware models and we also investigated two different strategies for merging those models: plain and semantic. Experiments have shown that both are suitable for active malware analy-sis, but the second one gives better results in terms of learn-ing rate with a constrained number of actions to be played. Specifically, the semantic merge strategy embeds more infor-mation in the model, helping less sophisticated algorithms (such as Random) to reach better results with a less number of actions.
Future work includes a deeper study on the malware model to be used, starting from its generation. The use of static analysis could be investigated as a different approach to cre-ate such model. A particularly interesting future direction is to apply the stochastic game approach to self-modifying mal-ware. This would allow us to extract signatures of metamor-phic malware as policies, in this case applied to code trans-formation, therefore bypassing dynamic obfuscation strate-gies employed by malware[9]. In particular, the idea of merg-ing malware models may become useful also in this context, where different versions of the same malware can be merged to obtain a metamorphic malware model. There might also be different and better techniques to merge malware fam-ilies, other than the semantic and plain ones employed in the experiments. Another enhancement could be the inves-tigation of the possibility to analyze a malware “on the fly”, generating its model during the analysis execution, without the need of a pre-built one. This alternative would change the way policies are compared, because malware belonging to the same family might have different models that would have to be related somehow.
Finally, we observe that the existence of triggering condi-tions is not the only way malware interacts with the user or the environment for protecting itself. Malware may try to avoid analysis by exploiting environment detection tricks allowing them to understand whether they are emulated or not. These techniques are called anti-emulation checks[11, 15]. If an anti-emulation check detects the presence of a virtual environment, the malware sample changes its behav-ior showing only harmless executions. Most of the actual
frameworks do not provide the possibility to dynamically customize the configuration of the virtual machine, making easy for malware to detect the virtual environment [6]. We believe that an active approach could be employed also to discover and bypass anti-emulation checks.
APPENDIX
A.
AUTOMATED MODEL GENERATION
EXAMPLE
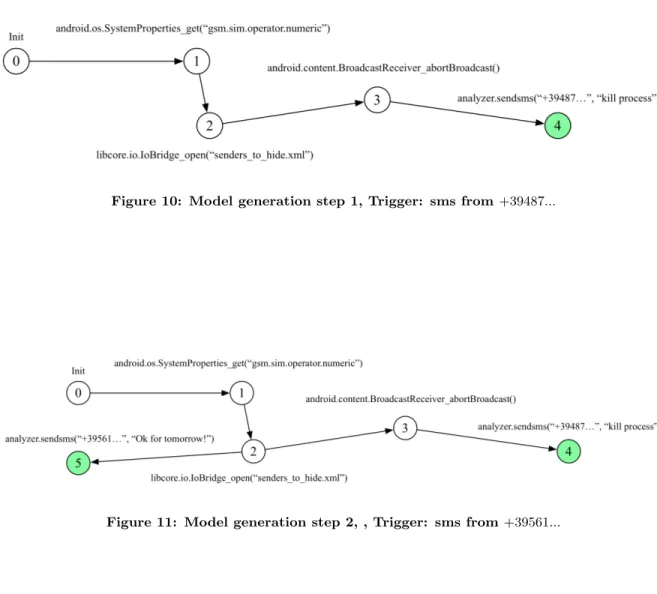
In this appendix we present a brief example of the ap-plication of algorithm 1 for the automated generation of a model. Specifically, we consider a synthetic malware sample we created, which hides the messages received if the sender appears in a given hide-list. We chose to illustrate the ex-ecution of the algorithm on a synthetic sample for the sake of clarity, resulting in a small model easy to read. In our example, the analyzer executes three triggering actions, sim-ulating incoming SMS from two different mobile numbers: the first and the last SMS are sent by the same number and will be hidden to the user, since the sender appears in the hide-list. The model is generated in three steps, one for each of the actions executed by the analyzer. Below, we report the sequences of function calls observed in each step and the resulting paths. 1. Trigger: sms from +39487...: SystemProperties_get("sim.operator.numeric")[1], IoBridge_open("senders_to_hide.xml")[2]), BroadcastReceiver_abortBroadcast()[3] 2. Trigger: sms from +39561...: SystemProperties_get("sim.operator.numeric")[1], IoBridge_open("senders_to_hide.xml")[2] 3. Trigger: sms from +39487...: SystemProperties_get("sim.operator.numeric")[1], IoBridge_open("senders_to_hide.xml")[2], BroadcastReceiver_abortBroadcast()[3], IoBridge_open("senders_to_hide.xml")[6] Figures 10, 11 and 12 show the model structure after each triggering action executed by the analyzer. Notice that, in figure 12, vertices 2 and 6 are semantically equivalent, but they are not merged in order to avoid cycles (see Section 3).
Figure 10: Model generation step 1, Trigger: sms from +39487...
Figure 11: Model generation step 2, , Trigger: sms from +39561...
B.
REFERENCES
[1] C. C. Aggarwal and C. K. Reddy. Data Clustering: Algorithms and Applications. Chapman & Hall/CRC, 1st edition, 2013.
[2] E. Amig´o, J. Gonzalo, J. Artiles, and F. Verdejo. A comparison of extrinsic clustering evaluation metrics based on formal constraints. Information Retrieval, 12(4):461–486, 2008.
[3] M. Bailey, J. Oberheide, J. Andersen, Z. M. Mao, F. Jahanian, and J. Nazario. Recent Advances in Intrusion Detection: 10th International Symposium, RAID 2007, Gold Goast, Australia. Proceedings, chapter Automated Classification and Analysis of Internet Malware, pages 178–197. Springer Berlin Heidelberg, 2007.
[4] U. Bayer, P. M. Comparetti, C. Hlauschek, C. Kruegel, and E. Kirda. Scalable, behavior-based malware clustering. In Proceedings of the 16th Annual Network and Distributed System Security Symposium (NDSS 2009), 1 2009.
[5] U. Bayer, A. Moser, C. Kruegel, and E. Kirda. Dynamic analysis of malicious code. Journal in Computer Virology, 2(1):67–77, 2006.
[6] F. Bellini, R. Chiodi, and I. Mastroeni. MIME: A formal approach to (android) emulation malware analysis. In Foundations and Practice of Security - 8th International Symposium, FPS 2015, pages 259–267, 2015.
[7] R. I. Brafman and M. Tennenholtz. R-max - a general polynomial time algorithm for near-optimal
reinforcement learning. J. Mach. Learn. Res., 3:213–231, mar 2003.
[8] Cuckoo-Foundation. Cuckoo sandbox. https://www.cuckoosandbox.org/.
[9] M. Dalla Preda, R. Giacobazzi, and S. K. Debray. Unveiling metamorphism by abstract interpretation of code properties. Theor. Comput. Sci., 577:74–97, 2015. [10] D. Gao, M. K. Reiter, and D. Song. Binhunt:
Automatically finding semantic differences in binary programs. In Proceedings of the 10th International Conference on Information and Communications Security, ICICS ’08, pages 238–255, Berlin, Heidelberg, 2008. Springer-Verlag.
[11] M. G. Kang, H. Yin, S. Hanna, S. McCamant, and D. Song. Emulating emulation-resistant malware. In Proceedings of the 1st ACM Workshop on Virtual Machine Security, VMSec ’09, pages 11–22, New York, NY, USA, 2009. ACM.
[12] L. Kaufman and P. J. Rousseeuw. Clustering by means of medoids. Statistical Data Analysis Based on the L1-Norm and Related Methods, pages 405–416, 1987. [13] A. Lakhotia, M. Dalla Preda, and R. Giacobazzi. Fast
location of similar code fragments using semantic ’juice’. In 2nd Workshop on Program Protection and Reverse Engineering PPREW 2013. ACM, 2013. [14] A. Moser, C. Kruegel, and E. Kirda. Exploring
multiple execution paths for malware analysis. In 2007 IEEE Symposium on Security and Privacy, pages 231–245, May 2007.
[15] J. Rutkowska. Red pill, or how to detect vmm using one cpu instruction, 2004.
[16] M. Sharif, V. Yegneswaran, H. Saidi, P. Porras, and
W. Lee. Computer Security - ESORICS 2008: 13th European Symposium on Research in Computer Security, M´alaga, Spain, October 6-8, 2008. Proceedings, chapter Eureka: A Framework for Enabling Static Malware Analysis, pages 481–500. Springer Berlin Heidelberg, 2008.
[17] G. Suarez-Tangil, M. Conti, J. E. Tapiador, and P. Peris-Lopez. Computer Security - ESORICS 2014: 19th European Symposium on Research in Computer Security, Wroclaw, Poland, September 7-11, 2014. Proceedings, Part I, chapter Detecting Targeted Smartphone Malware with Behavior-Triggering Stochastic Models, pages 183–201. Springer International Publishing, Cham, 2014.
[18] G. Wagener, R. State, and A. Dulaunoy. Malware behaviour analysis. Journal in Computer Virology, 4(4):279–287, 2007.
[19] S. A. Williamson, P. Varakantham, O. C. Hui, and D. Gao. Active malware analysis using stochastic games. In Proceedings of the 11th International Conference on Autonomous Agents and Multiagent Systems - Volume 1, AAMAS ’12, pages 29–36. International Foundation for Autonomous Agents and Multiagent Systems, 2012.
[20] Xi’an Jiaotong University. Androidmalshare. http://sanddroid.xjtu.edu.cn:8080.
[21] C. Yang, Z. Xu, G. Gu, V. Yegneswaran, and P. Porras. Computer Security - ESORICS 2014: 19th European Symposium on Research in Computer Security, Wroclaw, Poland, September 7-11, 2014. Proceedings, Part I, chapter DroidMiner: Automated Mining and Characterization of Fine-grained Malicious Behaviors in Android Applications, pages 163–182. Springer International Publishing, Cham, 2014.