1 Contract no. 688320
MADFORWATER
DevelopMent AnD application of integrated technological and management solutions FOR wasteWATER treatment and efficient reuse in agriculture tailored to the needs of
Mediterranean African Countries
Deliverable No. 6.4
Deliverable Full title Guidelines for the adaptation of the project
outcomes beyond the project boundaries
Work Package No. and Title WP6 - Integration and assessment of water and land
management strategies, policy recommendations and exploitation
Lead beneficiary (extended name and acronym)
University of Bologna - UNIBO Authors
(Acronyms of beneficiaries contributing to the deliverable)
UNIBO, WER, IRSTE, UMIL, IAMB, UPM, FHNW
Planned delivery date 30/9/2020 (M52)
Actual delivery date 15/10/2020 (M53)
Dissemination level:
(PU = Public; PP = Restricted to other program participants; RE = Restricted to a group specified by the consortium; CO = Confidential, only for members of the
consortium)
PU
Project website www.madforwater.eu
Project start date and duration Start date of project: 01 June 2016 Duration: 54 months
The communication reflects only the author’s view and the Executive Agency for Small and Medium-sized Enterprises is not responsible for any use that may be made of the information it contains.
2
Content
1 Abstract ... 4
2 Introduction ... 5
3 Guideline for the adaptation of the MADFORWATER approach for the analysis of water security ... 6
3.1 Goals of this guideline ... 6
3.2 Guideline description ... 6
4 Guidelines for the adaptation of the MADFORWATER technologies for wastewater treatment 12 4.1 Goals of this guideline ... 12
4.2 Guideline description ... 12
4.3 Specific aspects to be considered in the application of the MADFORWATER approach for the adaptation of the MADFORWATER technologies for wastewater treatment 14 5 Guideline for the adaptation of the MADFORWATER irrigation technologies ... 15
5.1 Goals of this guideline ... 15
5.2 Guideline description ... 15
5.2.1 Adaptation of the MADFORWATER calibrated nozzle ... 15
5.2.2 Adaptation of the MADFORWATER mini-sprinkler ... 16
5.2.3 Adaptation of the MADFORWATER gated pipe ... 18
5.2.4 Adaptation of the use of plant growth promoting bacteria ... 20
5.2.5 Adaptation of the model for optimal irrigation with treated wastewater (SIM) 21 6 Guideline for the adaptation of the decision support tool for wastewater management ... 24
6.1 Goals of this guideline ... 24
6.2 Guideline description ... 24
6.3 Specific aspects to be considered in the application of the decision support tool for wastewater management to a MENA country ... 28
7 Training package to allow potential users to adapt the decision support tool for wastewater treatment to other basins or countries ... 29
7.1 Skills that the attendees need to have before attending the course ... 29
7.2 Skills that the attendees will develop thanks to the course ... 29
7.3 Articulation of the course into modules ... 30
8 Guideline for the adaptation of the decision support tool for water and land management in agriculture ... 32
8.1 Goals of this guideline ... 32
3
8.3 Specific aspects to be considered in the application of the decision support tool
for water and land management in agriculture to a MENA country ... 34
9 Training package to allow potential users to adapt the decision support tool for water and land management in agriculture to other basins or countries ... 35
9.1 Skills that the attendees need to have before attending the course ... 35
9.2 Skills that the attendees will develop thanks to the course ... 35
9.3 Articulation of the course into modules ... 35
4
1
Abstract
Following the indications reported in Task 6.3.5 of the MADFORWATER project, MADFORWATER partners dedicated a relevant effort to the development of guidelines for the adaptation to other basins in Morocco, Egypt and Tunisia and to other MENA countries of the MADFORWATER tools, technologies and approaches. The general goal of these guidelines is to allow a generic stakeholder (such as a manager of a wastewater treatment plant, a wastewater company, an irrigation company, a farmer, the director of a basin authority, an officer of the Ministry of Irrigation) to perform the necessary activities in order to adapt the MADFORWATER technologies and water management tools to the specific context in which the considered technology or tool needs to be implemented. The adaptation guidelines developed in the framework of MADFORWATER and presented in this deliverable are relative to (i) the MADFORWATER approach for the analysis of water security, (ii) the project’s technologies for wastewater treatment and irrigation, and (iii) the two MADFORWATER decision support tools for wastewater management and for water & land management in agriculture. With regard to these two decision support tools, the adaptation guidelines are integrated by the description of the structure of two training courses that the MADFORWATER partners FHNW, IAMB and UPM can offer to potentially interested stakeholders.
The adaptation guidelines presented in this deliverable are integrated by a consistent amount of material – such as the user manuals and computer codes for the decision support tools, the detailed description of the MADFORWATER approach for the assessment of water security and the fact-sheets of the MADFORWATER technologies – freely accessible to any interested stakeholder through the MADFORWATER website or the repositories in which the MADFORWATER dataset have been deposited (mainly, AMS Acta and Zenodo). The links for the direct download of this material are systematically reported in this deliverable.
5
2
Introduction
The issue of the effective adaptation of technology and water management tools to contexts different than the ones for which the considered technology and water management tools have been initially developed is a crucial one. Indeed, a technology or a water management tool that perform efficiently in a given context could lose their effectiveness if they are implemented in a given context without a suitable adaptation effort.
On the basis of this observation, MADFORWATER partners dedicated a relevant effort to the development of guidelines for the adaptation to other basins in Morocco, Egypt and Tunisia and to other MENA countries of the MADFORWATER tools, technologies and approaches, with the ultimate goal to maximize the project’s impact.
The adaptation guidelines developed in the framework of MADFORWATER and presented in this deliverable include the following aspects:
(i) the MADFORWATER approach for the analysis of water security, based on the Asian Water Development Outlook of 2016;
(ii) the project’s technologies for wastewater treatment; given the variety of wastewater technologies developed within MADFORWATER, a single and general guideline has been produced, relatively to the adaptation of a generic train of wastewater treatment technologies; (iii) the project’s irrigation technologies; in this case, a specific guideline has been produced for each technology, with the exception of the innovative tensiometer, as this latter technology did not reach within the MADFORWATER timeframe a sufficient technology readiness level;
(iv) the Safe Irrigation Model (SIM), an innovative model developed by MADFORWATER - and made freely available to any interested stakeholder – for optimizing the irrigation scheduling and the supply of nutrients taking into account the possible use of treated wastewater for irrigation;
(v) the two MADFORWATER decision support tools (DSTs) for wastewater management and for water & land management in agriculture; both DSTs have been made freely available to any interested stakeholder through the Zenodo and AMS Acta repositories.
6
3
Guideline for the adaptation of the MADFORWATER approach for the
analysis of water security
3.1 Goals of this guideline
The aim of this chapter is to provide a guideline to carry out a water security assessment both at national or lower scales, following the criteria of the Asian Water Development Outlook 2016 (hereinafter 2016 AWDO 2016) in order to understand better the links between the water related risks and the economy.
According to UN-Water1, Water Security is defined as “the capacity of a population to
safeguard sustainable access to adequate quantities of acceptable quality water for sustaining livelihoods, human well-being, and socio-economic development, for ensuring protection against water-borne pollution and water-related disasters, and for preserving ecosystems in a climate of peace and political stability”.
In this sense, a Water Security assessment is a powerful tool to better understand the current and future water related issues and the capacity of the society to cope with them. If the evaluations is applied on a broader geographic scope, it also allows to compare the water related situation of various regions. Similarly, when a water security assessment is developed on a regular basis, the effect of different policies on the evolution of water security can be assessed.
Usually, Water Security is indistinctly used from other similar terms such as Water Stress and Water Vulnerability to highlight risks and problems of the water challenge “too much – too little - too dirty”! Still today there is no unified approach on how to use them. When it comes to the question “which sub-indicators should be considered”, the literature offers a vast diversity of definitions, approaches and assessment frameworks.
The intention of MADFORWATER was not to create another water assessment framework, but to enable a better comparability between regions and to allow predictions of future developments. That is why the proven 2016 AWDO has been selected. This framework provides a comprehensive national view for five Key Dimensions related to household, economic, urban, environmental, and resilience to water-related disasters. Thanks to the modular concept of the 2016 AWDO approach, the assessment can be done also for a single Key Dimension. In particular, key dimension 2, Economic Water Security, has been selected in MADFORWATER as the one providing the highest added value, as it offers a systematic Water Stress characterization and provides the most relevant linkage to a potential wastewater ruse. Within the Economic Water Security dimension, the characterization of Water Stress is an intrinsic and explicit part of the assessment. Given the related and inverse nature of Water Security and Water Vulnerability, a characterisation of Water Vulnerability is included implicitly.
3.2 Guideline description
➢ How to apply the 2016 AWDO framework?
The characterization of the Economic Water Security follows a nested approach using selected indicators from the 2016 AWDO assessment framework. It combines both the elaboration of spatial explicit Water Stress related indicators with indicators developed at basin
7
or regional level. In both cases, the subsequent aggregation of information for describing the Economic Water Security is required.
The 2016 AWDO2 key dimension Economic Water security is based on the performance
of four indexes (Figure 3.1): a general one to assess the water-related boundary conditions (Water Resources Index) and three sector-specific indexes (Agriculture, Energy and Industry Indexes). Each of these four indexes (L3) is composed by different levels of sub indicators (L1 and L2). The value of each sub indicator is transformed into AWDO scores, ranging from 1 to 5, by using a set of scoring tables (AWDO, 2016). The final total score of each sub indicator is subsequently aggregated into the final Economic Water Security dimension to a maximum of 20 points, according to the weight established in the methodology (Figure 3.1).
Figure 3.1: Structure of the 2016 AWDO Key dimension 2: Economic Water Security.
The AWDO framework was initially developed for an application at national level. However, the same approach could be applied to lower scales, such as the basin level, with minor adjustments. In such a case, it is recommended to restrict the analysis to the indicators relative to the Water Resources and Agricultural Index. This is because: i) in case of the Industry Index, no reliable information is usually available at basin level; ii) in case of the Energy Index, since the electricity network is usually interconnected at national level, it does not make any sense to differentiate the source of energy on scales lower than the country. In this way, the aggregation of each sub-indicator (L3) should be modified proportionally to a maximum value of 10.
➢ Description of the sub-indicators and data needed
2 A detailed description of the methodology, including the scoring tables per sub-indicators, can be found in the AWDO report (2016) and in the report “Deliverable 1.2 Water stress and Water Vulnerability indicators and maps” of MADFORWATER.
8
A more detailed description of each sub-indicator, including potential data sources at national level can be found in Table 3.1. In case the analysis is developed at a lower scale, such as a river basin, it is strictly recommended to use other national or regional sources of information.
For some of the sub-indicators, especially for those related with the Water Resources Index (inter annual variability, intra annual variability, storage ratio, water stress and storage drought duration length index), the calculation on a spatial explicit way is recommended. Subsequently, the average value can be aggregated to a national (or subnational) level with a GIS software (Figure 3.2).
Figure 3.2: Combining spatial distributed information to a national scale
➢ Water Security outlook for 2050
Integrated water management does not only demand an in-depth understanding of the current Water Stress situation, but it benefits also from outlining future developments. In this context it is of particular interest how the predicted climate change may affect rainfall variability and drought durations. Future available water resources and the possible change of water consumption as a result
of socio-economic development are difficult to predict. However, given their relevance in determining the future Water Security, at least an indicative estimation should be made, basing the analysis in the projected rainfall (and therefore water availability) and the projected population (and therefore the water withdrawal) (Figure 3.3).
Figure 3.3. Climate change forecasting and estimations for the future water consumption towards a 2050 Water Stress outlook
9
Table 3.1. Sub-indicators of the key dimension Economic Water Security of the AWDO approach.
Sub Index Symbol Description Data Source at national level
1. Broad Economy Index - Water-related boundary conditions for the use of water for economic purposes 1.1 Resources reliability - Indicating the resilience to water availability fluctuations
1.1.1 Inter annual variability Cv,a Rainfall coefficient of variation between years Monthly and yearly rainfall: CHIRPSv2.0 database: Funk et al., 2015.
1.1.2 Intra annual variability Cv,m Rainfall coefficient of variation within the year 1.1.3 Storage ratio
SR Relation between storage capacity and the total renewable resources (TRWR) Storage capacity: Lehner et al., 2011. TRWR: Aquastat (2019).
1.2 Water Stress
WS Relation between freshwater withdrawal (WW) and total renewable resources (TRWR)
Fresh Water Withdrawal and TRWR: Aquastat (2019). 1.3 Storage Drought duration
length index
SLI
Indicating the duration that the economic sectors could be supplied by the water stored in dams during a dry period. It is the relation between the storage capacity and the average drought duration (in months), calculated through the
Standardized Precipitation Index (SPI).
Storage capacity: Lehner et al., 2011.
Standardized Precipitation Index (SPI): Svoboda et al., 2012. Monthly rainfall: CHIRPSv2.0 database (Funk et al., 2015).
1.4 Data availability Removed from the present study -
2. Agricultural Index - Indicating water productivity in agriculture and food security 2.1 Water productivity in
Agriculture WPA
Relation between the gross domestic value of agriculture (AGDP) and the water used by the sector
AGDP: Aquastat (2019).
Agricultural Water Withdrawal: Aquastat (2019). 2.2 Self-sufficiency in Agriculture
SSA
Relation between the annual water footprint of agricultural goods consumption divided by the annual water footprint of agricultural goods production (net balance of imported virtual water).
Importer and exported Water Footprint: Hoekstra and Mekonnen., 2012.
3. Energy Index - Indicating water productivity in energy generation and energy security 3.1 Water productivity in Energy
WPE Relation between the electricity produced and the water consumed for its production
Total annual electricity production: national sources. Water consumed per type of energy: Mekonnen et al., 2015. 3.2 Minimum platform for
electricity production MPE
Relation between the country’s per capita energy production from average per capita energy production of the region
Total annual electricity production and average per capita: national sources.
4. Industry Index - Water
productivity in Industry WPI
Indicating water productivity in industry by the relation between the gross domestic value of industry and the water used by the sector
Industrial gross domestic product: Aquastat (2019). Industrial Water Withdrawal: Aquastat (2019).
Outlook 2050
Inter annual variability, Intra
annual variability and SPI CV,a2050 Cv,m2050
SLI2050
Rainfall data projection for 2050 is extracted by the CORDEX data set, providing monthly and yearly ensemble means from 19 model combinations. The
Representative Concentration Pathway (RCP) 8.5 is recommended as it represents the more extreme scenario.
Rainfall projection 2050: CORDEX data base (Jones et al., 2011).
TRWR for 2050
TRWR2050 A proxy to estimate the TRWR in 2050 can be done by extrapolating the current
relation between rainfall and water availability to the projected rainfall in 2050.
Rainfall projection 2050: CORDEX data base (Jones et al., 2011).
Water Withdrawal for 2050
WW2050 The current urban and industrial water withdrawal per capita at country level can
be extrapolated to the predicted population as projected for 2050.
Growth population: spatially explicit global population database (Jones and O’Neill, 2016).
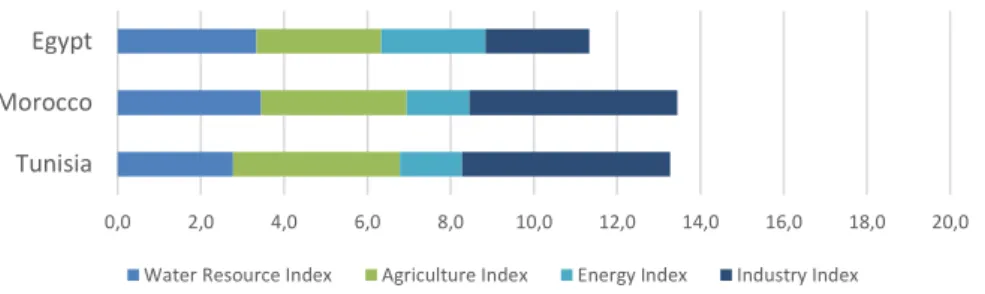
10 The result obtained through the application of the proposed water security assessment is a final score, ranging from 1 to 20, where a low value indicates lower water security and a high values indicates higher water security. However, the individual score of a specific country or region has low added value, unless it is compared with other similar areas (i.e. other MENA countries) or regular periods (to see the evolution over the time).
In order to understand better why an area presents a certain score, it is also recommended not only to compare the total score to that of other countries, but also to represent the disaggregated values of the indexes that make up the final score. As an example, the representation of the results from the assessment developed within MADFORWATER for three countries of North Africa (Morocco, Tunisia and Egypt) can be found in Figure 3.4, with the scores disaggregated for the 4 major indexes.
Figure 3.4. Water security of Morocco, Egypt and Tunisia following the 2016 AWDO Economic Water Security approach. Aggregated values over a maximum score of 20.
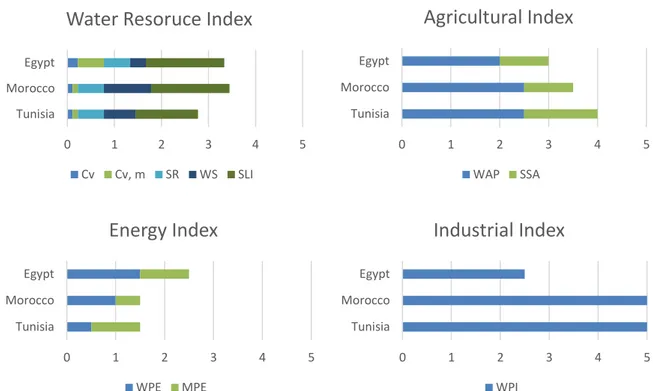
The same could be done for the whole set of sub-indicators comprising the assessment, although the interpretation would be more complex (Figure 5). In such as case, it is recommended to present the values of the sub-indexes separated per Index and not for the 4 Indexes at the same time, as shown in Figure 3.5.
0,0 2,0 4,0 6,0 8,0 10,0 12,0 14,0 16,0 18,0 20,0
Tunisia Morocco Egypt
11
Figure 3.5. Disaggregated scores of the sub-indexes comprising the water security of Morocco, Egypt and Tunisia following the 2016 AWDO Economic Water Security approach. The explanation of each sub-index is reported in Table 1.
A detailed explanation of the methodology to assess the Economic Water Security at national scale and at basin / regional scale is reported respectively in Deliverables 1.2 and 1.4 of the MADFORWATER project, freely accessible through the project’s website
(https://www.madforwater.eu/public-documents/).
In conclusion, a water security assessment is a powerful tool to understand the water related issues and hazards of a specific area. It combines the information provided by several sources into a grouped and standardized value. It can be used for awareness raising at different levels, from citizens to policy makers, being the key to initiate measures and to derive the right policy instruments to improve the water situation. When these evaluations are applied on a broader geographic scope, they also allow to compare the water related situation of various regions. Similarly, when a water security assessment is developed on a regular basis, the effect of different policies on the evolution of water security could be assessed. This can lead to an overall better understanding of the water situation on multiple scales and being more informed to take action. In this way the countries can secure their potential for future food supply.
0 1 2 3 4 5
Tunisia Morocco Egypt
Water Resoruce Index
Cv Cv, m SR WS SLI 0 1 2 3 4 5 Tunisia Morocco Egypt
Agricultural Index
WAP SSA 0 1 2 3 4 5 Tunisia Morocco EgyptEnergy Index
WPE MPE 0 1 2 3 4 5 Tunisia Morocco EgyptIndustrial Index
WPI12
4
Guidelines for the adaptation of the MADFORWATER technologies for
wastewater treatment
4.1 Goals of this guideline
This guideline has the following goals:
➢ To evaluate whether a given wastewater (WW) treatment train is suitable for the production of irrigation quality treated WW, starting from a given WW type, under the physical conditions of the target basin / region (temperature, solar radiation), taking into account the local standards for treated WW reuse.
➢ If the treatment train is suitable, to identify its optimal operational conditions in the conditions of the target basin / region (HRT, recycle ratio, sludge age, organic volumetric load).
➢ If the treatment train is not suitable, to identify the bottlenecks and possible modifications of the train (addition of a pre-treatment, change of temperature, etc).
4.2 Guideline description
This adaptation guideline refers to a generic combination of 1 WW treatment train and 1 WW type. The main features of each MADFORWATER treatment technology, such as the type of pilot plant needed and the main operational conditions, are described in the 2nd MADFORWATER
newsletter (
https://www.madforwater.eu/wp-content/uploads/2018/05/MADFORWATER-Newsletter-May-2018.pdf).
The WW treatment train adaptation process is articulated in the following steps:
➢ Sampling & characterization of real WW samples. The WW characterization has to include the analytical parameters locally used to assess water quality for irrigation reuse, such as: BOD, COD, total suspended solids, total dissolved salts, total nitrogen, total phosphorous, heavy metals, fecal coliforms. This list has to be carefully revised to add all the parameters that are specific for the WW to treat. for example, in the case of textile WW typical dyes must be included in the analytical parameters. Attention has to be paid to the possible components that may be missing in the raw WW, but that are necessary for the process (i.e. in the biological treatments, nitrogen and phosphorous as macro-nutrients).
➢ Definition of typical summer and winter climate conditions of the target country / basin (T, solar radiation if applicable). The compatibility of these climatic conditions with the required operating conditions of the WW treatment technology under consideration must be carefully checked.
➢ Development of a 10-50 L lab-scale pilot plant of each technology included in the treatment train, operating in continuous mode. The scale should be adjusted to the type of technology selected, more or less sensitive to scale up problems. For biological treatments a 10-20L volume is normally enough, whereas for processes in which fluid dynamic aspects are more important a larger scale (50-100 L) is suggested. ➢ Definition of the monitoring program for each technology included in the treatment
train (parameters and frequency), in relation to the standard for treated WW reuse to be respected. In this step some analysis on the variability of the input and output parameters have to be taken into account.
➢ Definition and implementation of a specific start-up procedure for the pilot plant. Timing and phases of the start-up are variable according to the technology. for
13
example, for Olive Mill WW dephenolization no specific procedure is necessary, only the indication to wait 5-10 adsorption/desorption cycles before assessing the final plant performance. In the case of biological treatment a relatively long start-up time is often needed, especially if slow biological activity is involved (i.e. anaerobic treatment) and an adaptation of the biomass is required to specific recalcitrant or inhibitory elements that can be present in the WW. In general, start-up is performed in batch mode followed by an initial period of continuous conduction in safe operating conditions (high hydraulic retention time and low organic load); then the steady-state conditions are reached gradually. In particularly severe cases, such as the anaerobic treatment of raw Olive Mill WW, a transient strategy is recommended, with a start-up with an alternative less toxic WW and a progressive substitution of the initial feed with the actual WW to be treated. Inoculum adaptation time can be assumed as 3-5 residence times in the less problematic cases, but the adaptation time is longer in the case of particularly toxic WWs. The total adaptation time can be very long in the case of anaerobic digestion, where the residence time can be 20-40 days. To reduce adaptation time a special attention should be paid to the choice of the inoculum, that should be taken from full scale plants operating with a similar WW.
➢ Operation of the pilot plant for at least either 1 month or 3 residence times, at constant conditions in terms of flow rate, volumetric load & sludge recycle ratio. The outlet composition must be frequently monitored to check the attainment of the steady-state condition. During this period, on the basis of the monitoring data, the removal yield and degradation rate for each monitored pollutant P must be calculated must be calculated, as follows:
𝑃 removal yield = (𝑃𝑖𝑛− 𝑃𝑜𝑢𝑡) 𝑃⁄ 𝑖𝑛
𝑃 mean degradation rate = (𝑃𝑖𝑛− 𝑃𝑜𝑢𝑡) 𝐻𝑅𝑇⁄
where Pin and Pout indicate the concentrations of the generic parameter P in the inlet
and effluent WW; HRT is the hydraulic retention time.
A special attention must be paid in the case of feeds that can vary significantly in time. In this case one can either track the feed composition 1 retention time earlier than the outlet characterization time or use long-term means that cover the feed composition oscillation period.
➢ It is crucial to test the robustness of the process, i.e. how the process performances change as a result of changes in the operating conditions. This step could include for example an increase in organic volumetric load, due to a higher concentration of a crucial WW component, and a reduction in HRT due to an increase in influent flowrate. Each condition should be tested for either 1 month or 3 HRTs.
➢ If the winter condition is significantly different from the summer one in the target country, the process performances must be assessed in laboratory conditions mimicking both seasons, for either 1 month or 3 retention times.
➢ If the treatment train results to be suitable in relation to the standards for WW reuse to be met, the next step consists in performing periodic changes in operational conditions (HRT, recycle ratio, sludge age, organic volumetric load) until the optimal operational condition is achieved.
14
➢ If the treatment train is not suitable, in relation to the standards for WW reuse to be met, it is necessary to identify possible modifications of the train, such as the addition of a pre-treatment or change of temperature.
➢ The last step consists in the definition of an approach for the scale-up of the studied treatment train to a field-scale pilot plant. The scale-up could require to test intermediate scales, if transport phenomena limitations are expected.
4.3 Specific aspects to be considered in the application of the MADFORWATER approach for the adaptation of the MADFORWATER technologies for wastewater treatment
The main lessons learnt during the MADFORWATER project in relation to the adaptation of WW treatment technologies are the following ones:
- it is necessary to reduce to the very minimum the use of synthetic WW mimicking the real one (i.e. only in the first laboratory experiments and in the start-up of the process); in other words, the researcher must make sure that he/she can obtain and store an amount of real WW sufficient to operate the pilot in continuous mode for a sufficient time;
- it is necessary to take into account the seasonal variations and, in a specific period, intrinsic variability in WW quality;
- it is necessary to pay particular attention to possible components that may be missing in the raw WW, but that are necessary for the process (i.e. in the biological treatments, nitrogen and phosphorous are crucial macro-nutrients).
15
5
Guideline for the adaptation of the MADFORWATER irrigation technologies
5.1 Goals of this guideline
This section aims at guiding any interested stakeholder in assessing, adapting to specific local conditions and properly managing the different irrigation technology developed and tested in the framework of MADFORWATER. The aspects related to the management of unintended impacts related to the quality of the water are specially considered. The main features of each MADFORWATER irrigation technology are described in the 2nd MADFORWATER newsletter
(
https://www.madforwater.eu/wp-content/uploads/2018/05/MADFORWATER-Newsletter-May-2018.pdf).
5.2 Guideline description
5.2.1 Adaptation of the MADFORWATER calibrated nozzle
This irrigation emitter is characterized by its capacity to withstand low quality waters (treated or partially treated WW) without being subject to the different forms of clogging normally occurring in such conditions. Any form of clogging is resulting in a rapid degradation of the quality or uniformity of water distribution, that may result in heterogeneous crop production, salinity build-up, local leaching of pollutants, local excess as well as insufficient water application. To prevent clogging, the discharge of each outlet is rather high in comparison to drip irrigation, thus requiring short irrigation episodes repeated several times to allow infiltration to happen in place of runoff. For this reason, an extremely careful definition of the schedule of water delivery is needed. The calibrated nozzle can operate at low pressure (around 0.5 bar), which limits the energy consumption.
For large irrigation systems the time required for filling all the pipes may be important in comparison to irrigation duration. Therefore, the nozzles can also be equipped with a device that prevents the distribution system to get empty when pressure decreases below a threshold of 0.5 bar.
This technology is mainly suitable for permanent crops. The calibrated nozzle creates/supplies a micro basin around each tree, and very short irrigation events are applied to prevent runoff and facilitate infiltration between two successive irrigation pulses. The calibrated nozzle can also be used for temporary crops, but the cost of the emitter for each hectare will be quite high, except if micro-basins can be created to facilitate a secondary distribution and infiltration, which results in extra staff costs.
In order to adapt the technology to a specific MENA country or basin, in the first place it is recommended to run preliminary tests in controlled conditions. This could take place in a laboratory or better in a farmer’s plot under the supervision of an extension structure’s staff: - Focus on 8-20 nozzles supplied with real treated WW ;
- WW is filtered with 1 mm aperture size;
- Discharge time schedule shall be consistent with future use; - Minimum duration 8 weeks;
16
- Observe the temporal trend of discharge flowrate in all the emitter on a daily basis (water-meter) and measure some emitters on a weekly basis, preferably those of the extremity of the line.
The second step will be the installation of the emitters in the field with careful monitoring for the first weeks:
- Checking of several emitters (at least 4 per block, always the same to identify trends, preferably one close to block inlet, the others close to the end of lines);
- Reading of the water-meters during the first weeks to observe if the discharged flowrate in each block of emitters remains steady;
- Performing pipe flushing on a weekly basis, frequency is modified from the observation of flushing effluent content;
- Performing a chemical cleaning (acid and chlorine) at least every season.
5.2.2 Adaptation of the MADFORWATER mini-sprinkler
This technology can be used to irrigate orchard trees under canopy in a configuration that prevents water contact with the consumable parts of the plant. MADFORWATER developed a low-cost mini-sprinkler, that minimizes pathogen risk dissemination due to aerosols issued from the smaller droplets and that resists to the potential clogging related to the use of treated wastewater. This micro-sprinkler, designed to manage the size of droplets produced to minimize the generation of small droplets, is intended to work at low operating pressure (< 2 bar). The droplet diameter varies between 0.5 mm and 2.5mm for more than 95% of the delivered volume: higher than 0.5 mm to avoid droplet drift because of wind and lower than 2.5 mm to avoid soil sealing due to droplet impaction. The control of the particle size distribution is achieved through the combination of nozzle size, operating pressure, defector’s canal shape and rotation velocity. Designing prototypes and optimizing the shape of this innovative sprinkler is an important part of this research. In terms of maintenance and water conditioning the objective to achieve is a long term operation with a coarse filtration of 0.500 mm.
In terms of cost, this technology is a non-complex plastic device, easy to build and costless. Its operating pressure is low thus its setting up will combine noncomplex infrastructure and easiness to use. In terms of environmental impact, the low operating pressure allows to reduce losses of water and to avoid large pumping (high energy demanding) stations.
MENA countries have in common a marked water scarcity and a high evaporative climate. The purpose of this technology is first to have the capability to reuse treated wastewater with minimum clogging risk, then to minimize the risk of pathogen dissemination under windy conditions by attaining a droplet size that restricts the potential drift. This, in turn, will decrease the potential evaporation.
This emitter is mainly designed for tree crops, including energy crops, provided the droplets produced don’t reach the fruits to avoid any direct contact with the effluent.
In field conditions, the micro-sprinkler was evaluated toward the capacity of distribution to withstand wind with minimum distortion. A shift of the distribution map was observed with acceptable distortion of the distribution. When installing such type of micro-sprinkler, a
17
verification in the field should be performed in normal operating conditions (pressure, height above ground, time in the day) to validate the adequacy of operating conditions.
Regarding the tolerance to water quality to keep good distribution performance, even if the technology evaluation was conducted with very bad effluent quality, a monitoring of operation in every new context is highly advised in the first months of use.
In order to adapt the technology to a specific MENA country or basin, in the first place it is recommended to run preliminary tests in controlled conditions. This could take place in a laboratory or better in a farmer’s plot under the supervision of an extension structure’s staff:
- Focus on 4 to 10 mini-sprinklers, supplied with real treated WW, if possible the one to be used further;
- WW is filtered with 1 mm aperture size;
- Discharge time schedule shall be consistent with future use; - Minimum duration of the preliminary evaluation 8 weeks;
- Observe the temporal trend of discharge flowrate in all the sprinklers on a daily basis (water-meter) and measure some sprinklers on a weekly basis, preferably those of the extremity of the line;
- Observe possible drift of smaller droplets depending on the time of application in the day, in case adapt the irrigation time.
The second step will be the installation in the field of the mini-sprinklers with careful monitoring of their operation during the first weeks:
- Checking of pressure at block inlet;
- Checking of several sprinklers (at least 4 per block, always the same to identify possible trends in discharge changes, preferably one close to block inlet, the others close to the end of lines);
- Or a reading of water-meters during the first weeks to observe if the discharged flowrate in each block of sprinklers remains steady;
- Observing possible drift during irrigation event, adapting time of application to reduce this potential losses;
- Performing pipe flushing on a weekly basis, frequency is modified from the observation of flushing effluent content;
- Performing a chemical cleaning (acid and chlorine) at least every season.
At least a monitoring of cumulated volume applied at each irrigation event along with pressure will comfort the steadiness of performance and allow detecting as early as possible any fouling process.
Regarding the tolerance to different climate conditions, the main issue is related to wind regime. If the area is subjected to relevant wind, irrigation should be planned during night or the beginning of the day to avoid windy periods.
18
5.2.3 Adaptation of the MADFORWATER gated pipe
Furrow irrigation can be used to irrigate many different crops, like vegetables and fruit trees, but it is most convenient for growing row crops (corn, sunflower, potato, soybean, wheat). Actually, it is suitable for all crops that would be damaged if water covered their stem or crown
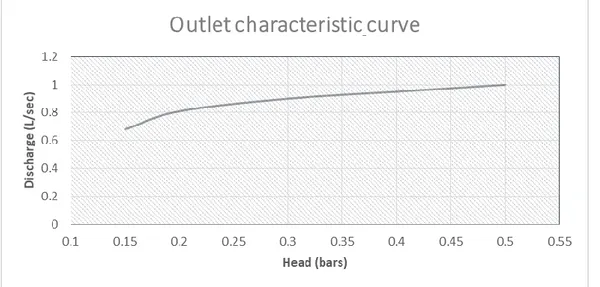
In the framework of the MADFORWATER project, a gated pipe with self-compensating nozzles was developed in order to minimize pressure variations and maintain constant the nozzle discharges within the operating range of 0.2 - 0.5 bar. Special rubber flow regulators were developed by the ROLLAND company, a member of the MADFORWATER consortium. The rating curve (discharge vs pressure) for this type of flow regulators were tested in the ROLLAND hydraulic laboratory.
Figure 5.15.1 reports the rating curve of the nozzle, while Figure 5.2 shows its shape and design. This nozzle maintains a stable discharge between 0.8-1 L/sec in a pressure range of 0.2-0.5 bars.
Figure 5.1 - Operating curve of the outlet of the gated pipe
19
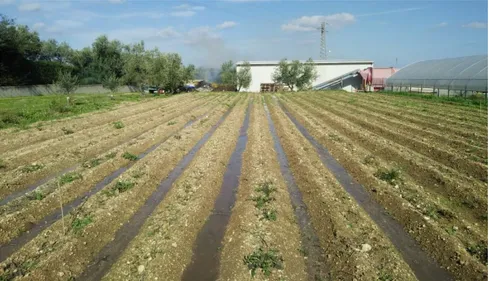
Field tests of a gated pipe equipped with 20 calibrated outlets were carried out in the experimental station of the CIHEAM Bari Institute (Figure 5.3). The furrow irrigation event was simulated using the WinSRFR open source software (Bautista et al. 2009). The root zone depth, the soil water content before the irrigation event, and the soil characteristics were measured and taken into account to assess the infiltrated depth, which resulted to be 25 mm.
Figure 5.3 – Field test of the gated pipe in the CIHEAM Bari experimental station
The Application Efficiency (AE) and the Distribution Uniformity (DU) were computed in the field (Clemmens and Solomon, 1997). Results showed that for a 30-minute irrigation time, 82% and 83% were achieved respectively for AE and DU. Therefore, with proper management, using modified gated pipe systems can significantly enhance the surface irrigation performance (El-Shafie et al, 2009). The modified gated pipes raised the performance, with respect to traditional furrow irrigation, by 11% for AE, 17% for DU, and it reduced the irrigation time by 30%. The proposed system is a very good alternative in regions characterized by seasonal water availability, rotational delivery schedules (high fixed discharges and short fixed durations), flat topography and traditional farmers legacy of surface irrigation, where low irrigation performance can mainly occur because of mismanagement rather than water scarcity. In addition to the proved enhancement in DU and AE at farm level, the system has a positive environmental impact by reducing drained polluted water due to application efficiency improvement. Such reduction of drainage water can range between 30% and 50%. Finally, social impact is expected to be positive as the irrigation time is reduced, the number of events per week can increase and, consequently, rotational intervals can be reduced and it is possible to better match the crop irrigation needs.
Surface irrigation is the most widely used irrigation system in the world and, in particular in Mediterranean countries. Therefore the calibrated gated pipe, as it guarantees a very high performance, fits perfectly in particular in Mediterranean countries like Egypt, Turkey, Syria, Jordan and Lebanon.
With regard to the adaptation and implementation of the gated pipe to contexts other than the Egyptian one in which it was implemented in MADFORWATER, the following elements should be considered:
20
- the gated pipe doesn’t have any preclusion to be used with treated wastewater and/or with brackish water, as the dimension of the nozzles is big enough to avoid any type of occlusion / clogging;
- the gated pipe can be easily used to irrigate several types of crops, such as corn, sunflower, potato, soybean, wheat.
- the type of climate doesn’t impact on the use of the gated pipe with calibrated nozzles, as the only constraints are related to the pressure and the discharge flowing into the pipe. In fact, they have to be adequate to guarantee the correct functioning of the system according to the operating curve in figure 5.1.
5.2.4 Adaptation of the use of plant growth promoting bacteria
In principle, the use of plant growth promoting bacteria (PGP) is suitable for every type of crop, including woody plants like Citrus and herbaceous species like wheat and other cereals. In the Madforwater project, PGP bacteria that naturally live associated to the root system of several plant species were selected and their beneficial effect on the same and/or other species was tested. Plant species used during the validation of the technology include tomato, wheat, rice, citrus, argan, mangrove.
Plant growth promoting (PGP) bacteria can be applied under different climatic conditions and generally (but not always, should be validated on a “case-by-case” principle) they can play their beneficial effect not only on the plant species of origin but also on different crops. The best procedure to select an effective PGP strain and/or consortium starts by isolating the candidate beneficial bacteria from the climatic context of interest (for example using plant grown under hot/dry climates or adapted to soil salinity, for the future application in MAC countries). Samples for isolation should be the root interior or the soil strictly surrounding the roots –called rhizosphere- in order to obtain microbial resources not foreigner to the soil/plant habitat.
The bacteria can be isolated from the root system and cultivated in the laboratory using specific growth medium: in this way a bacteria collection is established that represents the initial reservoir for subsequent screening of potential PGP activities. Firstly, the bacterial isolates are identified taxonomically using DNA-based technologies to exclude from further analyses pathogenic species that may play an adverse effect on the plant health, the environment and/or human safety. Secondly, the bacteria are screened in vitro for different activities which are related to the ability to promote plant growth. For example, one of the traits of interest is the capacity to solubilize nutrients like phosphate, which is usually present in soils in poorly bioavailable forms (biofertilization-related activity). Biostimulation traits are often screened in vitro measuring the capacity of bacteria to produce phytohormones that improve plant growth (e.g. auxins) or to degrade the precursor of ethylene, a stress related molecule in plants. Likewise, the ability to inhibit the growth of plant pathogens is of interest in the frame of biocontrol. Specific laboratory assays can be implemented according to the peculiar characteristic of the target area where the PGP strain/inoculum will be applied. For instance, it is possible to test the strains’ capacity to tolerate high salinity in the growth medium, extreme and fluctuating temperature values, etc. Once the results of the in vitro screening are available, a pool of the best performing bacteria can be picked out from the collection to proceed with the selection procedure. The following step consists to test in planta under greenhouse conditions the capacity of the strain/consortium to promote plant growth and productivity.
Greenhouse and field-scale tests aimed at evaluating the beneficial effect of the developed strain / consortium include a variety of aspects that can change according to the
21
target plant species. To check the bacterial effect on plant growth, the test duration will be shorter (e.g. few weeks for tomato plants) compared to tests aimed at demonstrating the ability of the strain/consortium to improve plant productivity (up to three months for tomato plants). The irrigation schedule must be adapted to the type of plant and the specific environmental conditions at which the greenhouse is operating. The experiments have to be planned including the maximum number of replicates that is possible to manage (never less than 5 plants; at least 10 plant specimens should be used to test each strain / consortium) and a randomized-block scheme should be adopted to arrange the pots in the greenhouse and or the plant treated using different strains / consortia in the field, in order to minimize the influence of differential environmental parameters that could affect the plant growth. The single strain or a consortium of different strains can be inoculated by seed priming (the seeds and a bacterial suspension are put in contact before sowing) or through irrigation. In the latter case the strain/consortium have to be provided closely to the root system. The plant parameters to be monitored include physiological parameters (e.g. leaf photosynthesis, stomatal conductance and transpiration rate) and growth parameters (e.g. root and shoot length, fresh and dry root and shoot weight). To assess crop production it is necessary to include also the evaluation of the number of fruits or bunches, fruit size and weight. The results have to be collected and stored in electronic form, and statistical analyses such as Student t-test and ANOVA have to be applied to discriminate the significance of the possibly observed promotion effects mediated by strain /consortium in comparison to the negative (non bacterized) control plants.
The statistic tests performed on the results of greenhouse experiments must demonstrate that the plants inoculated with the developed strain / consortium show significantly different values ( in terms of plant growth and/or fruit production) compared to the negative (non bacterized) control plants.
To implement this type of technology it is important to consider the specific legislation of each country about the use of bacteria in the field. In the case of crops cultivated for food production there could be relevant limitations on the use of bacteria, even though they play a demonstrated beneficial effect. For example, in Tunisia it is not possible to administer PGP bacteria to herbaceous plants consumed raw like tomato, while their use is allowed for cereals used for grain production,n like wheat.
5.2.5 Adaptation of the model for optimal irrigation with treated wastewater (SIM)
The Safe Irrigation Model (SIM) is a user-friendly software package that runs with every type of computer having a microprocessor at 64 bits. It is a daily bucket model aiming at assessing crop water and nutrient requirement by using freshwater, treated wastewater or mixtures of different types of water. SIM is well adapted to several fruit crops (e.g. tomato, potato) and field crops (e.g. wheat, maize).
The model is adapted to various types of irrigation systems, water of different qualities, different soil types and crop varieties. In the case of treated wastewater, two main parameters are taken into account: i) water salinity and ii) concentration of E. coli. The model thus allows to assess and control microbial risk. SIM is also capable to simulate the annual effects of irrigation on the physical properties of soil and on crop yield.
22
Figure 5.4 - Safe Irrigation Management (SIM) modules
The SIM model is designed to support farmers and decision makers in the identification of the optimal water allocation, timing and management options, including the selection of the optimal water mix. The ability of the model to predict future conditions is very useful for projecting the outcomes of various possible irrigation management strategies. It can be used on a weekly base but, if needed, it could also be used on a daily base.
The input data to be used in the model are: a) daily weather and rainfall data, and b) field characteristics. In particular:
a) Daily weather data allow to calculate reference evapotranspiration. The Penman-Monteith equation has been used (Doorenbos and Pruitt, 1977). This model was preferred because widely tested in the Mediterranean environment (Allen et al., 1989; Allen et al., 1994a and 1994b). The daily temperature (min and max), relative humidity (min and max), solar radiation, wind speed and rainfall have to be collected from a meteorological station close to the area to be irrigated. Crop coefficients are used to compute crop evapotranspiration. The crop coefficients for different crop growth stages have to be taken from published data and from field experimental data.
b) The seeding date depends on the crop and, for the same crop, on the farmer's decision. When perennial crops are considered, instead of the seeding date the blooming date is considered. The initial available soil water reserve at beginning of the irrigation season has to be associated to each crop. The rate of root growth with time, variable crop by crop, is approximated as a linear increase from day 1 to day x (depending on the crop), and as a constant value from day x+1 to the end of the crop development cycle.
The SIM model is being applied in the Souss-Massa basin in Morocco, to optimize irrigation scheduling and salt balance of specific crops using different qualities of water. Figure 5.5 shows a typical irrigation scheduling. According to the water balance results, SIM provides the amount
23
of water to be supplied to the crops and the timing, also in relation to the type of water used (treated WW or fresh water). It provides the volume of water that can be applied as: i) fixed amount of water (mm); ii) return to fixed soil moisture deficit (mm); iii) return to fixed soil moisture depletion (% of the soil water holding capacity).
Figure 5.5 – Example of an irrigation schedule obtained from the SIM model
The SIM model, developed in the framework of the MADFORWATER project, has been deposited in the AMS Acta repository of the University of Bologna, together with the user manual, at the following link:
http://doi.org/10.6092/unibo/amsacta/6495
It is therefore freely accessible to any interested stakeholder.
The specific challenges relative to the application of this technology with treated WW in MENA countries are the following:
• difficulties can be found in obtaining the data required to calibrate and operate the model for in a given context (crop data, meteo data, soil characteristics, soil hydrological parameters);
• there can be national or regional restrictions relative to the use of wastewater for irrigation;
• the application of SIM is challenging in countries where water is applied with a fixed rigid rotational delivery schedule, as in the case of Egypt.
24
6
Guideline for the adaptation of the decision support tool for wastewater
management
6.1 Goals of this guideline
The intention of this guideline is to inform interested users about the decision-support tool (DST) “Poseidon 2.0”. Poseidon 2.0 is an Excel-Tool to be applied for pre-feasibility case studies with potential for water reuse. It can be used to assess possible technological water reuse options and can show decision makers and other stakeholders which implementable solutions are available to comply with local requirements. The open access DST and its corresponding handbook are freely available on the Zenodo Repository3.
6.2 Guideline description
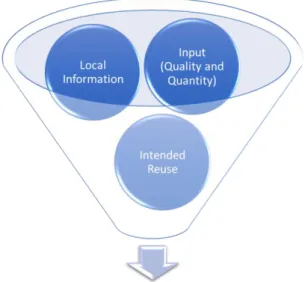
Poseidon 2.0 is a user-oriented, simple and efficient Excel-Tool. It compares different wastewater treatment techniques, considering their removal efficiencies, their lifecycle treatment costs, and additional assessment criteria. From the different wastewater treatment techniques, the background of the different technologies related to water reuse and the underlying theory are explained. The additional assessment criteria include national thematic subjects related to water reuse in the form of a multi-criteria analysis called PESTLE (political, economic, social, technological, legal and environmental). These indicators collectively provide an indicative general understanding of the current situation of water reuse in selected countries. Poseidon 2.0’s scope is a pre- feasibility study before more detailed investigation in order to assess possible water-reuse options. The results show decision makers and other stakeholders which implementable solutions are available which comply with local requirements, as shown in Figure 6.1.
Figure 6.1: Principles of Poseidon 2.0
3 Oertlé, Emmanuel. (2020). Poseidon 2.0 - Decision Support Tool for Water Reuse (Microsoft Excel) and Handbook (Version 2.0) [Data set]. Zenodo. http://doi.org/10.5281/zenodo.3755380
25
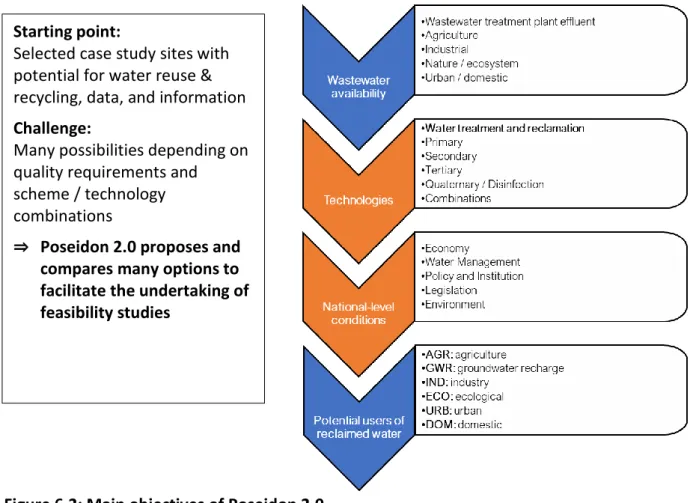
In Poseidon 2.0, the user is guided through all necessary steps to obtain first indicative results for a case-specific water treatment strategy. Figure 6.2 describes the main objectives and steps of Poseidon 2.0 to analyse which treatment trains would comply with the user’s own situation.
The tool’s general steps are shortly described in the following section:
(1) “Welcome” is the first sheet of the Excel-Tool, where the user can find a first structural timeline overview. There are two fields to be filled out, (a) your country of origin and (b) the currency to be applied for cost purposes.
(2) “Learn” about Poseidon 2.0 by using a dropdown list. The essential definitions and terms about wastewater treatment and reuse are provided in this section. The user will find a selection of different questions about the tool and some abbreviations one might not be
Starting point:
Selected case study sites with potential for water reuse & recycling, data, and information
Challenge:
Many possibilities depending on quality requirements and
scheme / technology combinations
⇒ Poseidon 2.0 proposes and
compares many options to facilitate the undertaking of feasibility studies
26
familiar with. By selecting one of the questions, the tool will automatically give the answer in form of a picture or chart, together with a short description.
(3) “Input parameters”. The Excel Tool consists of two data input sheets, where the user can enter case-specific relevant data. Table 6.1 summarizes the input data that can be entered.
Table 6.1: Input parameters required in Poseidon 2.0
Entry data sheet Data entry / selection
Water Quality – Inflow Selection of a water inflow quality according to Poseidon 2.0 proposed water quality class catalogue from several references (USEPA, WHO, national regulations, etc.). Alternatively, the user can also enter own water inflow parameter to adapt them to local conditions.
Water Quantity – Inflow Selection of the wastewater inflow quantity. The user has to choose one of the following three wastewater inflow quantity options:
(a) Peak flow [m3/h]
(b) Average flow [m3/d]
(c) Serviced population [people]
Water treatment cost entry The cost data used were compiled from various sources. These only represent country-specific average values. You are therefore given the opportunity to personalize the costs, since local costs can vary greatly depending on the site.
(4) The Excel-Tool is versatile and can be used for up to three different end-uses. The only required data regarding the water quality outflow are reported in Table 6.2.
Table 6.2: Output parameter specification in Poseidon 2.0
Entry data sheet Data entry / selection
WQ – Outflow Model personalization: The user can specify up to three different
end-uses.
WQ – Outflow Selection of the water outflow quality for each end-user and the corresponding water quality class (regulation) to be applied.
WQ – Outflow Specifying the price at which the reused water can be sold to the intended end-user (water tariff).
D&S costs (distribution and storage)
The user can define the specific quantity to be delivered to each end-user.
D&S costs The user can specify the length of the pipes required and the elevation to calculate the pumping costs.
D&S costs Additionally, the user can specify the need of a water or wastewater
storage facility.
Weighting parameters This sheet is intended to give the users the opportunity to not only include treatment trains identified only based on meeting quality requirements of available reuse applications. The user has the possibility to add qualitative options adapted to local environmental, economic,
and social conditions by assigning weights to predefined evaluation
27
Based on the input data, the Excel-Tool will calculate the performance, cost, and other assessment criteria for all the treatment trains included in the system and proposes three top-ranked options according to a varied selection and assessment methods.
(5) Finally, the user either selects the three top-ranked solutions based on the treatment costs or the three top-ranked solutions based on the weights assigned in the “weighting parameters” sheet. The displayed “result sheets” are then divided in two sections. The first section on the left side covers the following:
1. The data input is recapitulated (input quality and quantity, output quality, and distribution)
2. The three top-ranked wastewater treatment technology options that comply with the desired outflow quality are displayed in three colors (red, blue, green). For each option, the name of the treatment train is displayed. The additional information on the treatment trains and the process units included can be accessed through the two grey buttons below the three options.
3. If a user wants to compare the three top-ranked options, it can be done right next to the three top-ranked options. A treatment train can be selected from the dropdown list to see the cost figures attributed to the selected treatment train. 4. In addition, some results are presented in an additional sheet that can be
accessed by selecting the red button below the three options.
5. The overall score results of the three best-ranked options are presented in a table form at the bottom of the sheet. The user can access them by selecting the grey button.
The second section on the right side covers the PESTLE results. The following results are displayed:
1. In this step the user sees the results from the PESTLE analysis (political, economic, social, water management, legislation, and environment) that covered national thematic subjects related to water reuse. These were developed for the MADFORWATER project countries: Egypt, Tunisia, and Morocco. Therefore, the results are an indication of national-level conditions if the user ‘s case is from a similar country. On the left side the thematic subjects are depicted, followed by key questions. These are underpinned by (semi)quantitative indicators. On the very right side are the results displayed, which were normalized to a scoring between 1 (orange; lower ranked), 2 (yellow; moderate ranked), and 3 (green; higher ranked). The detailed results were aggregated to provide an overall statement of each thematic subject. More details about the methodology used to derive these results are described in the MADFORWATER deliverable D5.2, accessible from the project’s website (
https://www.madforwater.eu/public-documents/).
2. In addition, a red button at the very right top takes the user to the detailed calculations of the PESTLE analysis.
(6) The very last sheet of the Excel-Tool figures as a “summary” sheet of all scenarios considered, including the treatment trains suggested, the costs attributed to the proposed treatment trains, and suggested measures according to the PESTLE analysis.
28
6.3 Specific aspects to be considered in the application of the decision support tool for wastewater management to a MENA country
The first version of Poseidon has been developed for the Latin-American context. Poseidon 2.0 has been adapted to the national cases of Egypt, Morocco and Tunisia by adding local information and specific analysis, especially for the second section covering the PESTLE analysis. This shows that the tool can be effectively adapted to another region or to another country of the same region.
Regarding Poseidon 2.0, that can be openly accessed, it can be noted that the first section of the tool (technology selection) could directly be applied to a new MENA country if some local and national data are collected beforehand. For the second section (PESTLE analysis), more data would be required, and a new version of the tool should be developed.
If one would like to make use of the first section of the tool (technology selection), the following data would be necessary:
1. wastewater quality parameters;
2. quality parameters to comply with for the intended reuse (from a national regulation); 3. local data regarding electricity cost, labor cost, land cost and discount rate.
The experience showed that the tool is user-friendly and can easily be understood by a wide range of potential users. Nevertheless, for a vast replication in the MENA region, it would be advisable to offer a multi-lingual version including the Arabic language. Possible training packages outlined in chapter 7 would also complement a smooth regional dissemination.
29
7
Training package to allow potential users to adapt the decision support tool
for wastewater treatment to other basins or countries
The intention of this training package is to enable the adaptability of the Poseidon 2.0 decision support tool (DST) to other basins or countries. This enables a wider application and use in other basins or countries. For this, required skills of the attendees before and after the course were identified. This is completed by articulating the different course modules.
7.1 Skills that the attendees need to have before attending the course
In Table 7.1 the required skills before the course were identified. The DST consist of three parts, the technology identification, the simulation of lifecycle costs and the assessment of additional conditions for water reuse.
Table 7.1: Required skills before the course on the Poseidon 2.0 DST
DST section Required skills before the course
Technology identification - Understand technological contexts
- Basic knowledge related to wastewater treatment - Basic knowledge of water quality parameters Simulation of lifecycle
costs
- Understand technological contexts
- Basic knowledge related to wastewater treatment - Basic economic knowledge of cost calculations Assessment of additional
conditions
- Understand technological contexts
- Basic knowledge of different possible sustainability definitions - Basic knowledge of sustainable projects and their evaluation - Basic knowledge related to the use of indicators for a
sustainability evaluation
7.2 Skills that the attendees will develop thanks to the course
In Table 7.2 the developed skills after the course were identified. The DST consist of three parts, the technology identification, the simulation of lifecycle costs and the assessment of additional conditions for water reuse. The participants will be requested to research and gather locally relevant data before the course.
Table 7.2: Developed skills after the course on the Poseidon 2.0 DST
DST section Developed skills after the course
Technology identification - Understand different type wastewater treatment trains and their technological components
- Understand different legislative parameters Simulation of lifecycle
costs
- Understand the relationship if technology and its lifecycle costing
- Can simulate lifecycle costing Assessment of additional
conditions
- Understand the variety of different indicators - Understand the country specific indicators
- Understand and obtained the basic knowledge to establish ranking
30
7.3 Articulation of the course into modules
In Table 7.3 the articulation of the course in different modules is provided. The modules consist of three parts that correspond to the DST sections, the technology identification, the simulation of lifecycle costs and the assessment of additional conditions for water reuse.
Table 7.3: articulation of the course on Poseidon 2.0 in different modules
Module section Articulation of the course into modules
Technology identification Learning Outcome
- Understand different types of wastewater treatment trains and their technological components
- Understand different legislative parameters
Content
- The teaching involves first a presentation of the tool.
- Then the teaching will involve discussions among the attendees with an exercise and a case study from the participants’ own region.
- Following, the participants will individually select the indicators for their basin or countries, calculate them and if required develop an adapted weighting and ranking.
Duration
- The duration of this module is 1h with a break in between.
Teaching tools
- The teaching will be conducted remotely with the online software Webex.
- The teaching involves the use of the Poseidon 2.0. Simulation of lifecycle
costs
Learning Outcome
- Understand the relationship if technology and its lifecycle costing
- Can simulate lifecycle costing
Content
- The teaching involves first a presentation of the tool.
- Then the teaching will involve discussions among the attendees with ideally a case study from their daily life.
- Following, the participants will individual select the indicators for their basin or countries, calculate them and if required develop a ranking.
Duration
- The duration of this module is 2h30 with a break in between.
Teaching tools
- The teaching will be conducted remotely with the online software Webex.
- The teaching involves the use of the Poseidon 2.0. Assessment of additional
conditions
Learning Outcome
- Understand the variety of different indicators - Understand the country specific indicators
- Understand and obtain the basic knowledge to establish ranking
Content
31
Module section Articulation of the course into modules
- Then the teaching will involve discussions among the attendees with ideally a case study from their own choice.
- Following, the participants will individual select the indicators for their basin or countries, calculate them and if required develop a ranking.
Duration
- The duration of this module is 1h with a break in between.
Teaching tools
- The teaching will be conducted remotely with the online software Webex.