A 3D social platform for the Paths of Via Regina
M. A. Brovelli, G. Zamboni *Politecnico di Milano, DICA, Laboratorio di Geomatica, Como Campus, via Valleggio 11, 22100 Como, Italy [email protected], [email protected]
Commission IV, WG IV/5
KEY WORDS: GIS, Mobile, Three-dimensional, Virtual globe, Web based, Volunteered Geographic Information ABSTRACT:
GeoWeb 2.0, the geographic extension of Web 2.0, has opened new possibilities in terms of online dissemination and sharing of geospatial contents, thus laying the foundations for a fruitful development of Volunteered Geographic Information (VGI) systems. At the same time the technological evolution and the availability of ever more efficient devices has allowed the usability of the third dimension even for the cartographic viewers, changing the way people approach to geographic information on the Web. Unlike the traditional 2D-visualization typical of the classic Web Geographic Information Systems (Web-GISs), the multi-dimensional viewers, of which virtual globes are the main examples, offer fully-realistic content visualization which allows for a much richer user experience. In this paper a 3D Web application based on the NASA World Wind virtual globe which aims at the enhancement of the foot paths on the hilly cross-border area between Italy and Switzerland is presented.
* Corresponding author
1. INTRODUCTION
“The Paths of Via Regina” is an INTERREG project (Cross-border Cooperation Operational Programme Italy – Switzerland 2007-2013) developed thanks to the synergy between Swiss and Italian geomatics engineers and experts in cultural heritage, landscape designers, local administrations and associations. It aims at rediscovering the common European cultural identity in terms of the naturalistic, artistic and cultural heritage.
Knowledge and protection of the territory can be promoted and disseminated through geoportals that let you navigate the places from traditional computer or via mobile devices.
The new possibilities of multi-dimensional view enrich the perception of immersion in the territory providing a much richer experience to the virtual travellers. Moreover the new participatory concepts allow visitors to easily add relevant contents (photos, documents, travel notes), which become heritage of the whole community.
Starting from these assumptions, a multi-dimensional participatory platform for the enhancement of the paths of Via Regina was developed using the NASA World Wind Virtual Globe and the new Volunteered Geographic Information (VGI) technologies. All the components are based on Free and Open Source Software (FOSS) both for the client and the server side.
2. THE PATHS OF VIA REGINA PROJECT 2.1 Historical background
Central to the project is Via Regina, i.e. the road overlooking the West coast of Como Lake and defining a system of soft mobility paths across the mountainous, cross-border region between Italy and Switzerland.
These paths represents a dense network of ancient and historical, geographical and cultural relations with the transalpine world that deeply marked the character of this area
of the lake since Roman times in a territory that is the hinge, the pivotal point between mountains, lakes and plains.
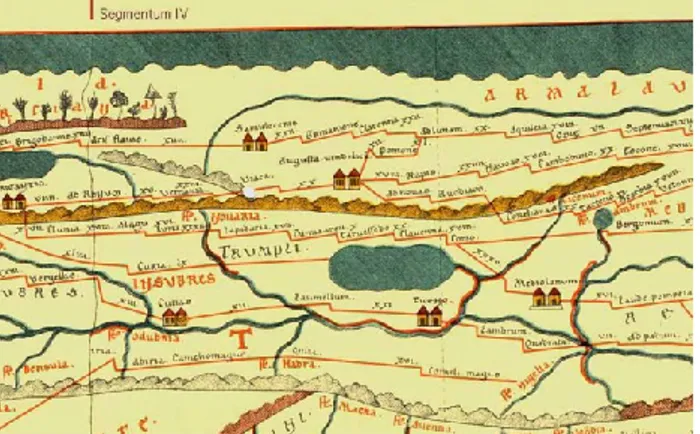
The first map depicting Via Regina, from which its historical importance can be deciphered, is the Peutinger Map, whose origin dates back to the fourth or early-fifth century. In Figure 1 a detail of this map is shown, where Via Regina is drawn as a red stepped line.
Figure 1. Detail of the Peutinger Map, in which Via Regina is represented as a stepped red line North of the lake In Roman times, the longitudinal way on the north-south route of the lake assumed increasing importance with the expansion to the north of the achievements and boundaries. Base point and a sign of this new importance was certainly the new urban settlement of Comum, built on the shores of the current Como Lake. At first the main passage was formed by the natural lake route and then, from the imperial age, by land route of the western shore, only much later called Via Regina ('Royal Road'), a main public street documented for the first time with this name in 1187.
The interest of Rome for the central Alpine passes grew significantly when, at the end of the third century, Milan became the capital and consequently Como became the outpost of the empire toward Raetia. But by the mid-sixteenth century the passage of Milan to Spain and then to Austria marked the gradual move of large trades on the ground to the eastern shore of Como Lake (also called Lario Lake), by virtue of the need for faster connections between the Habsburg Empire and Milan. The "Lario system" of the west shore, which had so marked the history of the lands of Como Lake and the entire country, finally became secondary, passing the baton to the axis Lecco-Colico. Over the last century the Via Regina became unrecognisable due to uncontrolled urban development; its history, its potential and even the qualities that it still preserves have been largely disregarded. However, it is part of a historical, geographical, cultural, environmental and urban planning, which deserves to be rediscovered, restored and protected.
2.2 The project for the enhancement of the paths
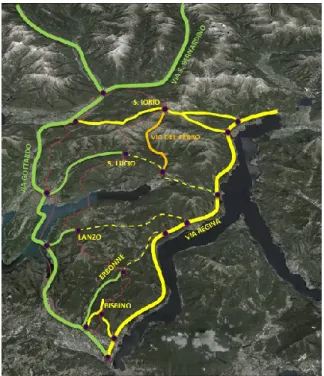
Today Via Regina, from Como to Sorico, is one of the oldest trade routes of the historical, commercial and cultural cooperation between Italy and the transalpine area. It's a beautiful cultural hiking trail and, with Via Francisca and Italian-Swiss Via Spluga, which is a continuum, it's a fundamental "system" of the transalpine soft mobility (see Figure 2).
Over the last century, the Via Regina was progressively segmented and degraded in the track due to urban sprawl and the lack of adequate planning on a regional scale that would ensure continuity and integrity of the routes. The potential and even the qualities that it still preserves have been largely disregarded by citizens.
Figure 2. The area covered by the Via Regina project The project "The Paths of Via Regina" intends to enhance and strengthen the identity of these territories through the preservation and promotion of the cultural heritage shared between Italy and Switzerland. The knowledge and the use of the area will be facilitated by a WebGIS participatory systems
that allows tourists and local inhabitants to develop interactive maps online.
One of the fundamental aspects of the project is the dissemination of knowledge, the protection of the territory and the promotion of tourism through the use of geoinformatic technologies. In the age of Web 2.0, where the networks allow anyone to participate in the creation and sharing of content, continuous development have also opened a new phase in this domain. Thanks to the use of mobile devices, the visitors of the paths becomes an integral part of the project and will be able to easily add relevant contents like photos, documents, travel notes, etc, which will become the heritage of the whole community, integrating tourist-hiking maps, paper guides and widespread signage.
The project aims precisely at creating the appropriate web-based instrument for the full enhancement of this important route and the surrounding area in order to trigger a virtuous process of redefinition and re-routes to reactivate and make full use of the potential of the territorial system.
Several Free and Open Source for Geospatial (FOSS4G) applications have been developed in the frame of the project, which address different users and feature different functionalities. The applications include: a mobile app allowing tourists to report Points of Interest (POIs) along the paths; a mobile app enabling professionals to survey new paths; a traditional 2D Web viewer providing access to and interaction with the project data; an application offering a virtual tour along the paths; and 3D viewer based on a virtual-globe, with participative functionalities.
In the next section, after a short introduction on VGI, an excursus on the technology used to implement the 3D application (i.e. the 3D social platform) is provided.
3. VGI SYSTEMS AND VIRTUAL GLOBES 3.1 Volunteered Geographic Information Systems
The first Web technologies used for geographical purpose was characterized by the same limitation of the whole Web 1.0, i.e. a poor interaction making user experience not specially pleasurable (Haklay et al., 2008). In this first stage, geospatial information was supplied by public mapping agencies according to a top-down, authoritarian paradigm (Goodchild, 2007b). The tremendous shift brought by Web 2.0 (O’Reilly, 2005) allowed the development of rich Web applications, which became more and more similar to the traditional desktop ones (Graham, 2005) by enhancing user interaction.
The new, bi-directional approach gave people no longer a mere data access, but the chance to also generate and share contents, e.g. into blogs, wikis and social networks. The corresponding change of the Internet mapping tools caused by GeoWeb 2.0 (Maguire, 2007) was indeed introduced at the end of last century by the work of the Open Geospatial Consortium (OGC), which began to establish standards for Web mapping interoperability (Peng & Tsou, 2003). One of the strongest shifts brought by GeoWeb 2.0 took place in the field of technologies, where Application Programming Interfaces (APIs) transformed Web mapping applications from static, complex and restricted to a small public, to dynamic, easy to use and accessible also to non-experts. The term Volunteered Geographic Information (Goodchild, 2007a), which expresses the geospatial application of the more general phenomenon of crowdsourcing (Howe, 2006), has been the major result of GeoWeb 2.0 and neogeography (Turner, 2006). It fully represents the concept of humans as sensors able to register geographic information from the ground. This possibility has
exceptionally grown thanks to the huge variety of sensors installed on current mobile devices. As a consequence of all the factors discussed up to now, VGI systems have been evolving into Web-based, shared platforms allowing users to dynamically add and edit their own contents and create customized mash-ups. A class of VGI activities which require special attention and analysis is the so-called citizen science, defined as the set of scientific activities in which non-professional scientists voluntarily participate in data collection, analysis and dissemination of a scientific project (Cohn, 2008; Silvertown, 2009).
3.2 The Open Data Kit suite
The geospatial data of the Via Regina project can be differentiated into two categories: those derived from official sources and those uploaded or collected by users. The former mainly consist of administrative data and field surveys of the paths and the points of interest (POIs) along them. Surveys were performed by cultural associations involved in the project, which produced data compliant with the minimal defined model (shared between Italian and Swiss partners). The second kind of data is instead a result of user participation, which happens through a mobile application (for smartphone, tablet, etc.) which allows users to report interesting elements (e.g. historical/cultural points of interest, morphological elements, tourism services and even dangers) they come across during the slow travel experience.
In order to implement a VGI system and allow users to take advantage of their mobile devices to report significant Point of Interests (POIs), the Open Data Kit (ODK http://opendatakit.org) suite was used.
The ODK suite is composed of three modules providing complementary functions, i.e. ODK Build, ODK Aggregate and ODK Collect. ODK Build module allows developers to design the form (i.e. the questionnaire) that users will then compile on the field. The form template is subsequently loaded into ODK Aggregate, which works on an Apache Tomcat server (http://tomcat.apache.org) backed with a PostgreSQL database (http://www.postgresql.org). ODK Aggregate is the server-side component of ODK suite and it is also responsible for user administration. It provides blank forms to, and accepts compiled forms from ODK Collect, which is the suite client-side component and runs on Android mobile devices.
Finally, an extension to the system architecture could be represented by the integration between ODK Aggregate and the Enketo Web framework (https://enketo.org), which allows users to fill and send forms through a simple browser (e.g. from a desktop computer). In this way, the range of potential users of the system could be extended also to those not equipped with an Android device (i.e. people using a different mobile operating system and people who do not even own a mobile device) as well as those equipped with an Android device but unfamiliar with this technology.
3.3 Virtual globes
Thanks to virtual globes, the three-dimensional access to geospatial information has gained interest in recent years, allowing users to explore the Earth in 3D while streaming satellite imagery, elevation and other data from the Internet (Schultz et al., 2008). Though virtual globes have increasingly evolved from simple viewers to applications aimed at a pool of complex scientific purposes (Brovelli & Zamboni, 2012), literature does not provide examples of 3D VGI platforms built using virtual globes technology.
Virtual globes can be considered as purpose and multi-dimensional geographic environments, not only 3D but also 4D if the temporal dimension is considered (Brovelli et al., 2012a; Brovelli et al., 2012b). They can represent any geo-localizable data in a nearly infinite range of scales, allowing users to freely move around the globe by dynamically changing the point of view and to interact with the information represented on the surface (Elvidge & Tuttle, 2008). Using a virtual globe it is possible for instance to show a spatial distribution of an environmental variable (e.g. temperature, pressure and concentration of a pollutant) around the entire Earth, and zoom into the city streets to show the detailed structure of an urban setting (e.g. position of environmental monitoring stations, 3D representation of polluting factories and related technological networks).
Virtual globes are excellent tools that extend the expressive power through a conceptual representation of GIS data in a more realistic and intuitive medium. At the same time, ease of access and use of these tools allows us to share and communicate information, which was formerly “restricted” to only users of highly specialized software tools, and often accessible only in highly specific scientific environments. The number of ready-to-use virtual globes and active projects focused on the development of virtual globe-based technology is continuously increasing, due to the large benefits they bring for multi-disciplinary use in both the scientific and business sectors (Brovelli et al., 2013).
Since many 3D virtual globes are available, their properties must be carefully evaluated in order to select the most appropriate for the given specific needs. The first main feature to take in account is the platform required to run on. Some of them requires a specific operating system; others can be installed on diverse platforms due to the availability of releases for each operating system; and still others are platform-independent due to the development technology used.
The second feature is the license type. Some of them are available as free and open source software, while others are “closed” (code not available for the public) and released with proprietary licenses. Some of the latter require the purchase of a license while others are available both with a freeware license or a paid license depending on the featured capabilities. The third feature to be considered is the type of application: some are desktop applications and require just a local installation, others are pure Web applications, and still others can be executed either by installing the application or directly as a Web application using specific browser plugins.
Another important feature to take into account is the possibility of content customization. Some virtual globes need to interact with specific proprietary data servers, while others are able to read and display standard data formats used to transmit geographic data over the network (e.g. the OGC KML/KMZ file format and the WMS/WFS/WCS protocols) and superimpose specific layers both in raster format (images and thematic maps) and vector format (placemarks, callouts, 2D and 3D geometries, etc.). And last but not least, an important feature to be considered for virtual globes is the set of functionalities provided and the possibility to add new ones in order to customize the platform itself.
Usually virtual globes provide basic tools to visualize, integrate, communicate and disseminate geographic data. For this reason classical navigation functionalities are available (zoom-in, zoom-out, pan, rotate, dynamically navigation changing of the point of view, switch on/off of the layers, etc.). Typically, other tools like geometric measurement (position, distance, area, etc.), road route computation, geocoding and reverse geocoding are already integrated. In order to customize the virtual globe, two
different approaches can be adopted according to the tools provided to the developers. The first one is to use high-level programming interfaces made available from the virtual globes through external Application Programming Interfaces (APIs). This approach does not require very high programming skills and it is the only usable method with proprietary virtual globes, where the engine-core is visible only as a “black box”. External APIs enable, with a scripting approach, the ability to programmatically interact with the features showed on the globe, i.e. draw and move geometries, drape images over the terrain, add 3D models, allowing one to build custom 3D map applications. The second approach is to take advantage of the availability of the source code when the virtual globes are released with free and open source license. Having a full control of the application makes it possible to both improve the basic functionalities of the engine-core and to build new plugins for specific purposes. The great advantage of this approach is the possibility of implementing complex analytical functionalities (not achievable using an external API) and of combining the power of 3D visualization with the computational power of the typical GIS functionalities inside a unique multi-dimensional geographic platform.
3.4 NASA World Wind
In order to implement a realistic 3d scenario for the visualization of the Via Regina contest, the NASA World Wind virtual globe (http://goworldwind.org) was chosen. The first feature taken into account was the open source nature of the software and the consequent high degree of customization. Moreover, the goal was to implement a platform-independent viewer directly executable on different operating systems and potentially accessible by a simple Web browser. These two features, and the need for a tool that can provide accurate data customization (local high resolution aerial imagery and digital elevation models) made NASA World Wind a good and viable solution.
World Wind is NASA’s open source virtual globe technology, providing the infrastructure for spatial data as a Software Development Kit (SDK). It is based on open standards and can be configured to accommodate any desired data format. The characteristic of being written in Java makes it platform-independent (software directly executable on different operating systems) and usable like desktop application or accessible by simple Web browsers (as an applet or via Java Web Start technology).
The openness of the code allows the complete control of both the customization and the extensions required for creating the 3D model and all the functionalities needed for interacting with the model itself. NASA World Wind allows developers to implement and constantly improve functionalities (analytical tools) in order to deal with changing needs and to increase sophistication of the analysis. Improvements can be carried out directly on the platform engine core or by developing new plugins that extend the basic functionalities; in both cases it is possible to integrate directly into the virtual globe advanced functionalities typically delegated to sophisticated GIS. NASA World Wind was conceived to work with large quantities of data and information, all of which can be stored on local disk or on remote data servers. The platform makes available a collection of pre-configured classes which project spatial data on a 3D virtual globe of the Earth. This virtual Earth is composed of many satellite images: BlueMarble (BMNG 500m), i3-Landsat (15m), USGS Orthophoto (1m US only), USGS Urban Area Orthophoto (0.5 - 0.25m selected US city), MS Virtual Earth Aerial Imagery, etc. Some available
digital elevation models are SRTM30Plus (30 arc-sec, ~900m), SRTM3 v2 v4.1 (3 arc-sec, ~90m), ASTER (~30m), USGS NED (~30m, ~10m US only), which are dynamically served by NASA and USGS WMSs (Web Mapping Services). Moreover, it is possible to access any OGC-compliant WMS server providing geo-referenced images and maps to be projected on the globe (code implementation is also made available by NASA) and the digital elevation models to be superimposed onto the geoid model which is implemented within the platform. Finally, besides imagery and elevation data, it is possible to accurately locate on the NASA World Wind virtual globe and in its surrounding space both 2D objects such as lines, polygons, markers, callouts and multimedia viewers, and 3D objects built up from geometric primitives such as parallelepipeds, spheres and extruded polygons. The complete freedom of custom- izing the presented data makes the platform suitable for any spatial data application, thanks to the possibility of controlling the quality and accuracy of both the horizontal component (by varying the texture) and the vertical component (by varying the digital elevation model).
4. VIAREGINA2.0: THE 3D SOCIAL PLATFORM 4.1 System architecture
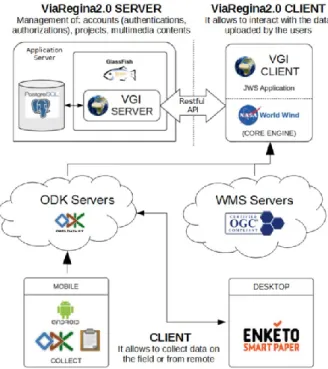
This section offers a technical overview of ViaRegina2.0, the 3D VGI platform developed through the integration of a VGI system based on ODK servers, OGC compliant WMS servers and a Virtual Globe. The architecture of ViaRegina2.0 is shown in Figure 3.
Figure 3. System architecture of ViaRegina2.0 platform The platform architecture consists of two principal components: the ViaRegina2.0 client and the ViaRegina2.0 server. The former, available as a Java Web Start (JWS) Application, is based on the NASA World Wind Java core and developed taking advantage of the NASA World Wind SDK. It provides a 3D visualization of the available geospatial contents and it interacts with the ViaRegina2.0 server through a Restful Web Service Protocol. The server is deployed on a J2EE application
server (i.e. GlassFish, https://glassfish.java.net) backed with a relational database (i.e. PostgreSQL, http://www.postgresql.org) to store all the data relative to the platform (i.e. system data and data uploaded by the users). The ViaRegina2.0 client can search and retrieve data from any WMS and ODK server, thus allowing to visualize and interact on the globe even with contents created through ODK Collect mobile clients or Enketo desktop clients.
4.2 Main functionalities
The 3D viewer allows users to interact with two different kind of geodata related to the Via Regina project.
A first level of information is provided by the paths map superimposed to different base layers such as OpenStreetMap, the aerial orthophotos and the satellite imagery provided, as standard geoservices, by the geoportals of institutional administrations (e.g. INSPIRE Geoportal, Italian National Geoportal, Lombardy Region Geoportal, Swisstopo Geoportal). In order to show these data, the application is able to connect to all the institutional WMS compliant servers available on the network and to a dedicated WMS server specifically built-up and populated with the paths data.
A second level of information is provided by the crowdsourced data collected both by professional hikers or by simply occasional walkers, tourists, citizens, etc. For these specific kinds of information, ViaRegina2.0 has an innovative capability to connect with any ODK servers and publish the related data through a marker-based representation (see Figure 4).
Figure 4. Markers related to the POIs collected by users Taking advantage of this technology and using a dedicated ODK server specifically configured for the project, users can report significant Points Of Interest (POIs) through their mobile devices (smartphone and tablets), upload them to the server and each content will be automatically geo-localized on the virtual globe as markers. All the markers are open to collaborative contribution: everyone can upload and link to them comments and multimedia contents (image, video, and audio files) in order to enrich and share the information related to each POI. By clicking on a marker symbolizing a POI, the related details collected through the ODK mobile app are displayed (see Figure 5) and a dedicated section gives also access to all the textual and multimedia contents (comments, images, audios and videos). All the multimedia elements are entirely managed by the client: images are displayed in a picture viewer, while, for videos and audios, the application relies on a customizable external player.
The POIs visualization is fully customizable thanks to a suitable layer management interface. The fields to be displayed can be selected, and the marker icons can be personalized by picking them from a default collection or providing them manually. The application can manage different projects populated with different WMS and ODK layers depending on the emphasized topics related to the paths (cultural, environmental, tourist,... theme). All the projects created by the users are publicly accessible by design, in order to promote the community participation.
Figure 5. Visualization of the detailed data for the selected POI Finally, the introduction of the fourth dimension (time) provides a more in-depth navigation through the content. The time bar enables temporal filtering of all the POIs on the globe, just by picking a given date or setting a range. The same capabilities are also made available for multimedia data, which can be independently filtered according to the date of the content upload or (if provided) to the actual date of the element, e.g. useful to filter historical data.
4.3 Data customization
ViaRegina2.0 is able to display a wide variety of data sources, all referring to the “Via Regina” contest but having different purpose (educational, environmental, tourism, landscape, naturalistic, etc.) since the platform can be connected to any WMS and ODK Aggregate server available on the Internet. More in detail, the ODK Application Programming Interfaces (APIs), specially integrated into the virtual globe Java code, enable ViaRegina2.0 client to retrieve all the information required to connect to any ODK Aggregate server, i.e. the list of available forms and the corresponding data submitted, which can then be visualized on the 3d platform. From a logical perspective, the connection to an ODK Aggregate server is treated in the same way as to a standard WMS server: the user has to select the type of server (see Figure 6), enter its URL and then pick up the layer(s) of interest. The only difference is that, while WMS servers provide raster map layers, ODK Aggregate servers provide marker layers (see Figure 4).
Figure 6. Form to connect transparently to any WMS or ODK server available on the network
Any server (both WMS and ODK Aggregate server) to which a user connects is saved into a persistent catalog (see Figure 7) which is available to all the users in order to facilitate its reuse. Once users have created 3D customized mash-ups, they can save their ViaRegina2.0 projects which again are stored in a catalog (i.e. are available for reuse) for the whole community. The users’ credentials, the list of available servers and projects, and the projects themselves (i.e. the available layers and their on/off status, the location and the camera orientation of the point of view over the globe) are stored in the PostgreSQL database on the ViaRegina2.0 server.
Figure 7. WMS/ODK server list (left panel) and corresponding layer list (right panel)
4.4 View customization
Consistent with its multi-thematic nature, ViaRegina2.0 allows to dynamically customize marker icons on the client-side according to the peculiar project the user is working on. Unlike the WMS layers, where the graphic layout is predefined on server side (WMS layer style), the ViaRegina2.0 client provides an intuitive graphical interface (GUI) to manage the styles for the punctual marker layers derived from ODK Aggregate servers.
When adding an ODK layer to a project, users can select the point attribute to use for styling layer markers among those available, e.g. the type of point. Automatically, as it happens for the typical styling tools in GIS packages, all the values assumed by the markers for the selected attribute are displayed. For each of them, users can pick up an icon from a rich collection of icon libraries available within the platform, or they can manually provide an icon by uploading a file (see Figure 8).
Figure 8. Marker icons thematization by attributes In the same way of servers and projects, styles are also shareable, so that users adding the same layers in their projects can save time by opting for a ready-made icon set defined by another user.
4.5 Management of multimedia contents
A notable feature justifying the social nature of ViaRegina2.0 is the possibility for any user to add comments and multimedia contents (images, audios and videos) to any ODK marker layer. This is possible from a built-in interface on the client-side available when clicking on a marker. Besides showing all the information related to that marker, the interface displays the available multimedia contents and allows users to add new ones (see Figure. 9).
Figure 9. Marker icons thematization by attributes ViaRegina2.0 integrates all these functionality in the same client-side graphics environment, thus making visualization and data upload easy and intuitive.
Moreover, a dedicated web-application based on the Java Server Faces technology was designed and implemented to facilitate the remote administration of the platform contents, allowing all the CRUD (create, read, update and delete) basic functions on the database (see Figure 10).
Figure 10. Web-application for remote data administration
4.6 Time filtering of data
ViaRegina2.0 introduces the 4th dimension in the data visualization. A temporal slider available on the bottom side of the interface (see Figure. 9) allows the time filtering of both the ODK marker layers and their multimedia contents. While markers are filtered according to their submission date (i.e. the date they were created from ODK Collect or Enketo), multimedia contents can be filtered either by the date they were uploaded on the platform or by the actual date the content was created (i.e. the picture was taken, the video was shot, the audio was recorded). The date of creation (together with a description of the data) can be added by users as a metadata during the upload of multimedia contents. Filtering capability makes ViaRegina2.0 particularly useful for historical projects and, more in general, projects where temporal information plays a key role.
4.7 Authentication and authorization
ViaRegina2.0 can be used in two different approach. In the former every user (authenticated or anonymous) can access to the main “Via Regina” project composed by the institutional WMS base layers and the official ODK layers. This project is maintained by the responsible of the contents (platform data administrators) and cannot be edited by the community. This means that the layers list, the markers styles and the multimedia data associated to the POIs cannot be changed.
The latter approach of ViaRegina2.0 is based on a participatory one where users can add and share new data with the community in order to enrich the information about the Via Regina paths. The registered and authenticated users can create new customized projects for specific topics and/or specific parts of the territory into a separate environment (workspace for community projects), select the WMS layers (from any WMS servers available on internet), select the separated ODK layers specifically provided by the platform for the community and upload new data (markers and related multimedia contents). The authorization policies ensure that only the owners of the projects can perform editing operations, while all the other users can view the shared projects and contribute by adding new data.
5. CONCLUSION
The European Union has been emphasizing in the last years the concepts and practices of smart, sustainable and inclusive growth based on the valorization of human, relational and social capital together with the preservation of the environment and obtained by exploiting ICT. Geospatial technologies enable a
new way of living the territory as “citizen2.0” and of travelling within it as ‘tourists2.0’ for whom the travelling experience can be enhanced by the information and entertainment available, and at the same time customized for meeting their requirements and enriched by volunteered and crowdsourced multimedia data. Not only the available authoritative data but also the citizens' geospatial data can be the backbone for building up these new cultural and touristic systems. Instead of using a traditional 2D client for the visualization, we created a 3D virtual globe collaborative platform, with the aim of increasing the users’ immersivity. The collaborative platform, and the App to enrich it, are now both available at the website of the Interreg project: www.viaregina.eu. We do not have still a complete feedback about their success or about the quality of the shared information because till now they have been used only by the partners of the projects (local municipalities and cultural associations). Further steps will include also these evaluations.
ACKNOWLEDGEMENTS
This research has been partially funded by the project “I Cammini della Regina – Percorsi transfrontalieri legati alla Via Regina (The Paths of Regina – Cross-border paths linked to Via Regina)” within the Interreg Co-operation Programme 2007-2013
REFERENCES
Brovelli, M. A., & Zamboni, G. (2012). Virtual globes for 4D environmental analysis. Applied Geomatics, 4, pp. 163-172. Brovelli, M. A., Minghini, M., & Zamboni, G. (2012a). Valorisation of Como historical cadastral maps through modern web geoservices. In: ISPRS Annals of the Photogrammetry, Remote Sensing and Spatial Information Sciences, Volume I-4, XXII ISPRS Congress, Melbourne 25 August - 1 September 2012, pp. 287-292.
Brovelli, M. A., Valentini, L., , & Zamboni, G. (2012b). Multi-frame and multi-dimensional historical digital cities: the Como example. International Journal of Digital Earth, iFirst article, ISSN 1753-8947 print ISSN 1753-8955 online, Taylor & Francis, DOI:10.1080/17538947.2012.739662, pp. 1-15. Brovelli, M. A., Minghini, M., & Zamboni, G. (2013). The power of Virtual Globes for valorising cultural heritage and enabling sustainable tourism: NASA World Wind Applications. In: The International Archives of the Photogrammetry, Remote Sensing and Spatial Information Sciences, Volume XL-4/W2, 2013, ISPRS WebMGS 2013 & DMGIS 2013, 11 – 12 November 2013, Xuzhou, Jiangsu, China.
Burke, J., Estrin, D., Hansen, M., Parker, N., Ramanathan, S., Reddy, S., & Srivastava, M.B. (2006). Participatory Sensing. In: Workshop on World-Sensor-Web (WSW'06): Mobile Device Centric Sensor Networks and Applications (Boulder, October 2006), Boulder, CO, pp. 117-134.
Cohn, J. P. (2008). Citizen Science: Can Volunteers Do Real Research? BioScience 58(3), pp. 192-197.
Goodchild, M. F. (2007a). Citizens as Sensors: the world of volunteered geography. GeoJournal, 69, pp. 211-221, DOI: 10.1007/s10708-007-9111-y.
Goodchild, M. F. (2007b). Citizens as Voluntary Sensors: Spatial Data Infrastructure in the World of Web 2.0. International Journal of Spatial Data Infrastructure Research, 2, pp. 24-32.
Gore, A. (1999). The Digital Earth: understanding our planet in the 21st century. Photogrammetric Engineering and Remote Sensing, 65(5), p. 528.
Graham, P. (2005). Web 2.0. Retrieved January 20, 2014, from http://www.paulgraham.com/web20.html
Haklay, M., Singleton, A., & Parker, C. 2008. Web Mapping 2.0: The Neogeography of the GeoWeb. Geography Compass, 2, pp. 2011-2039.
Harvey, F. (2009). More than Names – Digital Earth and/or Virtual Globes? International Journal of Spatial Data Infrastructures Research, Vol. 4, pp. 111-116.
Heipke, C. (2010). Crowdsourcing geospatial data. ISPRS Journal of Photogrammetry and Remote Sensing, 65, 550-557. Howe, J. (2006). The rise of crowdsourcing. Wired Magazine, 14(6), pp. 176-183.
Maguire, D.J. (2007). GeoWeb 2.0 and Volunteered GI. In: Workshop on Volunteered Geographic Information, University of California, Santa Barbara, pp. 104-106.
Neumann, A. (2008). Web Mapping and Web Cartography. In: Shekar, S., Xiong, H. (eds.) Encyclopedia of GIS. Springer, pp. 1261-1270.
O’Reilly, T. (2005). What is Web 2.0: Design patterns and business models for the next generation of software. Retrieved
January 20, 2014, from
http://oreilly.com/pub/a/web2/archive/what-is-web-20.html Peng, Z.R., Tsou, M.H. (2003). Internet GIS. John Wiley & Sons, Hoboken, NJ.
Scharl, A., Tochtermann, K. (2007). The Geospatial Web: How Geobrowsers, Social Software and the Web 2.0 are Shaping the Network Society. Springer, London.
Schultz, R. B., Kerski, J. J., & Patterson, T. C. (2008). The use of virtual globes as a spatial teaching tool with suggestions for metadata standards. Journal of Geography, 107(1), pp. 27-34. Silvertown, J. (2009). A new dawn for citizen science. Trends in Ecology & Evolution 24(9), pp. 467–471.
Sui, D., Elwood, S., & Goodchild, M. (Eds.). (2013). Crowdsourcing Geographic Information. Dordrecht: Springer. Turner, A., (2006). Introduction to Neogeography. O’Reilly Media Short Cuts, Sebastopol, CA