The climatic and genetic heritage
of Italian goat breeds with genomic
SNP data
Matteo Cortellari
1,16, Mario Barbato
2,16, Andrea Talenti
1,3*, Arianna Bionda
1,
Antonello Carta
4, Roberta Ciampolini
5, Elena Ciani
6, Alessandra Crisà
7, Stefano Frattini
1,
Emiliano Lasagna
8, Donata Marletta
9, Salvatore Mastrangelo
10, Alessio Negro
1,
Ettore Randi
11, Francesca M. Sarti
8, Stefano Sartore
12, Dominga Soglia
12, Luigi Liotta
13,
Alessandra Stella
14, Paolo Ajmone‑Marsan
2, Fabio Pilla
15, Licia Colli
2& Paola Crepaldi
1Local adaptation of animals to the environment can abruptly become a burden when faced with rapid climatic changes such as those foreseen for the Italian peninsula over the next 70 years. Our study investigates the genetic structure of the Italian goat populations and links it with the environment and how genetics might evolve over the next 50 years. We used one of the largest national datasets including > 1000 goats from 33 populations across the Italian peninsula collected by the Italian Goat Consortium and genotyped with over 50 k markers. Our results showed that Italian goats can be discriminated in three groups reflective of the Italian geography and its geo‑political situation preceding the country unification around two centuries ago. We leveraged the remarkable genetic and geographical diversity of the Italian goat populations and performed landscape genomics analysis to disentangle the relationship between genotype and environment, finding 64 SNPs intercepting genomic regions linked to growth, circadian rhythm, fertility, and inflammatory response. Lastly, we calculated the hypothetical future genotypic frequencies of the most relevant SNPs identified through landscape genomics to evaluate their long‑term effect on the genetic structure of the Italian goat populations. Our results provide an insight into the past and the future of the Italian local goat populations, helping the institutions in defining new conservation strategy plans that could preserve their diversity and their link to local realities challenged by climate change.
The preservation of animal genetic diversity is fundamental to ensure food security and the development of farming communities1. Among the key factors shaping genetic and phenotypic diversity there is climatic and environmental heterogeneity2, with indigenous domestic breeds showing better adaptation to local environments than highly productive breeds kept in controlled farming systems in which the effects of climatic challenges are
OPEN
1Dipartimento di Scienze Agrarie e Ambientali – Produzione, Territorio, Agroenergia, Università degli Studi di
Milano, Via Celoria 2, 20133 Milan, Italy. 2Dipartimento di Scienze Animali, della Nutrizione e degli Alimenti
and BioDNA Centro di ricerca sulla Biodiversità e sul DNA Antico, Università Cattolica del Sacro Cuore, Via Emilia Parmense 84, 29122 Piacenza, Italy. 3The Roslin Institute, University of Edinburgh, Easter Bush Campus,
Midlothian EH25 9RG, UK. 4Unità di Ricerca di Genetica e Biotecnologie, Agris Sardegna, 07100 Sassari,
Italy. 5Dipartimento di Scienze Veterinarie, Università di Pisa, Viale delle Piagge 2, 56124 Pisa, Italy. 6Dipartimento
di Bioscienze Biotecnologie e Biofarmaceutica, Università degli Studi di Bari, Via Orabona 4, 70126 Bari, Italy. 7Consiglio per la ricerca in agricoltura e l’analisi dell’economia agraria (CREA) - Research Centre for Animal
Production and Acquaculture, 00015 Monterotondo, Rome, Italy. 8Department of Agricultural, Food and
Environmental Sciences, University of Perugia, 06121 Perugia, Italy. 9Department of Agriculture, Food and
Environment, University of Catania, Via Valdisavoia 5, 95123 Catania, Italy. 10Dipartimento Scienze Agrarie,
Alimentari e Forestali, University of Palermo, 90128 Palermo, Italy. 11Department of Chemistry and Bioscience,
Faculty of Engineering and Science, University of Aalborg, Aalborg, Denmark. 12Dipartimento di Scienze
Veterinarie, Università degli Studi di Torino, largo Braccini 2, 10095 Grugliasco, Italy. 13Dipartimento di Scienze
Veterinarie, University of Messina, Messina, Italy. 14Institute of Biology and Biotechnology in Agriculture,
National Research Council (CNR), Milan, Italy. 15Dipartimento Agricoltura, Ambiente e Alimenti Universitá degli
Studi del Molise, 86100 Campobasso, Italy. 16These authors contributed equally: Matteo Cortellari and Mario
minimized3–5. In this rapidly evolving situation, species that are mostly reared in marginal rural areas of the world such as goats are also more likely to be among those most affected by environmental changes6.
The Italian territory is characterized by a rich environmental diversity, spanning from the polar climate of the Alps to the Mediterranean climate of the south and isles7. This environmental richness is paired with a res-ervoir of genetic resources for the caprine species counting over 36 goat breeds registered by the National Goat and Sheep breeds Association (http:// www. asson apa. it). Italian goat genetic resources are managed throughout diverse farming systems ranging from intensive and semi-intensive to traditional grazing and transhumance. Importantly, most of them pertain to marginal areas where they play a crucial socio-economic role, contributing to the management of landscapes, biodiversity preservation, and the production of niche traditional products8. The Italian caprine diversity and adaptation to climate has been previously investigated through genotype data analyses6,9. However, no previous work included breeds from the central areas of the country, which hosts sev-eral minor, local, and niche populations10. Importantly, the latter are specifically adapted to the broad range of Italian eco-climatic scenarios, making them an ideal model to investigate genetic adaptation to climate, which only few studies tried to address in the goat species11–13.To investigate the link between territory and genetics, we analyse the second release of the goat genotype dataset assembled by the Italian Goat Consortium, a collabo-ration across Italian universities that aims to enhance the understanding of the Italian goat genetic variability. This new release of the dataset, called IGC2, expands the previous version, improving the sampling coverage of the central-southern goat populations and completes the whole Italian panorama and its internal connec-tions (Supplementary Fig. 1). To the best of our knowledge, IGC2 currently represents the largest national-level genotyping effort on goat biodiversity10.
The most recent climate predictions by the Koppen-Geiger climate classification foresee hotter and drier climate across the Italian peninsula over the next 70 years14. Such changes will likely affect locally adapted popula-tions by reducing food availability (e.g., pasture and forage crop availability and quality15), increase temperature-related health problems (illness, death rates, increased diffusion of vector-borne diseases and parasites), and cause metabolic problems (decreasing productive and reproductive performance or depressing feed intake8,16). Locally adapted breeds will be the hardest hit, mostly relying on grazing15,17.
We performed genome-wide analyses on the IGC2 dataset to investigate the genetic structure of Italian goat breeds with particular attention to the newly sampled local populations, and link the heritage and genomic structure of current populations with the present and future climatic condition of the rearing areas. Our results will help to understand their environment-driven adaptation and draw effective management plans to face climate change18,19.
Results and discussion
Genotyping control and datasets creations.
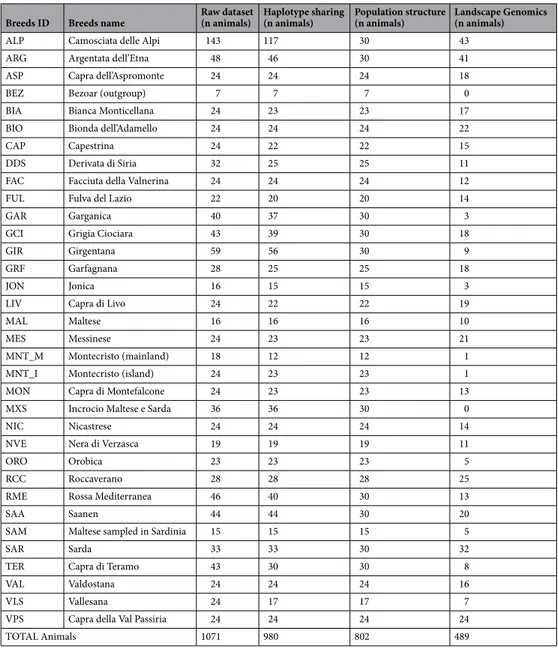
After filtering the initial raw dataset of 1,071 goats for poor quality genotype and related animals we obtained the dataset used for the haplotype sharing analysis, which included 980 animals and 48,396 SNPs. This dataset was further pruned for linkage disequilibrium (LD; r2 < 0.2).We first balanced the number of animals in the different populations by reducing the size of the nine largest groups, leaving 42,088 SNPs and 802 individuals. We used this dataset to perform population structure analyses (Multi-Dimensional Scaling (MDS), Admixture, and Reynolds distances).
Upon the removal of 2nd-degree related individuals and animals without geographical coordinates, we retained 41,898 SNPs and 489 individuals for Landscape Genomics analyses. See Table 1 for the detailing of the different datasets.
Population structure.
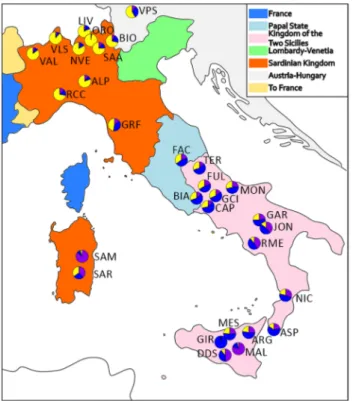
The MDS plot showed a north–south geographic gradient comparable with previ-ous findings on Italian goat population structure6. The first MDS component identified three main groups cor-responding to northern Italian, central-southern Italian, and Maltese populations. The second MDS component discriminated the insular Montecristo goat (MNT_I; Fig. 1a) from the other mainland breeds, likely due to the high inbreeding and prolonged geographical isolation (Somenzi et al., in preparation). For this reason, we excluded the two Montecristo populations (MNT_M and MNT_I) from the subsequent population structure and haplotype sharing analysis and to repeat the analyses without them. The new MDS plot without the two MNT populations (Fig. 1b) still separated the three main groups on the first component, a structure further sup-ported by the bootstrapped Reynolds’ distances phylogenetic tree (Supplementary Fig. 2).Although overlapping a previous investigation of the Italian caprine population structure6, our improved dataset identified a closer relationship between the central and southern Italian population, more in accordance with the recent known history and geography of the Country. Until 1860 Italy was divided in many states with tight connections to other European kingdoms (https:// www. 150an ni. it). The north-western part of the country and Sardinia were part of the Sardinian kingdom, tightly connected with the French empire, whereas the north-east part (the Kingdom of Lombardy—Venetia) was under the political influence of the Austrian Empire. Central Italy was ruled by the Papal state, and southern Italy and Sicily were under the Kingdom of the two Sicilies ruled by the Borbone (Fig. 2)20.
The ADMIXTURE analysis (Supplementary Fig. 3) at K = 2 separates the Maltese populations (purple com-ponent) and the Northern Italy breeds (yellow comcom-ponent), and improves the representation of the North–South gradient over previous studies on Italian goat populations6. At K = 3 it resembles the MDS plot distinguishing the central-southern Italian breeds led by the Girgentana (GIR; blue component) and the mean proportion for each breed overlap nicely with the political borders of Italy prior 1860 (Fig. 2). Each K above 3 distinguishes single or groups of breeds, such as Teramana (TER; K = 4) and Valdostana (VAL; K = 5). The lowest cross-validation error was recorded at K = 20 (Supplementary Fig. 4) and showed the similar genetic background of those breeds originated from the same geographical regions (north, central, south and Maltese), and some breeds identified
by private clusters, once again confirming the uniqueness of GIR, ORO, VAL, TER and SAM, among others (Supplementary Fig. 3).
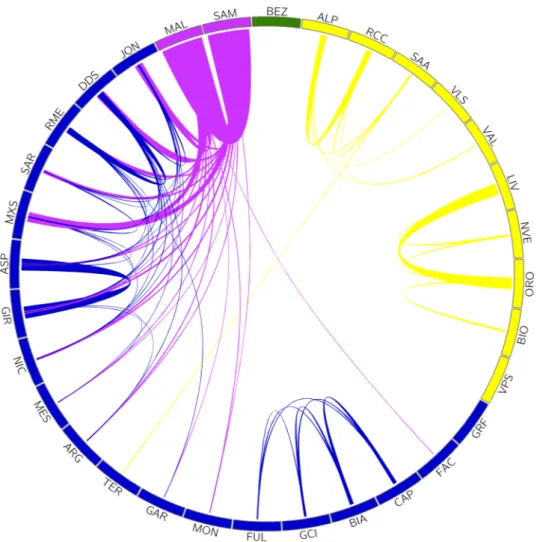
The haplotype sharing analysis across populations (Fig. 3) also highlights the three genetic groups correspond-ing to admixture K = 3 and consistently with the administrative and temporal history of the Italian Peninsula until 186020.
We observe that the Northern-Italian populations (yellow cluster) show no haplotype exchange with the other clusters, with the exception of SAA and TER probably due to a recent introgression event. Within the Northern-Italian cluster there is a more pronounced haplotype sharing among the Lombardy breeds (ORO, NVE, LIV and BIO) than among those from the rest of the Alps. The Val Passiria (VPS) together with the Garfagnana (GAR) are the only two populations that do not exchange haplotypes at all, perhaps suggesting a geographical and/or political isolation. Populations from Central-Southern Italy (blue cluster) show large haplotype sharing within and among different clusters, possibly due to breeding and management practices as well as local geographical conditions, such as breeds from the Lazio region (BIA, GCI, CAP, and FUL) have high haplotype sharing among themselves. Lastly, the populations from the isles and in particular the Maltese (MAL and SAM, purple cluster) and Sarda (SAR and MXS) are those that mostly shared haplotypes with all other southern breeds, probably as a consequence of their high productivity and diffusion over the territory. The green colour represents the outgroup
Capra aegagrus that does not exchange haplotypes with any of the other breeds. Importantly, future
investiga-tions with dedicated experimental designs aimed to dissect the different effects of selection might aid unfolding the undergoing evolutionary dynamics.
Table 1. Composition of the datasets used for the different analysis, with names, codes and number of samples processed and filtered for each population and grouped by the type of analysis.
Breeds ID Breeds name Raw dataset (n animals) Haplotype sharing (n animals) Population structure (n animals) Landscape Genomics (n animals)
ALP Camosciata delle Alpi 143 117 30 43
ARG Argentata dell’Etna 48 46 30 41
ASP Capra dell’Aspromonte 24 24 24 18
BEZ Bezoar (outgroup) 7 7 7 0
BIA Bianca Monticellana 24 23 23 17
BIO Bionda dell’Adamello 24 24 24 22
CAP Capestrina 24 22 22 15
DDS Derivata di Siria 32 25 25 11
FAC Facciuta della Valnerina 24 24 24 12
FUL Fulva del Lazio 22 20 20 14
GAR Garganica 40 37 30 3
GCI Grigia Ciociara 43 39 30 18
GIR Girgentana 59 56 30 9
GRF Garfagnana 28 25 25 18
JON Jonica 16 15 15 3
LIV Capra di Livo 24 22 22 19
MAL Maltese 16 16 16 10
MES Messinese 24 23 23 21
MNT_M Montecristo (mainland) 18 12 12 1
MNT_I Montecristo (island) 24 23 23 1
MON Capra di Montefalcone 24 23 23 13
MXS Incrocio Maltese e Sarda 36 36 30 0
NIC Nicastrese 24 24 24 14
NVE Nera di Verzasca 19 19 19 11
ORO Orobica 23 23 23 5
RCC Roccaverano 28 28 28 25
RME Rossa Mediterranea 46 40 30 13
SAA Saanen 44 44 30 20
SAM Maltese sampled in Sardinia 15 15 15 5
SAR Sarda 33 33 30 32
TER Capra di Teramo 43 30 30 8
VAL Valdostana 24 24 24 16
VLS Vallesana 24 17 17 7
VPS Capra della Val Passiria 24 24 24 24
Figure 1. (a) MDS plot representing all the populations contained in the dataset, (b) MDS plot without the two Montecristo populations (MNT_M e MNT_I).
Figure 2. Historical map of Italy pre-unification with pie chart of the ADMIXTURE K = 3 values plotted on the geographical coordinates of the mean sampling location of each breed. The colours reflect the ADMIXTURE component associated with the Maltese (purple), Northern Italy Cluster (yellow), and Central-Southern Cluster (blue). BEZ and MXS were not represented due to the lack of specific geographic coordinates. MNT_I and MNT_M were excluded as extreme outliers. Map was generated in Inkscape v1.0 (https:// inksc ape. org/); the pie charts were created using R21.
The political subdivision of Italy preceding the unification of the country has probably contributed to maintain the ancient genetic flows from central-north Europe in the north of the country and from Africa and Spain in the south13, with only a minor impact on the population structure of the following 150 years of history of the country.
Landscape genomics.
The landscape genomics analyses (LGA) were performed using the climatic vari-ables representing the current climate applying two different approaches: Samβada23 and LFMM24. We observed no direct overlap between the two methods. However, this is not surprising as simulation studies showed that LFMM is overall more conservative than Samβada, and the two methods tend to have marginal overlap on co-selecting the same signals, with the most significant loci detected by Samβada ignored by LFMM23. Samβada identified 252 genotypes belonging to 216 different SNPs significantly associated (FDR < 0.05) with at least one climatic variable (Supplementary Table 1). Among them, 75 SNPs mapped within a gene region annotated in the goat genome (ARS1.2), identifying a total of 62 different genes associated with at least one of the follow-ing four representative environmental variables: “Isothermality” (47 genes), “Mean diurnal range” (four genes), “Mean temperature wettest quarter” (three genes) and “Precipitation coldest Quarter” (11 genes) (Supplemen-tary Table 2). Some of these genes had already been identified in other landscape genomics works in relation with different environmental variables, for example ANK3 and BTRC in relation to longitude, and RYR3 with Mean Temperature of the wettest quarter (BIO3)19. The DCLK1 gene, in particular, was found in association with the continental goat group compared to the rest of the world9. Details on correlations among representative and excluded variables are shown in Supplementary Table 3.Initially, we investigated the role in biological pathways of the 62 genes identified by Samβada (Supplementary Table 2), splitting them according to the associated environmental variable. We identified only one significant pathway (“Circadian rhythm related genes WP3594”; adjusted p-value < 0.0045) for those genes associated with “Mean diurnal range” with two genes linked to the circadian clock regulation (MAPK925) and to hair follicle formation and hair growth in Cashmere goat (NTKR326).
Figure 3. Proportion of the median haplotype shared among the Italian goat populations. The colours reflect the ADMIXTURE components at K = 3, which overlap with the administrative and temporal history of the Italian Peninsula until 1860. The outgroup is highlighted in green (extended name reported in Table 1). The figure was generated using Circos v0.69-8 Software22.
We also analysed the 62 genes individually to better understand their function. Using the information found, we can clump the most interesting genes into four groups based on the phenotype they affect the most: (1) meat- and growth-related genes, (2) circadian rhythm-related genes, (3) fertility-related genes, and (4) inflammatory response genes.
The first group (meat and growth) is the largest and counts 24 genes, including HADC9, which has a role in the feedback inhibition of myogenic differentiation in sheep muscle27, DLG1, that is related to adipogenesis and residual feed intake in cows28, and KLF12, which is related to the formation of preadipocytes in goats29. The second group (circadian rhythm) includes 12 genes, such as MAPK9 and EYA3, both related to melanin production and photoperiod regulation30, and KCNJ1, associated with the production of polyunsaturated fatty acid (PUFA) and feed efficiency in cattle5,31,32. The third group (fertility-related) includes 15 genes such as BTRC , whose mutations can affect spermatogenesis and mammary gland development in mice33, PRKD1, associated to age at puberty in pigs34, and DENND1A, related to anti-Mullerian hormone and superovulation in dairy cows and to polycystic ovarian syndrome in human35. Finally, the fourth group (inflammatory response) includes eight genes such as BTLA, strongly related to rheumatoid arthritis36. This last gene in particular is relevant as a candidate for one of the most relevant infective diseases of goats worldwide, the Caprine Arthritis Encephalitis Virus (CAEV). This virus belongs to the Retroviriade virus family, like the human immunodeficiency virus (HIV), and has rheumatoid arthritis among its principal symptoms37,38. Due to the CAEV importance and the relevance of climatic factors and their change play into pathogens diffusion39, this group of genes becomes a potential candidate for studies on livestock resilience to incoming climate challenges.
LFMM identified four SNPs significantly associated (FDR < 0.05) with three different climatic variables (Mean Diurnal Range, Mean Temperature Wettest Quarter, and SlopeP), two of which intercepting NBEA, a gene located within a region involved with wool production in sheep40 and previously associated with continental goat group in the work of Bertolini et all 20189, and the RHOBTB1 gene that is known to be associated to meat quality in cattle41 (Supplementary Table 4).
Future genotypes prediction.
The data collected on the current Koppen-Geiger climate classifica-tion showed that 21 Italian breeds live in “Temperate” regions, eight in “Cold” regions (BIO, SAA, VLS, TER, MNT_M, LIV, ORO, VPS), two in “Arid” regions (GAR, MNT_I), and one in a “Polar” region (VAL; Fig. 4a). BEZ and MXS were not considered for the analysis due to lack of georeferenced information. If we compare the current Koppen-Geiger classification of their breeding areas with the future predictions (Fig. 4b), we observe that, in 70 years from now, only 11 breeds will live in regions that will not change their classification. Such a scenario will likely pose new threats to those populations living in colder climates, whereas those breeds coming Figure 4. Koppen-Geiger climate maps with classification for Italy (a) present day (b) future (extended name reported in Table 1). The Maps were generated using R combining the information available in Rubel et al.42 and Beck et al.14.from the warmer parts of the country might have a chance to expand their range, with direct repercussions on the genetic diversity and survival of these breeds.
Among them, nine (ASP, BIA, CAP, GRF, MES, NIC, RCC, RME, SAR) populate “Temperate dry hot summer (Csa)” areas, one (GAR) is present in an “Arid step cold (Bsk)” area, and one (NVE) in a “Temperate without dry season hot summer (Cfa)” region. The remaining 21 breeds populate regions with a warmer and drier climate in the future (Table 2).
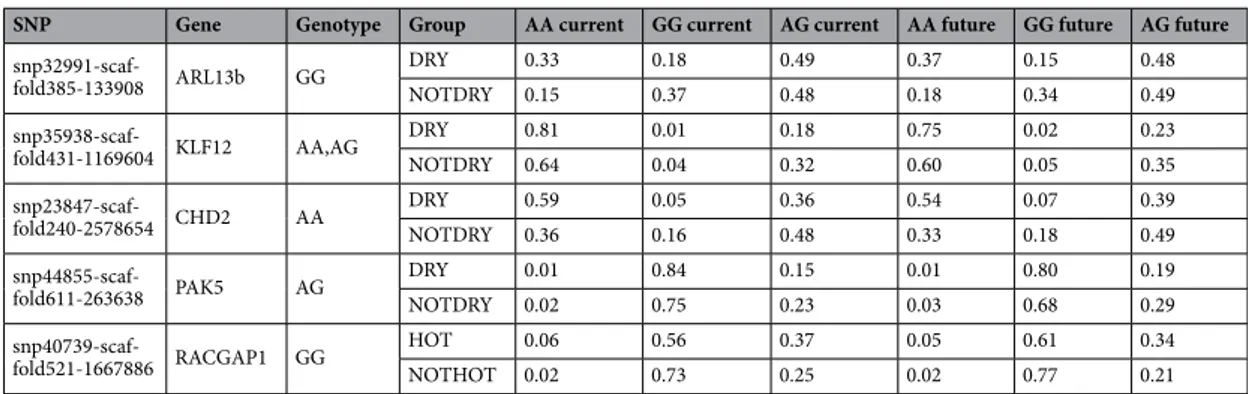
A one-way ANOVA analysis applied on the groups based on the Koppen-Geiger classification identified 27 SNPs that significantly differentiate the groups DRY/NOTDRY (seven within a gene region) and 11 that differ-entiate the groups HOT/NOTHOT (two within a gene region) (Supplementary Table 5). The linear regression model, applied to verify the variation of the genotype frequencies over time based on the value of their related variables, allowed us to identify five significant SNPs out of nine, intercepting the genes CHD2, ARL13B, KLF12, and PAK5 for the DRY/NOTDRY group and RACGAP1 for the HOT/NOTHOT group (Supplementary Table 6). Then, we calculated the expected future variation of allelic and genotypic frequencies of the significant SNPs in these groups. For instance, the SNP “snp32991-scaffold385-133908” intercepts the ARL13B gene and is associated to “Isothermality” with the genotype GG. At present, the frequency of the G allele of this SNP is 0.4296 in the DRY group and 0.6109 in the NOTDRY group and the delta of the variable “Isothermality” for the two groups is respectively − 0.1253 for the DRY group and − 0.0935 for the NOTDRY group. Using the regressor of the linear regression model (b = 0.3278), we predicted the future G allele frequency for this SNP in both groups (0.3885 and 0.5802 for the DRY and NOTDRY group, respectively) and consequently the expected GG genotype frequency Table 2. Present and future predicted Koppen-climate class and Anova classification for breed divided in the two groups: HOT/NOTHOT and DRY/NOTDRY (see Materials and Methods). In bold those breeds that will change their Koppen classification in the next 70 years.
Breeds Current class Future class Hot-Nothot Dry-Notdry
GAR BSk-arid steppe cold BSk-arid steppe cold Nothot Dry
MNT_I BSk-arid steppe cold Csa-temperate dry hot summer Nothot Dry
MON Cfa-temperate without dry season hot summer BSk-arid steppe cold Hot Notdry
NVE Cfa-temperate without dry season hot summer Cfa-temperate without dry season hot sum-mer Hot Notdry
ALP Cfa-temperate without dry season hot summer Csa-temperate dry hot summer Hot Notdry
FAC Cfa-temperate without dry season hot summer Csa-temperate dry hot summer Hot Notdry
FUL Cfb-temperate without dry season warm summer Csa-temperate dry hot summer Nothot Notdry
DDS Csa-temperate dry hot summer BSh-arid steppe hot Hot Dry
GIR Csa-temperate dry hot summer BSh-arid steppe hot Hot Dry
MAL Csa-temperate dry hot summer BSh-arid steppe hot Hot Dry
ASP Csa-temperate dry hot summer Csa-temperate dry hot summer Hot Dry
BIA Csa-temperate dry hot summer Csa-temperate dry hot summer Hot Dry
CAP Csa-temperate dry hot summer Csa-temperate dry hot summer Hot Dry
GRF Csa-temperate dry hot summer Csa-temperate dry hot summer Hot Dry
MES Csa-temperate dry hot summer Csa-temperate dry hot summer Hot Dry
NIC Csa-temperate dry hot summer Csa-temperate dry hot summer Hot Dry
RCC Csa-temperate dry hot summer Csa-temperate dry hot summer Hot Dry
RME Csa-temperate dry hot summer Csa-temperate dry hot summer Hot Dry
SAR Csa-temperate dry hot summer Csa-temperate dry hot summer Hot Dry
ARG Csb-temperate dry warm summer Csa-temperate dry hot summer Nothot Dry
GCI Csb-temperate dry warm summer Csa-temperate dry hot summer Nothot Dry
JON Csb-temperate dry warm summer Csa-temperate dry hot summer Nothot Dry
SAM Csb-temperate dry warm summer Csa-temperate dry hot summer Nothot Dry
BIO Dfb-cold without dry season warm summer Cfa-temperate without dry season hot sum-mer Nothot Notdry
SAA Dfb-cold without dry season warm summer Cfa-temperate without dry season hot sum-mer Nothot Notdry
VLS Dfb-cold without dry season warm summer Cfa-temperate without dry season hot sum-mer Nothot Nodry
TER Dfb-cold without dry season warm summer Csa-temperate dry hot summer Nothot Notdry
MNT_M Dfb-cold without dry season warm summer Csb-temperate dry warm summer Nothot Notdry
LIV Dfc-cold without dry season cold summer Dfb-cold without dry season warm summer Nothot Notdry
ORO Dfc-cold without dry season cold summer Dfb-cold without dry season warm summer Nothot Notdry
VPS Dfc-cold without dry season cold summer Dfb-cold without dry season warm summer Nothot Notdry
(respectively 0.1509 for the DRY group and 0.3366 in the NOTDRY group). This simplified model suggests a future reduction of the genotype currently associated with the reference variable (“Isothermality”) in both groups. Interestingly, the gene intercepted by ARL13B interacts with RABGEF1, related to the reduction of the circadian cycle in humans according to the GenomeRNAi human phenotypes database (http:// www. genom ernai. org). In general, the prediction analysis identified SNPs that might go to stabilization of the frequencies or fixation (see “snp44855-scaffold611-263638” and “snp40739-scaffold521-1667886”, respectively; Table 3).
Conclusions
This new release of the Italian goat consortium dataset (IGC2)—almost three times the size of the previous iteration—fills in the gaps in terms of completeness and representativeness of the Italian caprine diversity. Our analyses overlap and expand on previous studies providing insight into the past, present, and future evolution of the populations considered. We confirm the geographic gradient of goat diversity ranging from north to south6, provide fine scale population structure, and highlight the overlap with the geo-political situation in which the breeds evolved. Previous studies have shown how past migrations from Africa and Spain on the one hand, and central Europe and the Alps on the other hand, contributed to shaping the backbone of biodiversity along the peninsula. Nevertheless, the overlap among the three diversity clusters and the political subdivision of Italy up to 160 years ago20 is an intriguing finding that suggests a role for the past socio-political scenario of the country in the current diversity of Italian goats breeds. By investigating the relationship between genotype and environment, we identified several genes which might play a role in the adaptation to temperature and humidity. Interestingly, we identified a gene that can be a fitting candidate for future studies on the caprine arthritis encephalitis virus (CAEV). Lastly, we predicted the future genotypic frequencies under the light of climate changes and foresee the directionality of changes in genotypes frequencies, an important starting point for future studies aiming at improving these analytical approaches. We infer that improved modelling approaches could deepen and perfect such results and shed light on today’s favorable genotypes for specific environmental conditions. These results will likely be instrumental in breeding schemes and genomic selection, assisting locally adapted breeds to cope with the expected climate change toward warmer and drier climates14.
Material and methods
Biological samples.
Management and handling of the animals involved in this study were performed fol-lowing the Italian and European legislation on animal welfare (D.lgs n. 146/2001, Council Directive 98/58/CE) and adhering to the ARRIVE ESSENTIAL 10 guidelines, where applicable. Blood samples were taken by official veterinary surgeons following the recommendations of the European directive 2010/63, without performing any actual experimental research on animals. Experimental protocol was approved by the Ethical committee of the Department of Veterinary Science of the University of Messina (code 046/2020).Blood sampling collection of the new individuals was performed using Vacutainer tubes with the K-EDTA anticoagulant, then all the samples were stored at − 20 °C until genomic DNA was extracted using a commer-cial kit (NucleoSpin Blood, Macherey–Nagel, GmbH & Co KG, Germany) according to the manufacturer’s instructions6. DNA samples were genotyped using the GoatSNP50 BeadChip (Illumina Inc., San Diego, CA) developed by the International Goat Genome Consortium (IGGC) at the Agrotis srl (http:// www. lgscr. it, Cre-mona, Italy), Porto Conte Ricerche s.r.l. (Alghero, Sassari, Italy), and University of Palermo facilities (Italy).
Genotyping control and datasets creations.
The IGC2 successfully fills the gaps of the previous dataset6, intercepting the local diversity of several under-represented areas of the country (i.e., the central regions of Italy) and identifying small, indigenous breeds never characterized before. For this work, 19 new Italian goat populations, for a total amount of 586 individuals, were sampled and added to SNP genotyping data taken from previously studies6,43,44, including seven Iranian Bezoar (Capra aegagrus) genotyped by the NEXTGEN project as outgroup for the analyses (“NEXTGEN Project” n.d.). From that, we obtained a final raw dataset consisting of 1071 goats from 33 Italian breeds and populations and one wild species, Capra aegagrus (Table 1). Geographical coordinates of the samples at the time of sampling were available for 998 samples (93% of all samples).Table 3. Predicted genotypic frequencies for the five polymorphisms recorded within genes identified to be significantly different between the groups HOT/NOTHOT or DRY/NOTDRY.
SNP Gene Genotype Group AA current GG current AG current AA future GG future AG future
snp32991-scaf-fold385-133908 ARL13b GG
DRY 0.33 0.18 0.49 0.37 0.15 0.48
NOTDRY 0.15 0.37 0.48 0.18 0.34 0.49
snp35938-scaf-fold431-1169604 KLF12 AA,AG DRYNOTDRY 0.810.64 0.010.04 0.180.32 0.600.75 0.020.05 0.230.35
snp23847-scaf-fold240-2578654 CHD2 AA DRYNOTDRY 0.590.36 0.050.16 0.360.48 0.540.33 0.070.18 0.390.49
snp44855-scaf-fold611-263638 PAK5 AG DRYNOTDRY 0.010.02 0.840.75 0.150.23 0.030.01 0.680.80 0.190.29
The raw dataset was updated to the latest goat genome map (ARS1.2) and pruned to retain SNPs having SNP call rate > 98%, individual call rate > 95% and minor allele frequency (MAF) > 0.05. Then, we pruned loci in linkage disequilibrium (LD), removing one of each couple of SNPs having LD > 0.2 using PLINK v1.90b645. Duplicated individuals (identity by state > 99%) were removed and for each pair of highly related animals (Men-delian Errors count < 100) we excluded the animal occurring in multiple pairs or having the highest missingness. Phasing and imputation of missing genotypes was performed using BEAGLE v4.146, using sliding windows of ~ 5 Mb with an overlap of ~ 2 Mb and allowing two SNPs trimming (~ 0.15 Mb). The resulting dataset was used for the haplotype sharing analysis. In order to investigate the population structure using comparable population sizes, we created a specific dataset reducing the number of individuals for each population to ≤ 30 while main-taining the overall within-population diversity, using the ‘representative.sample’ function implemented in the R package BITE v1.2.000747.
Lastly, individuals with more than second-degree relatedness were identified using the—genome flag in PLINK and removed to perform the Landscape genomics analisis.
Population structure analysis.
Population structure analysis was conducted through MDS of the identity by state (IBS) distances obtained with the flag—cluster in PLINK. Maximum likelihood analysis of population structure was conducted using ADMIXTURE v1.3.0 Software48. Unsupervised clustering was calculated for K values from 2 to 35. We used fivefold cross-validation (CV) errors for each K to evaluate the optimal partition-ing, and plots for each K were generated using an in-house R script. A phylogeny tree based on Reynolds Genetic distances, with 100 bootstrap replicates, was computed using a custom script. A Neighbour‐joining consensus tree was generated using PHYLIP v3.69749 and using Bezoar as an outgroup.The proportion of haplotypes shared among breeds was determined as Identity By Descent (IBD) estimation among individuals, and calculated using RefinedIBD v4.150 on all the individuals that passed the initial qual-ity check. Sliding windows size was set to of 1 Mb, reporting windows of at least 0.2 Mb and allowing 0.05 Mb overlap. We considered the shared haplotypes between two breeds as the median length of shared haplotypes among all the possible pairs of individuals belonging to the breeds considered (individual pairs with no haplotype sharing were assigned length = 051).
Landscape genomics.
For each georeferenced sample, we used the ‘extract’ function from the R package raster52 to retrieve the values of 19 bioclimatic and elevation variables available from the WorldClim database53 as those referring to the time span between 1960 and 1990 as proxy for the current climate, and the estimated future values for 2070 (average for 2061–2080) (Supplementary Table 7). Altitude was used to compute terrain slope through the function raster::terrain. Each variable was retrieved as a raster layer with a spatial resolution of 2.5 arcminutes (~ 4 km). Pairwise correlations were calculated among the climatic variables using JMP54.LGA was performed to assess the genotype/environmental variable association using Samβada v.0.5.323 and LFMM v3.1.224. Analyses were performed using the ‘current’ bioclimatic variables and a more stringent subset of animals. To spare computation time, the number of environmental variables was reduced iteratively by ran-domly removing one of the two most correlated variables until the maximum correlation across all variables was lower than |r2|< 0.7 as implemented in the R function ‘caret::findCorrelation’55. To reduce the risk of false positive detections, we evaluated the genetic structure of our dataset through principal component analysis, used the scree plot to identify the number of principal components to keep to adequately describe the dataset, and included the selected PCs as population structure predictors for the association analysis56,57. A likelihood-ratio test comparing a null and an alternative model was carried out for each genotype. Specifically, null models included the population structure predictors alone, whereas alternative models included population structure predictors and the focal environmental variable. A genotype was considered significantly associated with the environmental variable if the resulting p-value associated with the likelihood-ratio test statistic was lower than the nominal significance threshold of 0.05 after Benjamini-Hochberg (BH) correction for multiple testing. The R function ‘p.adjust’ was used to perform corrections for multiple testing21.
Gene‑level analysis.
To further investigate the biology underlying the signals identified, we screened all the SNPs that resulted significantly associated with a WorldClim variable for annotated genes of interest at the exact location of each marker in the ARS1.2 goat genome version (https:// www. ensem bl. org/ bioma rt). These genes were investigated individually (https:// www. genec ards. org) and used as input for an enrichment analysis for pathways and ontologies using the online tool Enricher (https:// amp. pharm. mssm. edu/ Enric hr/).Future genotypes prediction.
Comparing the LGA results with the Koppen-Geiger classification rela-tive to the breeding areas of the different Italian breeds, we tried to predict the future frequencies of the geno-types significantly associated with one or more of the environmental variables considered. First, we estimated the extent of climate change that Italian breeds will face comparing the present and future Koppen-Geiger classification14 (Supplementary Table 8). Then, we grouped the breeds based on temperature according to the current Koppen-Geiger classification, creating the HOT and NOTHOT groups, and humidity, creating the DRY and NOTDRY groups. The HOT group included those breeds that live in Csa and Dfa regions and the NOTHOT group included breeds that live in Csb, Dfb, Dfc, Bsk, and EF regions. The DRY group included those breeds that live in Csa, Csb, and Bsk regions and the NOTDRY group included those breeds that live in Cfa, Dfb, Dfc, and EF regions (see Table 2 and Supplementary Table 8 for the detail of the environmental codes).We calculated the MAF of all the significant SNPs from LGA in each Italian breed using a custom script. We summarized the MAF in each of the four groups and performed a one-way ANOVA analysis using the R base package21 considering the HOT/NOTHOT groups or the DRY/NOTDRY groups as source of variation,
identifying the SNPs significantly different in the two couples of groups. We applied a linear regression model (R base Package) only on those SNPs that fall within genomic regions including an annotated gene considering the mean allelic frequencies of the SNP and the mean value of the environmental variable resulted significantly associated with that SNP for each breed in each group. Finally, we calculated the future hypothetical change in allelic and genotypic frequencies only for those SNPs with a statistically significant linear regression model. For each group, we multiplied the delta between the current and the projected future value of the environmental variable associated with the SNP with the regressor of the linear model.
Ethical approval.
All authors declare that animal samples were obtained in compliance with local/national laws in force at the time of sampling. Genotyping data exchange was in accordance with national and interna-tional regulations.Received: 18 November 2020; Accepted: 29 April 2021
References
1. Hoffmann, I. Climate change and the characterization, breeding and conservation of animal genetic resources. Anim. Genet. 41(1), 32–46 (2010).
2. Lv, F.-H. et al. Adaptations to climate-mediated selective pressures in sheep. Mol. Biol. Evol. 31, 3324–3343 (2014).
3. Bruford, M. W. et al. Prospects and challenges for the conservation of farm animal genomic resources, 2015–2025. Front. Genet.
6, 314–314 (2015).
4. Pariset, L., Joost, S., Marsan, P. A. & Valentini, A. Landscape genomics and biased FST approaches reveal single nucleotide poly-morphisms under selection in goat breeds of North-East Mediterranean. BMC Genet. 10, 7–7 (2009).
5. Barbato, M. et al. Adaptive introgression from indicine cattle into white cattle breeds from Central Italy. Sci. Rep. 10, 1279–1279 (2020).
6. Nicoloso, L. et al. Genetic diversity of Italian goat breeds assessed with a medium-density SNP chip. Genet. Sel. Evol. 47, 1–10 (2015).
7. Fratianni, S. & Acquaotta, F. The Climate of Italy 29–38 (Springer, 2017). https:// doi. org/ 10. 1007/ 978-3- 319- 26194-2_4. 8. Marino, R. et al. Climate change: production performance, health issues, greenhouse gas emissions and mitigation strategies in
sheep and goat farming. Small Rumin. Res. 135, 50–59 (2016).
9. Bertolini, F. et al. Signatures of selection and environmental adaptation across the goat genome post-domestication 06 biological sciences 0604 genetics. Genet. Sel. Evol. 50, 1–24 (2018).
10. Talenti, A. et al. Italian Goat Consortium: a collaborative project to study the Italian caprine biodiversity. In ASPA 22nd congress 75–76 (Italian Journal of Animal Science, 2017).
11. Kim, E. S. et al. Multiple genomic signatures of selection in goats and sheep indigenous to a hot arid environment. Heredity 116, 255–264 (2016).
12. Mdladla, K., Dzomba, E. F. & Muchadeyi, F. C. The potential of landscape genomics approach in the characterization of adaptive genetic diversity in indigenous goat genetic resources: a South African perspective. Small Rumin. Res. 150, 87–92 (2017). 13. Stella, A. et al. AdaptMap: exploring goat diversity and adaptation. Genet. Sel. Evol. 50, 61–61 (2018).
14. Beck, H. E. et al. Present and future Köppen-Geiger climate classification maps at 1-km resolution. Sci. Data 5, 1–12 (2018). 15. Nardone, A., Ronchi, B., Lacetera, N., Ranieri, M. S. & Bernabucci, U. Effects of climate changes on animal production and
sustain-ability of livestock systems. Livest. Sci. 130, 57–69 (2010).
16. Rojas-Downing, M. M., Nejadhashemi, A. P., Harrigan, T. & Woznicki, S. A. Climate change and livestock: impacts, adaptation, and mitigation. Clim. Risk Manag. 16, 145–163 (2017).
17. Rischkowsky, B. & Pilling, D. The State of the World’s Animal Genetic Resources for Food and Agriculture (Commission on Genetic Resources for Food and Agriculture, Food and Agriculture Organization of the United Nations, 2007).
18. Rochat, E. & Joost, S. Spatial areas of genotype probability (SPAG): predicting the spatial distribution of adaptive genetic variants under future climatic conditions. bioRxiv https:// doi. org/ 10. 1101/ 2019. 12. 20. 884114 (2019).
19. Mdladla, K., Dzomba, E. F. & Muchadeyi, F. C. Landscape genomics and pathway analysis to understand genetic adaptation of South African indigenous goat populations. Heredity 120, 369–378 (2018).
20. Riall, L. The Italian Risorgimento (Routledge, 2002). https:// doi. org/ 10. 4324/ 97802 03412 343.
21. R Development Core Team. R: A Language and Environment for Statistical Computing (R Foundation for Statistical Computing, 2020).
22. Krzywinski, M. et al. Circos: an information aesthetic for comparative genomics. Genom. Res. 19, 1639–1645 (2009).
23. Stucki, S. et al. High performance computation of landscape genomic models including local indicators of spatial association. Mol.
Ecol. Resour. 17, 1072–1089 (2017).
24. Caye, K., Jumentier, B., Lepeule, J. & François, O. LFMM 2: fast and accurate inference of gene-environment associations in genome-wide studies. Mol. Biol. Evol. 36, 852–860 (2019).
25. Yoshitane, H. et al. JNK regulates the photic response of the mammalian circadian clock. EMBO Rep. 13, 455–461 (2012). 26. Liu, H., Wang, T., Wang, J., Quan, F. & Zhang, Y. Characterization of Liaoning Cashmere goat transcriptome: sequencing, De Novo
assembly, functional annotation and comparative analysis. PLoS ONE 8, 1–11 (2013).
27. Fleming-Waddell, J. N. et al. Effect of DLK1 and RTL1 but not MEG3 or MEG8 on muscle gene expression in callipyge lambs.
PLoS ONE 4, e7399 (2009).
28. Seabury, C. M. et al. Genome-wide association study for feed efficiency and growth traits in U.S. beef cattle. BMC Genom. 18, 1–25 (2017).
29. Xu, Q., Lin, Y., Wang, Y., Bai, W. & Zhu, J. Knockdown of KLF9 promotes the differentiation of both intramuscular and subcutane-ous preadipocytes in goat. Biosci. Biotechnol. Biochem. 84, 1594–1602 (2020).
30. Dupré, S. M. et al. Identification of melatonin-regulated genes in the ovine pituitary pars tuberalis, a target site for seasonal hormone control. Endocrinology 149, 5527–5539 (2008).
31. Ibeagha-Awemu, E. M., Peters, S. O., Akwanji, K. A., Imumorin, I. G. & Zhao, X. High density genome wide genotyping-by-sequencing and association identifies common and low frequency SNPs, and novel candidate genes influencing cow milk traits.
Sci. Rep. 6, 1–18 (2016).
32. Crislip, G. R. et al. Differences in renal BMAL1 contribution to Na+homeostasis and blood pressure control in male and female mice. Am. J. Physiol. Ren. Physiol. 318, F1463–F1477 (2020).
33. Van Den Berg, I. et al. Concordance analysis for QTL detection in dairy cattle: a case study of leg morphology. Genet. Sel. Evol.
46, 1–14 (2014).
34. Nonneman, D. J. et al. Genome-wide association and identification of candidate genes for age at puberty in swine. BMC Genet.
17, 1–9 (2016).
35. Nawaz, M. Y. et al. Genomic heritability and genome-wide association analysis of anti-Müllerian hormone in Holstein dairy heif-ers. J. Dairy Sci. 101, 8063–8075 (2018).
36. Lin, S. C., Kuo, C. C. & Chan, C. H. Association of a BTLA gene polymorphism with the risk of rheumatoid arthritis. J. Biomed.
Sci. 13, 853–860 (2006).
37. Colussi, S. et al. A single nucleotide variant in the promoter region of the CCR5 gene increases susceptibility to arthritis encephalitis virus in goats. BMC Vet. Res. 15, 1–6 (2019).
38. Schultz, E. B. et al. Short communication: genetic parameter estimates for caprine arthritis encephalitis in dairy goats. J. Dairy Sci.
10, 6407–6411 (2020).
39. Epstein, P. R. Climate change and emerging infectious diseases. Microb. Infect. 3, 747–754 (2001).
40. Wang, Z. et al. Genome-wide association study for wool production traits in a Chinese Merino sheep population. PLoS ONE 9, e107101 (2014).
41. Silva, D. B. S. et al. Spliced genes in muscle from Nelore Cattle and their association with carcass and meat quality. Sci. Rep. 10, 14701 (2020).
42. Rubel, F., Brugger, K., Haslinger, K. & Auer, I. The climate of the European Alps: Shift of very high resolution Köppen-Geiger climate zones 1800–2100. Meteorol. Z. 26, 115–125 (2017).
43. Talenti, A. et al. A method for single nucleotide polymorphism selection for parentage assessment in goats. J. Dairy Sci. 99, 3646–3653 (2016).
44. Talenti, A. et al. The Valdostana goat: a genome-wide investigation of the distinctiveness of its selective sweep regions. Mamm.
Genom. 28, 114–128 (2017).
45. Chang, C. C. et al. Second-generation PLINK: rising to the challenge of larger and richer datasets. GigaScience 4, 7–7 (2015). 46. Browning, S. R. & Browning, B. L. Rapid and accurate haplotype phasing and missing-data inference for whole-genome association
studies by use of localized haplotype clustering. Am. J. Hum. Genet. 81, 1084–1097 (2007).
47. Milanesi, M. et al. BITE: an R package for biodiversity analyses. bioRxiv https:// doi. org/ 10. 1101/ 181610 (2017).
48. Alexander, D. H., Novembre, J. & Lange, K. Fast model-based estimation of ancestry in unrelated individuals. Genome Res. 19, 1655–1655 (2009).
49. Felsenstein., J. PHYLIP—Phylogeny Inference Package (Version 3.2) (1989).
50. Browning, B. L. & Browning, S. R. Improving the accuracy and efficiency of identity-by-descent detection in population data.
Genetics 194, 459–471 (2013).
51. Talenti, A. et al. Studies of modern Italian dog populations reveal multiple patterns for domestic breed evolution. Ecol. Evol. 8, 2911–2925 (2018).
52. Hijmans, R. J. Geographic Data Analysis and Modeling [R Package Raster Version 3.3-13]. (2020).
53. Hijmans, R. J., Cameron, S. E., Parra, J. L., Jones, P. G. & Jarvis, A. Very high resolution interpolated climate surfaces for global land areas. Int. J. Climatol. 25, 1965–1978 (2005).
54. SAS Institute Inc. JMP.
55. Kuhn, M. et al. Package ‘ caret ’ (2020).
56. Rellstab, C., Gugerli, F., Eckert, A. J., Hancock, A. M. & Holderegger, R. A practical guide to environmental association analysis in landscape genomics. Mol. Ecol. 24, 4348–4370 (2015).
57. Vajana, E. et al. Combining landscape genomics and ecological modelling to investigate local adaptation of indigenous Ugandan cattle to east coast fever. Front. Genet. 9, 385–385 (2018).
Acknowledgements
The authors thank all the researchers involved in the Italian Goat Consortium, the Italian National Association of Sheep and Goat breeders (ASSONAPA) and all the breeders for their availability in data, samples and infor-mation provision. The authors acknowledge support from the University of Milan through the APC initiative.
Author contributions
P.C., M.C., L.C., M.B., and A.T. conceived the study. M.C., P.C., M.B. and A.T. performed the analyses. AB, AN, and SF performed lab work. A.C., A.S., D.M., D.S., E.L., E.R., F.M.S., F.P., L.C., P.A.M., R.C., S.M., S.S., L.L. and P.C. provided samples. M.C., M.B., A.T., L.C. and P.C. contributed to data interpretation and drafted the manu-script. All authors reviewed and approved the final manumanu-script.
Competing interests
The authors declare no competing interests.
Additional information
Supplementary Information The online version contains supplementary material available at https:// doi. org/ 10. 1038/ s41598- 021- 89900-2.
Correspondence and requests for materials should be addressed to A.T. Reprints and permissions information is available at www.nature.com/reprints.
Publisher’s note Springer Nature remains neutral with regard to jurisdictional claims in published maps and institutional affiliations.
Open Access This article is licensed under a Creative Commons Attribution 4.0 International License, which permits use, sharing, adaptation, distribution and reproduction in any medium or format, as long as you give appropriate credit to the original author(s) and the source, provide a link to the Creative Commons licence, and indicate if changes were made. The images or other third party material in this article are included in the article’s Creative Commons licence, unless indicated otherwise in a credit line to the material. If material is not included in the article’s Creative Commons licence and your intended use is not permitted by statutory regulation or exceeds the permitted use, you will need to obtain permission directly from the copyright holder. To view a copy of this licence, visit http:// creat iveco mmons. org/ licen ses/ by/4. 0/.