University of Sassari Ph.D. School in Natural Sciences Via Muroni 25, I-07100 Sassari, Italy
Dissertation for the Degree of Doctor of Philosophy in Environmental Biology presented at Sassari University in 2016
XXVIII cycle
COMPARATIVE STUDIES OF ECOLOGICAL NICHE VARIATION AMONG
CENTRAL AND PERIPHERAL POPULATIONS OF MEDITERRANEAN
ENDEMIC PLANTS
PH.D. CANDIDATE: M. Guillaume Papuga DIRECTOR OF THE SCHOOL: Prof. Marco Curini Galletti
SUPERVISOR: Prof. Emmanuele Farris
Co-SUPERVISOR: Prof. John Thompson
University of Sassari Ph.D. School in Natural Sciences Via Muroni 25, I-07100 Sassari, Italy
Dissertation for the Degree of Doctor of Philosophy in Environmental Biology presented at Sassari University in 2016
XXVIII cycle
COMPARATIVE STUDIES OF ECOLOGICAL NICHE VARIATION AMONG
CENTRAL AND PERIPHERAL POPULATIONS OF MEDITERRANEAN
ENDEMIC PLANTS
PH.D. CANDIDATE: M. Guillaume Papuga DIRECTOR OF THE SCHOOL: Prof. Marco Curini Galletti
Remerciement
Ce travail n’aurait sans doute jamais pu aboutir sans l’aide de nombreuses personnes. Aussi, je tiens à remercier,
… Mes directeurs de thèse, pour m’avoir permis d’embarquer dans cette aventure, et m’avoir accordé leur confiance durant ces trois années. Merci Emmanuele pour ton regard critique sur mon travail, ainsi que ton aide au cours de mes (multiples) péripéties administratives. Merci John, pour ton apport tant scientifique qu’humain, qui m’a permis grandir dans le monde de la recherche.
… L’équipe du CEFE, tant Perrine pour ses relectures multiples et sa disponibilité, que Virginie, toujours prête m’aider dans de nombreuses tâches tout au long de ces trois ans. … L’administration de l’université de Sassari en la personne d’Elena Rossi, qui m’a aidé à gérer au mieux les aléas universitaires.
… L’ensemble des membres du CEFE pour leur accueil, et particulièrement les agents techniques de la PACE, du TE et de l’administration, qui m’ont permis de mener mes recherches dans les meilleurs conditions. D’une manière générale, j’ai grandement apprécié mon passage au CEFE, notamment pour la diversité et la sympathie des gens qu’on y croise, et qui confèrent à ce labo une atmosphère particulière. Aussi je remercie particulièrement les collègues de l’équipe DSSE et du département BC, avec qui j’ai pu interagir et qui ont tous à leur manière participé à ma formation.
… Olivier Thaler et Anne Charpentier, pour m’avoir permis d’entrer dans la communauté de l’écologie Montpelliéraine, et m’avoir encouragé à développer mon projet.
… Laurence Affre & Errol Véla pour avoir accepté de réviser mon travail en plein mois d’aout dans le cadre de mon diplôme européen. Votre disponibilité me fut d’une grande aide.
l’équipe du CBN Med (Frederic Andrieu, James Molina, Olivier Argagnon, Guilhem De Barros) qui a toujours répondu présent à mes sollicitations. Je remercie également l’ensemble des botanistes et écologues de terrain qui m’ont fourni des localisations de populations, si précieuses pour la réussite de mon travail : Juan Arroyo, Simonetta Bagella, Benoit Bock, Giacomo Calvia, Per Fraga i Arguimbau, Maria Begona Garcia (et toute l’équipe de l’IPE), Philippe Geniez, Emilio Laguna, Javier Lopez-Alvarado, Gonzalo Mateo Sanz, Daniel Pavon, Lorenzo Peruzzi, Leonardo Rosati, Lloenç Saez Gonalons, Enrique Sanchez Gullon, Rocio Santos, Rémi Souche, Xavier Font. Un grand merci à Regina Berjano & toute sa famille pour son accueil à Séville, son investissement et son intérêt pour ma thèse.
Qu’on se le dise au fond des ports, mon travail n’aurait pas été si agréable sans la présence des copains, toujours prêt à partir en rando, se vider l’esprit le week-end venu. Ces mêmes copains, tout aussi prompts à explorer les ruelles de Montpellier (parfois jusqu’au bout de la nuit), ou simplement discuter autour d’un thé au 3e. Je pense en particulier aux copains du bureau : Carole (et Bobdy), Marie et Aurélien qui ont partagé (de force) des bouts de mon quotidien.
L’incontournable bande du 3e étage, avec Sophie, Louise, Nico (et toute la petite famille), Fede, Michel, Hugo, Rémi, mais aussi Clémence, Alice, Soizic, Sophie, Laeti, John, Isma, Fabien, Simone & Alfredo, et tant d’autres. Une pensée aussi pour Sam, pour les mails de 6 pages et les centaines d’articles lus pour cette sacrée review, quelle aventure ! Une pensée également pour les copains de l’Isem, Max et Julien, Vincent pour son sens aigu de la critique, mais aussi Pierre, Lucas et Hugo, et tous les collègues IEGBiens avec qui j’ai partagé
ma curiosité envers le monde vivant, en particulier Nico Simler & Rémi Collaud, Freddy Ritz, Jean Marie Weiss, et Jacques Lagabrielle.
Je remercie mes parents pour m’avoir permis d’aller au bout de ce projet (c’est long 24 ans d’études…), et m’avoir soutenu en toute circonstance.
Enfin, je réserve ces derniers mots à Marine, pour avoir accompagné, encouragé, aidé, tout au long de ce travail.
Index
SUMMARY ... 2
RIASSUNTO ... 3
INTRODUCTION ... 4
CHAPTER 1: Geographic variation in genetic and demographic performance: new insights from an old biogeographical paradigm ... 10
Setting the scene ... 11
Introduction ... 11
History of the “centre-periphery hypothesis” ... 15
Global survey and meta-analyses ... 23
Paper selection ... 23
Data collection ... 24
Statistical analyses ... 26
The “centre-periphery hypothesis”: an overview ... 27
Multiple approaches ... 27
General results ... 29
Plant – animal differences ... 38
Limitations associated with sampling methods ... 41
Geographically peripheral or ecologically marginal? ... 46
Are peripheral populations ecologically marginal? ... 46
Ecological marginality and genetic and demographic variation ... 49
Centre-periphery or rear-leading edge? ... 53
Disentangling the dichotomy ... 53
Historical range dynamics ... 58
The effect of species chorology ... 60
A new multifaceted framework ... 63
Conclusions ... 68
CHAPTER 2: Range-wide variation in the ecological niche and floral polymorphism of the western Mediterranean geophyte Narcissus dubius Gouan ... 70
Introduction ... 71
Material and methods ... 75
Floral polymorphism ... 82
Results ... 84
Climate analysis and projected past distribution ... 84
Microecological niche ... 87
Floral polymorphism ... 91
Discussion ... 95
Ecological niche variation ... 95
Loss of the floral polymorphism in peripheral populations ... 97
Insights from the recent history of N. dubius ... 100
Conclusion ... 103
CHAPTER 3: Ecological niche differentiation in peripheral populations: a comparative analysis of Mediterranean plants at their northern range limits ... 104
Introduction ... 105
Material and methods ... 108
Species and populations selection ... 108
Field and data-base examination of the macro niche ... 112
Field investigation of fine-scaled niche characteristics ... 112
Soil analysis... 113
Statistical analyses ... 114
Results ... 116
Field and data-base examination of the macro niche ... 116
Field investigation of fine-scaled niche characteristics ... 119
Discussion ... 127
Ecological originality of peripheral populations ... 128
Ecological differentiation and species divergence ... 131
Conservation value of peripheral populations ... 133
CHAPTER 4: Climatic niche and distribution patterns of peripheral isolates in Mediterranean plants ... 136
Introduction ... 137
Material and methods ... 139
Data collection ... 139
Climatic niche ... 142
Distribution patterns ... 147
Historical climate ... 150
Discussion ... 153
Niche and dispersal limitation in peripheral populations ... 153
Description of the geographical distribution of peripheral isolates in France ... 155
Conservation value ... 158
CHAPTER 5: Linking ecological factors and position across the range to explain local abundance of 11 Mediterranean plants... 160
Introduction ... 161
Material and methods ... 163
Species selection ... 163 Sampling ... 164 Statistical analyses ... 166 Results ... 167 Discussion ... 171 Methodological issue ... 171
Global differences between centre and periphery in plant cover ... 172
Annual plants abundance variability in space and time ... 173
Impact of range position on local-abundance ... 173
Interactions between local and climatic ecological factors ... 174
Conclusion ... 175
DISCUSSION ... 176
The ecological niche ... 178
The theory ... 178
The concept of the niche and spatial limitation ... 179
Spatial patterns in the realized niche of plant ... 181
Toward a roadmap for studying rangewide patterns of plant performance ... 183
The ecological niche and processes underlying contemporary patterns of plant diversity in the Mediterranean region ... 184
The origin of floral biodiversity in the Mediterranean basin ... 184
The importance of protecting peripheral isolates ... 188
Integration of peripheral isolates in conservation processes ... 189
France, a crossroad for plant conservation in the Mediterranean ... 191
Conclusion and perspectives ... 196
BIBLIOGRAPHY ... 199
University of Sassari Ph.D. School in Natural Sciences Via Muroni 25, I-07100 Sassari, Italy
Figure 1-1. An overview of the CPH empirical literature. ... 28 Figure 1-2. Relationship between species’ geographical range and their ecological niche. ... 48 Figure 1-3. Testing how different ecological conditions discriminate between high and low values of genetic diversity, abundance, population performance, and size of individuals. .... 52 Figure 1-4. The dichotomy between Centre-Periphery and Rear-Leading Edge hypotheses. . 57 Figure 1-5. Impact of glaciations on the distribution of species genetic diversity. ... 59 Figure 1-6. Distribution of genetic diversity according to species biogeographic origins. ... 63 Figure 1-7. A proposed multifaceted framework for the distribution of species genetic and demographic performance. ... 67 Figure 2-1 Distribution of the 363 locations of Narcissus dubius compiled from four different data sources. ... 77 Figure 2-2.Floral measures made on flowers of the long-styled morph of Narcissus
dubius. ... 84
Figure 2-3. Principal component analysis of climate data for all known population locations (gray dots). ... 86 Figure 2-4. Modeled probability of occurrence of Narcissus dubius. ... 87 Figure 2-5. Mean values per quadrat of abiotic and biotic features of the ecological niche of Narcissus dubius that show significant variation among central and peripheral populations. ... 90 Figure 2-6. Ecological niche variability of central and peripheral populations of Narcissus dubius among quadrats within populations (a) and among populations (b). ... 91
populations of Narcissus dubius across its distribution in the western Mediterranean. ... 92 Figure 2-8. Floral biology of the long-styled morph of Narcissus dubius in central (C) and peripheral (P) populations in France and Spain. ... 94 Figure 3-1. Distribution maps of the 11 studied species in the western Mediterranean basin. ... 110 Figure 3-2. Mean (a) and range (b) altitude values (m) of central and peripheral populations of 11 Mediterranean plant species. ... 119 Figure 3-3. Soil characteristics, abiotic and biotic cover variables that show overall significant differences (Table 4) among central and peripheral populations of 11 Mediterranean plant species. ... 124 Figure 3-4. Comparison of levels of variation in niche components among central and among peripheral populations of 11 Mediterranean plant species. ... 127 Figure 4-1. Altitude and Bioclim climatic characteristics for all central (X axis) and peripheral (Y axis) populations of 11 Mediterranean plants included in our database. ... 144 Figure 4-2. Climatic niche of 11 Mediterranean plants on the first two axes of a Principal Component Analysis of the Mediterranean climate in the Western Mediterranean basin. . 146 Figure 4-3. Distribution of Mediterranean plants represented in France in a 10*10km grid. ... 148 Figure 4-4. Distribution patterns of species in each of the three areas where an aggregation in their distribution is observed (west, middle and east groups). ... 150 Figure 4-5. Distribution of the Mediterranean climate in southern France. ... 152 Figure 5-1. Mean local abundance of eleven plant species for five central (X axis) and five
niche of a species. ... 181 Figure 6-2. Relationship between population niche and species niche. ... 183 Figure 6-3. Relative conservation value of peripheral populations from an evolutionary perspective. ... 190
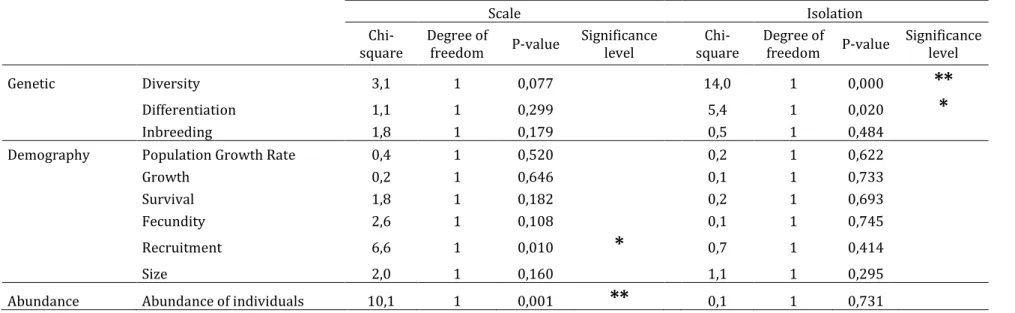
Table 1-1. The numbers of studies (a total of 248 sampled papers) and tests (a total of 813 tests) that exhibit significant or non-significant differences between central and peripheral populations for the different groups of species’ parameters. ... 37 Table 1-2. The numbers of tests that exhibit significant or non-significant differences in genetic diversity and abundance of individuals between central and peripheral populations for different groups of organisms. ... 40 Table 1-3. Generalized linear model (GLM) of the correlation between the CPH validation and “scale” and “isolation” variables. ... 45 Table 2-1. Results of the Principal Component Analysis ... 86 Table 2-2. Chi-square values and significance tests for the analysis of deviance of abiotic and biotic components of the ecological niche of Narcissus dubius in central (C) and peripheral (P) populations in Spain and southern France. ... 89 Table 2-3. Chi-square values and significance tests for the analysis of deviance of corolla size and relative stigma anther separation and ANOVA table for frequency of individuals with stigma above the anthers for the long-styled morph of Narcissus dubius in central (C) and peripheral (P) populations in Spain and southern France. ... 95 Table 3-1. List of studied species, their biological features and distances among sampled populations. ... 111 Table 3-2. The different broad habitat types occupied by the 11 study species in five central (C) and five peripheral (P) populations. ... 117 Table 3-3. The altitudinal range of the 11 studied species based on population locations in
populations in eleven Mediterranean plant species. ... 121
Table 3-5. Comparative analysis of niche variability between central (C) and peripheral (P) populations in eleven Mediterranean plant species. ... 126
Table 4-1. Results of the Principal Component Analysis. ... 147
Table 5-1. Description of studied species. ... 164
Table 5-2. Ecological variables used in the study to characterize the ecological niche. ... 165
Table 5-3. Comparison of mean abundance between central and peripheral populations for each species separately. ... 168
Table 5-4. Correlation between variation in plant local abundance, ecological features of the plant micro-niche and regional climatic variables in central and peripheral populations of 11 Mediterranean plant species. ... 170
Box 1-1. The centre-periphery hypothesis, a polymorphic concept. ... 14 Box 6-1. The ecological niche and the reintroduction of listed species ... 193 Box 6-2. A reintroduction program for peripheral isolates of Convolvulus lanuginosus ... 195
SUMMARY
The Mediterranean basin is a biodiversity hotspot for plants and is characterized by its high richness and endemism. Species distribution patterns are often complex and disjunct due to the geological patchwork and climatic history. Thus, it represents a place of prime interest to test robustness of biogeographical hypotheses, which may in the end bring insights on mechanisms that drive plant diversity. Among them, the centre-periphery hypothesis (CPH) is a corner stone of biogeography and has stimulated an important amount of work through the past 50 years. Here we show that empirical evidences have brought little support to it as a general rule, suggesting that complex eco-evolutionary mechanisms shape range wide variation of genetic and demographic characteristics. While the CPH relies on the assumption of a concordance between geographic periphery and ecological marginality, this PhD thesis proposes a new framework that supports the need of a precise evaluation of species history, geography and ecology in order to investigate genetic and demographic variation.
In this perspective, we set up a comparative study of 11 Mediterranean vasculat plants to investigate changes in the micro-ecological niche between central and peripheral populations of species reaching their northern limit in southern France. Despite growing in similar broad habitat, we showed that several shifts appeared when analyzing fine scale ecological characteristics, which emphasized the ecological originality of peripheral population. Those peripheral populations subsist in cooler and wetter climate compared to their mean central relatives, but cannot be considered marginal regarding the global climatic niche of each species. Several species presented similar distribution patterns on restricted areas in France, and we discuss ecological and historical drivers of their distribution, in particular their persistence at the periphery of their range during Pleistocene glaciations. This historical perspective was also fundamental to explain range wide patterns of floral polymorphism observed in more widely distributed species (i.e. Narcissus dubius).
Due to their spatial isolation and ecological originality, peripheral isolates have a high evolutionary potential, which emphasizes their conservation value. Here we show that understanding fine scale ecological characteristics and distribution history is essential to shed light on processes driving plant diversity in the Mediterranean.
KEY WORDS: Mediterranean plant, ecological niche, centre-periphery hypothesis, range limit, ecological marginality, glacial refugia, rear leading edge, climatic transition, floral polymorphism
RIASSUNTO
Il Bacino Mediterraneo è un hotspot di biodiversità vegetale ed è caratterizzato da elevata ricchezza specifica e alto tasso di endemismi. I pattern distributivi sono spesso complessi e presentano areali disgiunti, a causa della complessa storia geologica e climatica del bacino. Perciò, esso rappresenta un’area di primario interesse per testare ipotesi biogeografiche, che potrebbero in ultima analisi fare luce sui meccanismi che condizionano la diversità ed evoluzione delle piante mediterranee. Tra queste, la cosiddetta “centre-periphery
hypothesis” (CPH) è una pietra angolare della biogeografia ed ha stimolato un’enorme
quantità di lavori scientifici negli ultimi 50 anni. In questo lavoro dimostriamo come le evidenze empiriche hanno supportato solo debolmente questa ipotesi come regola generale, suggerendo che complessi meccanismi eco-evolutivi plasmano la variazione delle caratteristiche demografiche e genetiche all’interno delle aree distributive delle specie. Mentre la CPH si basa sull’assunto di una concordanza tra la periferia biogeografica e la marginalità ecologica, questa tesi dottorale propone un nuovo punto di vista che si basa sulla necessità di una precisa valutazione della storia, geografia ed ecologia delle specie per investigare in maniera appropriata le variazioni genetiche e demografiche.
In questa prospettiva, è stato impostato uno studio comparativo di 11 piante vascolari mediterranee per verificare differenze nella nicchia micro-ecologica tra le popolazioni centrali e periferiche di specie che hanno il loro limite distributivo settentrionale nella Francia meridionale (popolazioni periferiche) e il centro della loro distribuzione nelle penisole iberica e/o italiana (popolazioni centrali). Sebbene crescano negli stessi habitat, sono state evidenziate diverse variazioni grazie alle analisi di dettaglio delle caratteristiche ecologiche, che hanno enfatizzato l’originalità ecologica delle popolazioni periferiche. Queste persistono in climi più freschi e umidi rispetto alle popolazioni conspecifiche localizzate al centro dell’areale, ma non possono essere considerate marginali riguardo alla nicchia climatica globale di ciascuna specie in studio. Diverse specie presentano una distribuzione simile su piccole aree in Francia, e pertanto in questa sede si è ritenuto interessante discutere e approfondire i fattori storici ed ecologici che determinano questi pattern distributivi assai simili tra specie diverse, in particolare la loro persistenza alla periferia del loro areale durante le glaciazioni pleistoceniche. Anche questa prospettiva storica è stata fondamentale per spiegare variazioni del polimorfismo fiorale osservate in tutto l’areale di specie a distribuzione più ampia come il Narcissus dubius.
Grazie al loro isolamento spaziale e originalità ecologica, le popolazioni periferiche hanno un alto potenziale evolutivo, che incrementa il loro valore conservazionistico. In questa ricerca dimostriamo che la comprensione delle caratteristiche ecologiche a scala di dettaglio e della storia distributiva è essenziale per fare luce sui processi che determinano la diversità vegetale nel Mediterraneo.
PAROLE CHIAVE: centre-periphery hypothesis, limite di areale, limite distributivo meridionale, marginalità ecologica, nicchia ecologica, piante vascolari mediterranee, polimorfismo fiorale, rifugi glaciali, transizione climatica.
The existence of range limits - geographical boundaries where populations of a species cannot (or have not) establish further - is the outcome of an interactive range of processes that have fascinated ecologists for a long time. Such range limits provide the opportunity to explore questions on processes existing between organisms, their life history traits, and their interactions with their surrounding environment.
Individual fitness and population demographic parameters can vary across the range, from places where they perform best to boundaries where populations may struggle to survive. This idea of a gradual decline in fitness gave birth to the so-called “centre – periphery hypothesis” (CPH), early in the 1980’s (Hengeveld & Haeck 1982; Brown 1984). This general framework has been declined into several hypotheses that relate to three main patterns of trait variation across a species range: 1) changes in the spatial genetic structure of populations, 2) variation in demographic parameters, and 3) variation in abundance and occurrence of populations. Trait variations are related to differences in the ecological characteristics of the habitat occupied by a species that are supposed to delimit species’ range.
As empirical data have accumulated on geographical patterns, the CPH has appeared to be rather more complex than first predicted. The interplay between metapopulation dynamics, ecological constraints and historical processes of range contraction and expansion have played a major role in shaping trait variation as species reach their range limits. Moreover, ecological and evolutionary processes may act differently regarding traits that are considered. Therefore, the need to disentangle those processes is important to better understand the mechanisms that drive population variation across a species range.
Also, there has been rather an amalgam between ecological marginality and geographical periphery in attempts to explain mechanisms driving CPH patterns. Indeed, this issue has received much criticism (Soulé 1973; Hardie & Hutchings 2010), and it remains unclear about whether ecological niche differences occur as species reach their range limits. This constitutes a major issue for our understanding of spatial patterns of trait variation in peripheral populations.
The CPH has been subject to much empirical investigation, although there is much bias towards studies that have focused on the northern edge of temperate taxa distributions in the northern hemisphere (Eckert, Samis & Lougheed 2008). This restriction to a particular case where temperate species face colder climates, and places that they have recolonized quite recently limits our comprehension of the underlying processes. Therefore, there is a need to diversify empirical studies to get clearer insights on the hypothesis. In this context, the Mediterranean climate region represents a setting of prime importance to understand the underlying mechanisms, as most of them were less impacted by ice sheet during Pleistocene glaciations, which strongly influenced range contraction and extension (Blondel
et al. 2010). The Mediterranean basin provides a large number of potential study species
due to the high richness and endemism of its flora, with distribution ranging from rare to widespread taxa (Thompson 2005). Its complex spatial configuration, with several geographical and ecological barriers, induces disjunct distributions with the persistence of isolates throughout and beyond the principal range (Comes 2004). The relative stability of climatic conditions during last glaciations and the absence of a large permanent ice sheet have allowed the persistence of a wide variety of taxa, both Mediterranean and non-Mediterranean, in locally restricted areas across a large part of the region, making the
Mediterranean Basin the third most important biodiversity hot-spot for vascular plants in the world (Myers et al. 2000).
In this context, this thesis attempts to obtain insights on the CPH, in particular in respect to possible ecological niche variation among central and peripheral populations, of Mediterranean plant species. The objectives here relate to five main questions.
Question 1. What can we learn from the empirical literature dealing with the centre-periphery hypothesis, and what does it tell us regarding the importance of ecological niche in large-scale processes? The first aim of this work was thus to make a global review on what is known about the CPH. Despite an important amount of empirical tests realized in the last two decades all around the world, no synthesis of this work had been undertaken to provide a broad view of the degree to which the above hypothesis has been confirmed or refuted and the contemporary challenges and issues related to the central peripheral hypothesis. Through a wide analysis of the literature we made an update of what has been published on the topic until now, and attempted to clarify various aspects of the CPH, in particular any biases which may influence global patterns of genetics, ecology and demography in central and peripheral populations. We paid particular attention to the need to disentangle ecological, geographical and historical processes that shape species traits across their range.
Question 2. How do history, ecology and range structure interact to shape current patterns of ecological and genetic variation? How does such variation relate to possible reproductive traits variation? To answer these questions we studied variation in the expression of a floral
polymorphism and the ecological niche of Narcissus dubius, a western Mediterranean endemic geophyte, in regards to its contemporary and historical distribution in potential refugia in the Mediterranean area. We investigated how past distribution and ecological conditions may have contributed to contemporary patterns of floral variations among central and peripheral populations.
Question 3. Do species in a given region show similar patterns of ecological niche variation among central and peripheral populations? In particular: do micro-ecological features show repeated variation at the distribution limits? To answer these questions, we conducted a comparative analysis of variation in the ecological niche in central and peripheral populations of 11 Mediterranean plant species. This study represents a completely original cross taxa analysis of 11 species in their southern more central populations and their peripheral populations at the northern limits of their distribution in the Mediterranean climate region of France. Our emphasis here was on detecting any potential patterns of ecological originality where species persist at their northern distribution limit.
Question 4. How does the climatic niche vary across species range in a Mediterranean context? In particular, are peripheral populations climatically marginal regarding their entire climatic niche? To answer those questions we compared the climatic niche of 11 species previously studied in chapter 3 at their northern range limit in France, with populations located in the central part of their range. We also investigated whether other species shared a similar distribution pattern, and discuss the ecological drivers that limit species distribution.
Question 5. How do ecological factors interact across species range to shape local abundance? To answer this question we used data collected in chapter 3 and 4 and performed a global analysis to disentangle the impact of climatic variables, micro-ecological factors and position across the range on local abundance. We also proposed a new framework to investigate mechanisms that shape plant abundance.
Finally, we discuss those five questions together to bring insights on niche variation in a centre-periphery context. We conclude this thesis with a discussion on the place of peripheral isolates in conservation.
CHAPTER 1: Geographic variation in
genetic and demographic performance:
new insights from an old biogeographical
paradigm
Distribution of abundance of the Indigo Bunting, extracted from Brown 1984
To be cited as:
Pironon S.*, Papuga G.*, Villellas J., Angert A.L., García M.B., Thompson J.D. (submitted) Geographic variation in genetic and demographic performance: new insights from an old biogeographical paradigm. Biological review. [*Both authors contributed equally to this work]
Setting the scene
Introduction
Biogeography is a science that seeks to understand patterns in the distribution of traits, species, communities and ecosystems in space and time (Brown & Lomolino 1998). It aspires to identify where species occur, how they perform at distinct locations and the spatial, ecological, historical factors that explain such variation in occurrence and performance. The discipline of biogeography thus provides a basis for the investigation of the processes that generate, maintain, and threaten biodiversity (Gaston 2000, 2003).
The “centre-periphery hypothesis” (hereafter the CPH) is a major biogeographical paradigm that aims to explain the variation in demographic, genetic and ecological characteristics of species across their distribution ranges, and ultimately, the causes of their range limits (Gaston 2009a; Sexton et al. 2009). Based on the assumption that the range of a species is a geographical representation of its ecological niche, the CPH postulates that environmental conditions are optimal near the center of the range and harsher at the periphery (Brown 1984). It also holds as a major tenet that populations are more isolated and less abundant near the range limits of a species (Hengeveld & Haeck 1982; Brown 1984). Ecological marginality, lower demographic performance and higher isolation are in turn predicted to cause a decrease in genetic diversity within populations (Soulé 1973; Lawton 1993) and an increase in genetic differentiation among populations (Da Cunha, Burla & Dobzhansky 1950; Mayr 1963; Eckert et al. 2008).
Many biogeographic studies have produced results that adhere to the predictions of the CPH, which has become a sort of “general principle” for several authors (Hengeveld & Haeck
used to test ecological and evolutionary hypotheses (Holt & Keitt 2005; Sagarin, Gaines & Gaylord 2006). Conservation scientists have also used ideas of the CPH to assess the pertinence of conservation priorities (Lesica & Allendorf 1995; Gibson, Van Der Marel & Starzomski 2009; Thompson, Gaudeul & Debussche 2010; Rehm et al. 2015). In the last 15 years, there has been a series of attempts to assess the validity of the CPH for genetic and demographic features (Sagarin & Gaines 2002; Eckert et al. 2008; Sexton et al. 2009; Abeli et
al. 2014). Although genetic diversity and differentiation appear to frequently follow
predictions of the CPH (Eckert et al. 2008), abundance and other demographic vital rates (e.g. survival, fecundity) do not generally follow the expected pattern (Channell & Lomolino 2000; Sagarin & Gaines 2002; Sexton et al. 2009; Abeli et al. 2014). However, whether there actually is deterioration in environmental conditions towards the periphery of species ranges is frequently overlooked. This is despite the fact that the CPH could not stand if geographically peripheral populations were proven not to be ecologically marginal (Soulé 1973; Chardon et al. 2014). In addition, given that environmental conditions and species ranges change over time, populations currently considered to be ecologically or geographically central may have been marginal in the past, and vice-versa. For this reason, historical centre-periphery gradients, considering stable refuge areas (rear edge) as the “center” and recently colonized areas (leading edge) as the “periphery”, may provide a more accurate context in which to analyze patterns of genetic variation (Cain 1944; Hampe & Petit 2005; Carnaval et al. 2009) and/or demographic performance (Adams 1902; Hampe & Petit 2005).
The concepts of geographic centrality, ecological marginality, and center of origin have all been used in the CPH literature (Brown 1984; Hampe & Petit 2005; Kawecki 2008), but the
interactions between geographical, ecological, and historical gradients have been rarely studied. At the same time, lumping different gradients into the general category of centre-periphery gradients might lead to misconceptions of the factors affecting the distribution of genetic variation and demographic performance (Pironon et al. 2015). Furthermore, the CPH assumes that genetic and demographic features are interdependent, and thus that they show the same centre-periphery pattern of variation (Carson 1959; Brussard 1984; Eckert et
al. 2008). However, this assumption is contradicted by the fact that the CPH has been
validated previously for genetic variation (Eckert et al. 2008) but not for spatial patterns of demographic rates (Sagarin & Gaines 2002; Sexton et al. 2009; Abeli et al. 2014). Merging species’ information for the different components of the CPH would help clarify such incoherence. Finally, it has been proposed that the CPH might only be valid for some particular organisms, or in a subset of biogeographical regions, or at certain spatial scales, but very few studies have attempted to address this issue (Sagarin et al. 2006; Eckert et al. 2008).
Box 1-1. The centre-periphery hypothesis, a polymorphic concept.
In this paper, we first trace the long and complex history of the CPH by reviewing pioneer Despite the common framework shared by the studies we review here, the naming of the hypothesis is variable. For the 248 papers that we selected, 168 (67%) did not explicitly name the hypothesis, although their aim was in fact to test some of its predictions. In the remaining 33%, three names were most commonly used: the abundant-centre (47%), the central-marginal (24%), and the centre-periphery (15%) hypotheses. In addition, several authors used various other terms to name the hypothesis (e.g. core-periphery, Carson’s, Brown’s hypothesis, etc.).
In a seminal publication, Brown (1984) introduced the “abundant-centre” hypothesis. Although it refers explicitly to abundance patterns, it has been invoked to underlie variation in other parameters in a centre-periphery context. In our study, we restrict usage of this term to the specific domain of abundance. The word « margin » has been used to refer to both ecological marginality (Soule, 1973; Farris & Schaal, 1983) and geographical marginality (Arana et al., 2010; Doudová-Kochánková et al., 2012). The latter is confusing because geographical and ecological gradients are not necessarily concordant (Soule, 1973; Pironon et al., 2015, see further discussion in IV.1.). For clarity, we prescribe the use of the term “centre-periphery hypothesis” when studying the geographical distribution of genetic and demographic performance, and restrict the use of “central-marginal” gradients to strictly ecological considerations (Shreeve, Dennis, & Pullin, 1996; Hardie & Hutchings, 2010).
results of previous partial reviews, and linking the genetic and demographic patterns into a single overall analysis. This analysis aims to tackle a range of taxonomic, biogeographic, and methodological issues that had been raised in previous reviews. In addition, our study also differs from previous reviews in that 1) we evaluate whether the first assumption of the hypothesis is always checked and verified (i.e. environmental conditions become more marginal towards the range periphery), and 2) we attempt to disentangle the relative effects of geographical, ecological and historical centre-periphery gradients on the distribution of genetic variation and demographic performance. This critical assessment of the CPH allows us to better understand geographic patterns and the causes of species range limits, as well as the relative conservation value and vulnerability of central and peripheral populations.
History of the “centre-periphery hypothesis”
The pioneers (1900-1950)
The analysis of variation in species’ properties across the geographical range has a long history. Right from the early days of such work, there has been a marked dichotomy between two lines of inquiry, one concerning the general performance of populations or individuals, and the other concerning genetic variation.
The idea that species become rarer and perform worse at their range margins due to less optimal environmental conditions can be found in the scientific literature since at least the 19th century. For instance, (Darwin, 1859, pp. 69-78) discussed ”the rigour of the climate […] on the confines of the geographical range” of taxa, and noted that “some species [were] gradually getting rarer and rarer, and finally disappearing” along geographical gradients. The basis for the study of geographic distribution limits was also being laid at that time (Wallace
1876). Specific interest in the issue of geographic variation in species’ demographic performance across regions arose in the early 20th century. (Adams 1902) first proposed that species’ abundance would be highest in their historical centers of origin. Simultaneously, other authors suggested that the centers of species’ abundance could be defined by optimum ecological conditions, mainly climate (Cowles 1901; Transeau 1903, 1905; Shelford 1911). For example, (Cowles, 1901, p. 83) claimed that “each species varies in habitat in different regions, and […] in general a species can grow in the largest number of plant societies at its center of distribution, since there the climatic conditions favor it most highly”. Similarly, (Transeau, 1905, p. 877) stated that species were most abundant in the centers of distributions, where “the complex of climatic factors most favorable to the development of this type of vegetation is […] localized and that as we depart from such centers we find conditions more and more unfavorable”. Additionally, it was acknowledged that species had great difficulties in establishing beyond their required environmental conditions, with only “accidental” occurrences outside of a species’ range (Grinnell 1922). Beyond abundance, some studies also found a lower individual performance in marginal populations of both animal and plant taxa, especially in terms of reproductive output (Salisbury 1926; Filipjev 1929). However, these pioneer studies were, not surprisingly, plagued with difficulties that hampered the production of meaningful conclusions, such as a frequent focus on vegetation units or communities rather than single species (but see Gleason, 1926) and scarce or, at best incomplete, data across the range of a given species (Griggs 1914; Salisbury 1926).
The interest in variation of species’ genetic characteristics across their ranges also arose early in the 20th century, albeit slightly later and rather independently of demographic
studies. The investigation of genetic patterns was first framed in a historical context of species’ migrations and dispersal rather than in a static geographical perspective. Before intraspecific studies emerged, Adams (1902) had predicted higher species richness in the historical centers of origin of taxonomic clades. Later, several authors noted differences across species ranges in the abundance of varieties and genetic polymorphism. (Vavilov, 1926, p. 175) stated that “the basic centers of origin of cultivated plants appear, as a rule, to be found where a striking diversity of types is accumulated”, and (Turrill, 1939, p. 230) observed that “towards the margins of their migrations species are less polymorphic” referring to wild plants. Notably, both authors acknowledged the existence of exceptions due to disturbing factors like geographical barriers.
To explain these patterns, it was proposed that species would suffer random losses in allele diversity in the course of colonization events or range expansion (Reinig 1938). At this time, the historical centers of species origin, associated with increased polymorphism, were explicitly differentiated from the centers of highest abundance (and highest individual size), which were in turn related to climatic favorability (Cain 1944). There were also early mentions of the existence of “marked variational forms” (i.e., greater genetic differentiation) in the geographic periphery of species’ distributions, especially at the rear edge due to environmental stress (Good 1931). Of course these pioneer studies were based on observations of phenotypic variation, due to the lack of appropriate genetic tools at that time.
Towards the formulation of hypotheses (1950-1990)
Ordination studies of vegetation in the 1950’s and 1960’s provided the first detailed data on intraspecific variation in abundance (Curtis & McIntosh 1951; Whittaker 1956, 1960; Monk 1965). With exceptions, these studies revealed that bell-shaped curves of abundance were very common along environmental gradients (Austin, 1976). This discipline, however, was frequently focused on the relative abundance of individuals of each species within the communities, and analyzed environmental or geographical gradients of local extent rather than across whole distribution ranges.
In the early 1980’s, data on species’ distribution and abundance were increasingly available in the form of atlases, flora and more conventional studies, which allowed the first general assessments of the CPH in different taxonomic groups. Two influential papers (Hengeveld & Haeck 1982; Brown 1984) proposed that patterns of higher abundance of individuals in range centers could be a general phenomenon. Haeck & Hengeveld (1981) attributed this pattern to an optimum-response surface, in which environmental conditions approach physiological optimum in the range centre. Brown (1984) proposed a more mathematical explanation in which the effects of multiple, independently varying environmental factors define the ecological niche with a bell-shaped curve. Although these authors acknowledged the underlying influence of the environment, they clearly emphasized the existence of a geographical pattern, unlike previous studies. Since then, much research has been carried out on animal and plant species to test what has become known as the “abundant-center hypothesis” (Carter & Prince, 1985; Caughley et al., 1988; Carey, Watkinson, & Gerard, 1995; Curnutt, Pimm, & Maurer, 1996; Blackburn, Kevin. J. Gaston, et al., 1999).
In addition to changes in abundance, many authors began reporting, mostly on insect taxa, higher extinction risk and demographic variability in populations at range edges due to poor
environmental conditions (Birch, 1957; Nicholson, 1958; Richards, 1961; Whittaker, 1971; but see Grant & Antonovics, 1978). This could be explained by a higher susceptibility of peripheral populations to density-independent factors (Gaston 1990). However, higher demographic variability was also predicted for central (larger) populations (May 1981). Despite a growing consensus for central populations to have higher abundance and population growth rates (Mayr 1963; Soulé 1973), some authors showed that not all vital rates decline towards range margins, even when abundance is greatest at the center (Maurer & Brown 1989). Hence, the expected CPH pattern was demonstrated for some but not all demographic properties even within a given species.
• Genetic variation
Advances in genetics stimulated the analysis of patterns in genetic variation across species ranges in the 1950’s, especially on Drosophila species. Interestingly, although geographical peripherality and ecological marginality were commonly associated, at that time authors emphasized the ecological status of populations rather than their geographical location to explain genetic patterns. A general pattern of a reduced chromosomal polymorphism in marginal populations began to emerge (Da Cunha et al. 1950; Townsend Jr 1952; Carson 1955; Goldschmidt 1956; Stalker 1964). Cunha et al. (1950) highlighted the role of habitat diversity in promoting genetic variation, whereas Carson (1955, 1959) argued that selection in more fluctuating peripheral populations would favor chromosomal monomorphism, which allows higher flexibility for recombination. Likewise, most early studies on allelic diversity in animals suggested higher polymorphism in central populations (reviewed in Mayr, 1963; Soule, 1973). These authors discussed the relative influence of stochastic processes, induced
by spatial isolation and reduced gene flow, and strong selection, in marginal locations. However, some animals, such as Drosophila species, showed no reduction in allelic diversity in marginal populations (Soulé 1973), a result that was attributed to a homogenizing effect of high connectivity among populations of vagile taxa. In addition, some authors highlighted the potential differences in centre-periphery patterns between the commonly measured neutral markers, more affected by stochastic processes, and traits that better reflect the action of natural selection (Brussard 1984). Finally, besides trends in within-population genetic diversity, evolutionary biologists began to exhibit more interest in the possibility of greater genetic differentiation among peripheral populations (in more isolated areas with less gene flow) (Mayr et al. 1954; Brown 1957; Mayr 1963).
Thus, unlike pioneer studies prior to the 1950’s, later papers primarily stressed contemporary rather than historical factors as drivers of genetic variation in different parts of a species range. In addition, the second half of the 20th century witnessed initial attempts to link genetic and demographic patterns by proposing that higher abundance in central populations would determine differences in inbreeding coefficients, isolation by distance, and the influence of density-dependence on selection (e.g. Haldane, 1956; Carson, 1959; Mayr, 1963). However, the generality of such postulates was limited; detailed information on both demographic and genetic patterns was only collected for Drosophila species, in which range-wide genetic variation could be explained by the potential roles of differences in selective regimes, abundance patterns and historical events (Brussard 1984).
Many studies were carried out across the distribution ranges of different animals and plants from the end of the 1960’s, most of them showing higher genetic diversity in the center of the distribution, although some studies showed no pattern or indeed the opposite to that
predicted by the CPH (e.g. Prakash, 1973; Tigerstedt, 1973; Yeh & Layton, 1979). In addition, an interest emerged in analyzing the genetic consequences of pole-ward migrations since the last glaciation, with most studies illustrating a decline in genetic variation in northern range-limit populations in the northern hemisphere (e.g. Dessauer & Nevo, 1969; Highton & Webster, 1976; Schwaegerle & Schaal, 1979).
Evaluation and refinement of hypotheses (into the 21st century)
From the 1990’s onwards, an ever-increasing number of CPH tests have been conducted on a wide array of organisms, traits and continents, at different spatial scales, and using a high diversity of methodological approaches (Fig. 1, Appendix S1). A large number of studies have examined patterns of demographic performance across species ranges. Contrary to expectations, several initial reviews found no general support for the CPH for demographic parameters such as abundance, individual vital rates or population growth rates (Sagarin & Gaines 2002; Sexton et al. 2009; Abeli et al. 2014), although a tendency for higher demographic variability in peripheral situations was detected (Sexton et al. 2009). Several recent studies have also challenged the view that species’ geographical range limits match their ecological niche boundaries (Chardon et al. 2014; Hargreaves, Samis & Eckert 2014). Such observations therefore stress the need to disentangle centre-periphery gradients associated with either geographic peripherality or ecological marginality.
In addition, the last 20 years have been marked by the arguments of several authors for a less static view of the CPH by considering that the distribution of species’ demographic performance may reflect their temporal range dynamics, from post-glacial recolonization events to contemporary extinction/colonization dynamics after environmental change
contractions in the periphery of their distribution than in the centre, due to lower anthropogenic effects (Channell & Lomolino 2000). However, very few studies have compared demographic rates of rear and leading edge populations (Hampe & Petit, 2005; but see Purves, 2009; Pironon et al., 2015).
The most comprehensive reviews of the CPH in relation to patterns of genetic variation in plants and animals have shown a general trend for lower genetic diversity within populations and higher differentiation among populations in the periphery (Johannesson & Andre 2006; Eckert et al. 2008). However, these patterns are far from being universal, and the authors have pointed out strong taxonomical, biogeographical and sampling-related biases in the available studies. Also, strong selection pressure in marginal areas due to stressful and fluctuating conditions could lead to the appearance of novel adaptations and confer greater evolutionary potential, and thus conservation interest, especially in the context of global warming (Safriel, Volis & Karr 1994; Lesica & Allendorf 1995). Moreover, as for demographic patterns, recent studies call for independent analyses of the roles of geography and ecology in shaping range-wide patterns of genetic variation (Lira-Noriega & Manthey 2014; Sexton, Hangartner & Hoffmann 2014).
Historical effects on genetic variation have also received much recent attention, with numerous studies focusing on peripheral populations that represent recent colonization events. In general, such leading-edge populations show lower genetic variation than central populations (Hewitt 1996, 2000). On the other hand, some authors have pinpointed the relevance of frequently overlooked rear-edge populations, which might show unique genetic properties due to their persistence in stressful or exceptional conditions, or due to their older history (Hewitt 1996; Hampe & Petit 2005). Guo (2012) emphasized the importance of
evaluating central-peripheral and latitudinal gradients together, considering both historical and contemporary events, to understand biological patterns across ranges, as highlighted several decades ago by Cain (1943).
Global survey and meta-analyses
Paper selection
To compile a representative dataset of articles that have tested the CPH, we selected publications according to a standardized sampling method. First, we extracted all studies cited in the main text and supplementary information of four comprehensive literature reviews of the CPH: Sagarin & Gaines (2002) for abundant-centre patterns, Sexton et al. (2009) for demographic vital rates; Abeli et al. (2014) for plant populations’ performance and abundance; and Eckert et al. (2008) for genetic diversity and differentiation. We then used the ISI Web of Knowledge database to select all papers that have since cited at least one of these reviews. Finally, we made a search on the ISI Web of Knowledge browser using as keywords the centre (“cent*” or “core”) with periphery (“marg*” or “peripher*” or “edge” or “limit*” or “satellite”) and link word “AND”. We restricted our research to the first 250 articles in the field “ecology”. This search was performed on June 30, 2014; papers published after this date have not been included in our study. We obtained a total list of 1260 papers that we filtered to retain original articles that explicitly compared central and peripheral populations based on empirical data and in which we could extract species-level results supported by statistical tests. This resulted in a final pool of 248 papers (Fig. 1A, Appendix S1), 131 of which had been analyzed in one or more of the four previous reviews,
Data collection
Results of the 248 studies were sorted into several broad categories (abundance, population performance, size, ecological niche, and genetic variation), that each contains a set of parameters.
“Abundance” patterns were studied at two scales: population occupancy at a regional scale (or population frequency in a given area) and abundance of individuals (number or density) in a population. “Population performance” was assessed in relation to the demography of the populations: survival, growth, fecundity, recruitment, and the overall population growth rate. “Size” covered morphometric measures of individuals. Size was often considered as proxy for growth, hence, we examined the results for size and performance together. We also extracted results concerning the spatial or temporal variability of all the parameters of the categories “Abundance”, “Population performance”, and “Size”. Population occupancy was the only parameter for which we found no study on variability. The “Genetic variation” category included measures of three parameters: within-population diversity, among-population differentiation, and inbreeding.
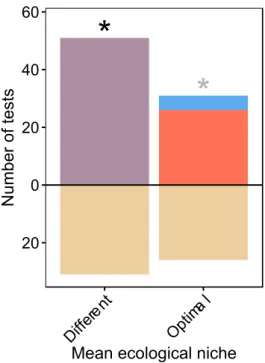
Finally, in addition to these categories, we regrouped all articles that focused on the “ecological niche”. Two parameters were considered: the mean ecological niche that captured variation in mean conditions between central and peripheral populations and differences in the ecological niche breadth (variability among sites within central and peripheral groups of populations). Results for this category are presented separately in section IV.1.
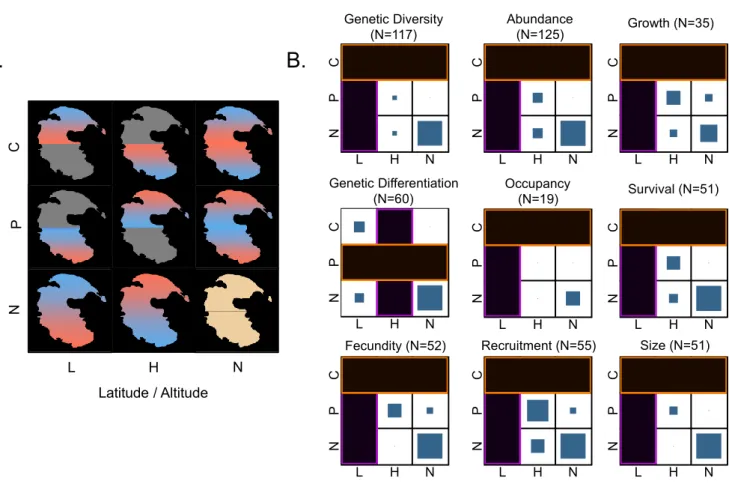
In each article, we extracted results at a species level and assessed whether a given parameter was significantly higher in central (C) or peripheral (P) populations or not significantly different between the two geographic groups of populations (N). A wide variety of indexes have been used to describe each parameter; therefore, when several indexes were used for a single parameter (e.g. genetic diversity estimated by the number of alleles per locus and heterozygosity), we discarded non-significant indexes, and assigned one value of C or P per parameter only if indexes associated with significant statistical tests were all higher in central or peripheral populations. If no difference was statistically significant or if significant trends were detected in opposite directions, we considered the result as being null (N). Thus, the total number of tests of the CPH represents the number of parameter comparisons for all species in the 248 articles.
The CPH has been tested on a large panel of organisms, with a wide variety of sampling protocols. Therefore, we also extracted methodological information from studied publications. We first aimed to quantify spatial aspects of sampling schemes to assess their impact on the validation of the CPH. We examined three main sampling characteristics. The first was the relative position of peripheral populations within the species range or “Degree of isolation” between peripheral populations and the central part of the distribution. Here, tests were allocated to one of three classes: intermediate (peripheral populations located between the centre and the edge of the range), absolute (peripheral populations at the edge of the range) and beyond (peripheral populations isolated beyond the edge of a continuous range). A second sampling effect involves the “Spatial extent” of the study area (i.e. the largest distance between two studied populations). Again, we allocated studies to one of three classes: small-scale studies (< 200km between the two most distant populations),
regional-scale studies (200 - 2000km) and continental-scale studies (> 2000km). These classes were adapted from Pearson & Dawson (2003). The third sampling characteristic is “Range cover” which assesses the proportion of a species distribution that has been sampled in the study using four percentage classes (0-10% / 10-25% / 25-50% / 50-100%). When not provided directly by the authors in the main text, the extent of species’ distributions was extracted from external sources (supplementary information, atlases, internet). Finally, study species were classified by kingdom (plant or animal), and by the biogeographical regions they inhabit (following USDA http://www.nrcs.usda.gov).
Statistical analyses
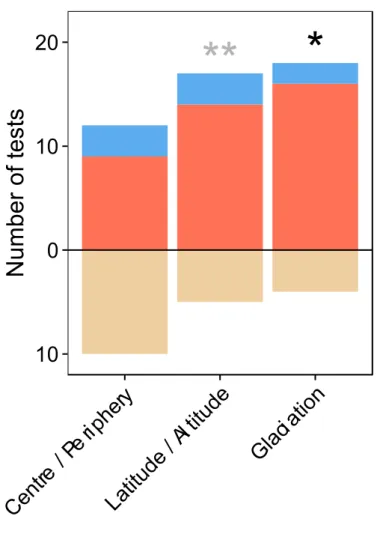
Our analysis is based on frequency comparisons using Chi-square tests of homogeneity. We also conducted binomial tests on the numbers of tests that validated the CPH for each parameter. First, we tested whether the hypothesis was validated for more than half of the tests (hypothesized probability of success of 0.5; i.e. C>P+N for comparisons of mean parameters, P>C+N for comparisons of genetic differentiation and parameters’ variability). If this deviation was not significant, we investigated whether the hypothesis was validated for more than one third of the tests (hypothesized probability of success of 0.33; i.e. C>P or C>N for comparisons of mean parameters, and P>C or P>N for comparisons of genetic differentiation and parameters’ variability).
We used a Principal Component Analysis (PCA) to investigate correlations among the three main sampling characteristics and limit potential redundancy. Given that these variables are semi-quantitative, we recoded them on an ordinal scale before performing the analysis.
axis of the PCA (54% of variability explained; later named “Scale”) while the second axis was driven by the “Degree of isolation” (32% of variation explained; later named “Isolation”). We therefore used coordinates of each study on these axes as synthetic variables. Then, we fitted a Generalized Linear Model (GLM) for binomial data with validation of the hypothesis (yes or no) as a response variable and “Scale” and “Isolation” as explanatory variables. All analyses were performed using the software R (R development Core Team 2010) and the ade4 package for multivariate analysis (Dray & Dufour 2007).
The “centre-periphery hypothesis”: an overview
Multiple approaches
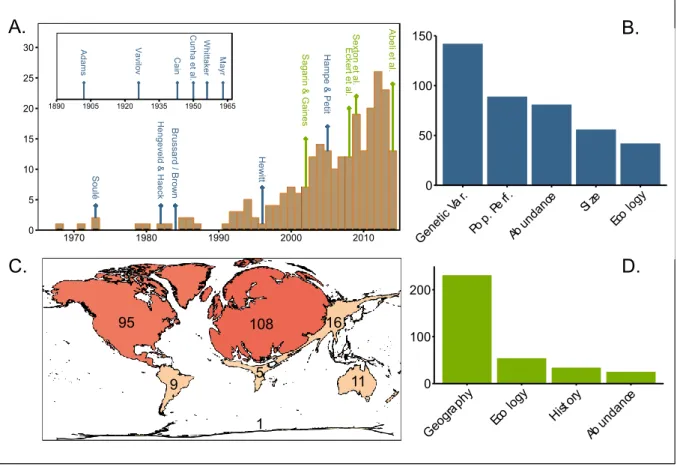
Our database contained 248 papers published between 1968 and 2014 in 89 different journals representing a wide range of current impact factors (from <1 to 31) (Fig. 1A, Appendix S1). Genetic variation was the most studied category with 135 papers representing 301 tests (Fig. 1B). Abundance and population performance were examined in 76 papers (176 tests), and 82 papers (262 tests) respectively. Differences in size and environmental conditions have been the least often investigated in 54 papers (95 tests) and 42 papers (96 tests) respectively. No study conjointly analyzed genetic variation, population performance and abundance patterns. Most of these empirical studies have been conducted in North America and Europe (83% of the articles, Fig. 1C). This over-representation of temperate areas may strongly impact results and limit any global interpretation of trends, which highlights the necessity of analyzing its potential bias.
peripheral gradients were commonly used (Fig. 1D) including ecological gradients with peripheral populations in different (or marginal) conditions (Hargrove & Rotenberry 2011; Pouget et al. 2013), and temporal gradients with peripheral areas containing younger (more recently founded) populations (e.g. Tollefsrud et al., 2009; Gassert et al., 2013). This approach was explicitly used when precise data on past distribution were available, for example in relation to post-glacial (Cwynar & MacDonald 1987; Hoban et al. 2010; Jadwiszczak et al. 2011), or recent (Mandak 2005) colonization. Finally, some authors described a centre-periphery pattern based on the size and/or the density of the population (e.g. Van Rossum & Prentice, 2004; Lemke & Porembski, 2013).
Figure 1-1. An overview of the CPH empirical literature.
A. The number of studies testing the CPH since 1968 with important review papers (green arrows) and major conceptual papers (blue arrows); B. The number of studies testing the CPH on different groups of species characteristics; C. Choropleth map representing the number of studies conducted on each continent; D. The number of studies that adopt different
S ag a rin & G a in e s S e xto n e t a l. A b eli e t a l. E ck er t e t a l. B ru ss a rd / B ro w n H e ng e ve ld & H ae ck H e w itt S o u lé H a m p e & P et it 0 5 10 15 20 25 30 1970 1980 1990 2000 2010 V av ilo v C un h a e t a l. C ain W hit ta ke r A d am s M ay r 1890 1905 1920 1935 1950 1965 0 50 100 150 Gene tic Va r. Pop. Perf. Abun dance Si ze Eco logy 0 100 200 Geog raph y Eco logy Histo ry Abun dance 16 95 108 5 9 11 1 A. C. B. D.
General results
To analyze the number of tests that show significant differences between central and peripheral populations for different parameters, we retained studies with a geographical centre-periphery approach and discarded articles whose centre-periphery pattern solely relied on population abundance or ecological gradients. This restricted the number of articles to 234, representing 804 tests of the CPH.
Abundance
The abundant-centre hypothesis (an offshoot of the general CPH) is based on two assumptions: environmental variables are spatially correlated throughout the range, and abundance peaks where environmental conditions are best, i.e. in central populations (Brown 1984; Sagarin et al. 2006).
We found that population occupancy showed a strong trend towards lower values in peripheral populations (81% of studied tests). However, this significant trend is based on only 21 tests in 15 papers (Table 1). Besides, we noticed that several studies considered this pattern as a fact and defined their centre-periphery sampling scheme based on this criterion. For example, some genetic studies oppose large and continuous central populations to small and scattered peripheral populations (Jones & Gliddon 1999; Van Rossum et al. 2003; Medrano & Herrera 2008), although they did not measure population size, density or fragmentation.
69 out of 135 tests (51%) focusing on the abundance of individuals reported higher abundance in the central part of the distribution, though the trend is weaker than for
occupancy patterns (Table 1). This result contrasts with Sagarin & Gaines (2002) who found weaker support for the hypothesis, but whose study gave a high importance to a relatively low number of papers (145 tests extracted from 22 papers, 39% of validation). In particular, the study by Blackburn et al. (1999) alone represented 44% of the total number of considered tests, and did not support the CPH. This paper was not included in our study, as we were not able to identify central and peripheral areas of the ranges of the different species considered.
Different results for population occupancy and abundance of individuals may be due to differences in the factors shaping those patterns (Lawton 1993; Hoffman & Blows 1994; Gaston 1996; Thuiller 2013), which may act over different scales (Gilbert 1980; Gilman 2005; Boulangeat, Gravel & Thuiller 2012). The strong spatial organization of occupancy patterns may be primarily driven by climatic factors which act over a large scale and are often spatially autocorrelated (Thuiller, Araüjo & Lavorel 2004). This is supported by recent cross-taxa empirical analysis for both plants (Boucher-Lalonde, Morin & Currie 2012) and animals (Boucher-Lalonde, Morin & Currie 2014). In contrast, variables linked to the abundance of individuals could operate at more local scale (Pearson & Dawson 2003; Elmendorf & Moore 2008) and exhibit low spatial structure (Caughley et al. 1988; Lawton 1993). For example, Gilman (2005) highlighted the importance of water temperature, tides, wave force and biotic interactions to shape the local abundance pattern of an intertidal limpet (Collisella scabra Gould). The spatial layering of these ecological factors Pearson & Dawson (2003) might explain range-wide clumped distributions of abundance of individuals observed in some taxa (see Brown, Mehlman, & Stevens, 1995), and lead to the low general support for a large scale decrease of abundance of individuals toward the periphery. However, species might