The 2009 Elections to the European Parliament
Country Reports
Edited by Wojciech Gagatek
Foreword by Yves Mény
European University Institute
Florence, Italy
IV
© European University Institute 2010Editorial matter and selection © Wojciech Gagatek Chapters © authors individually
This text may be downloaded only for personal research purposes. Any additional reproduction for other purposes, whether in hard copies or electronically, requires the consent of the author(s), editor(s). If cited or quoted, reference should be made to the full name of the author(s), editor(s), the title, the year and the publisher.
ISBN 978-92-9084-051-0 doi:10.2870/13513
Published by the European University Institute Robert Schuman Centre for Advanced Studies, European Union Democracy Observatory - EUDO Via dei Roccettini, 9
I-50014 San Domenico di Fiesole (FI) – Italy
E-mail: [email protected] Website: www.eudo.eu
www.eui.eu
First edition: April 2010
Views expressed in this publication reflect the opinion of individual authors and not those of the European University Institute.
THE 2009 EP ELECTIONS
T
ableofC
onTenTsForeword
Yves Mény, President of the European University Institute 2002-2009 . . . . IX
Preface: Bringing the European Parliament election results closer to the citizens
Wojciech Gagatek, Alexander H . Trechsel and Fabian Breuer . . . . XI
s
eCTioni
i
nTroduCTion1 How much ‘second-order’ were the European Parliament elections 2009?
Alexander H . Trechsel . . . .3
2 Campaigning in the European Parliament elections
Wojciech Gagatek . . . .13
3 The biggest marketing campaign in the history of the EU
Lutz Meyer . . . .21
4 The EU Profiler: A new way for voters to meet parties and to understand European elections
Fabian Breuer . . . .27
5 The political composition of the new European Parliament
Wojciech Gagatek . . . .33
s
eCTionii
C
ounTryr
eporTs6 Austria
Theresa Kuhn, Fabio Wolkenstein, Flooh Perlot and Sarah Meyer . . . .41
7 Belgium
Kaat Smets, Kris Van Berendoncks and Steven Van Hecke . . . .47
8 Bulgaria Milen Lyubenov . . . .53 9 Cyprus Christophoros Christophorou . . . .59 10 Czech Republic Anna Kárníková . . . .65 11 Denmark Malthe Munkøe . . . .71 12 Finland Sari Rannanpää . . . .77
VI
13 France
Mathieu Petithomme . . . .83
14 Germany
Sandra Brunsbach, Stefanie John and Annika Werner . . . .89
15 Greece
Sofia Vasilopoulou . . . .95
16 Hungary
Agnes Batory . . . . 101
17 Ireland
Conor Little, Maria Laura Sudulich and Matthew Wall . . . . 107
18 Italy
Edoardo Bressanelli, Andrea Calderaro, Daniela Piccio and Furio Stamati . . . . 113
19 Lithuania
Renata Mieńkowska-Norkiene and Egle Kavoliunaite . . . . 119
20 Luxembourg
Patrick Dumont and Astrid Spreitzer . . . . 125
21 The Netherlands
Carolien van Ham and Kaat Smets . . . . 131
22 Poland
Wojciech Gagatek, Katarzyna Grzybowska-Walecka and Patrycja Rozbicka . . . . 137
23 Portugal
José Santana Pereira . . . . 143
24 Romania Arpad Todor . . . . 149 25 Slovakia Karen Henderson . . . . 155 26 Slovenia Grega Gostencnik . . . . 161 27 Spain
Fernando Casal Bértoa, Mónica Ferrín and Sergi Pardos-Prado . . . . 165
28 Sweden
Jibecke Joensson . . . . 171
29 United Kingdom
THE 2009 EP ELECTIONS
l
isTofT
ablesandf
iguresT
ablesTable 1-1 Regional differences in turnout (national levels of turnout averaged by region) . . . . 5
Table 1-2 National Government Parties Lose (Difference in Percent of Votes Cast for Governing Parties: European Elections 2009 and Last Preceding National Elections) . . . . 8
Table 1-3 Winners and losers across the left-right dimension in the EP 2009 elections . . . . 10
Table 6-1 Results of the 2009 European Parliament elections – Austria . . . . 45
Table 7-1 Results of the 2009 European Parliament elections – Belgium . . . . 51
Table 8-1 Results of the 2009 European Parliament elections – Bulgaria . . . . 56
Table 9-1 Results of the 2009 European Parliament elections – Cyprus . . . . 62
Table 10-1 Results of the 2009 European Parliament elections – Czech Republic . . . . 69
Table 11-1 Results of the 2009 European Parliament elections – Denmark . . . . 75
Table 12-1 Results of the 2009 European Parliament elections – Finland . . . . 81
Table 13-1 Results of the 2009 European Parliament elections – France . . . . 86
Table 14-1 Results of the 2009 European Parliament elections – Germany . . . . 93
Table 15-1 Results of the 2009 European Parliament elections – Greece . . . . 98
Table 16-1 Results of the 2009 European Parliament elections – Hungary . . . . 104
Table 17-1 Results of the 2009 European Parliament elections – Ireland . . . . 111
Table 18-1 Results of the 2009 European Parliament elections – Italy . . . . 117
Table 19-1 Results of the 2009 European Parliament elections – Lithuania . . . . 123
Table 20-1 Results of the 2009 European Parliament elections – Luxembourg . . . . 129
Table 21-1 Results of the 2009 European Parliament elections – Netherlands . . . . 135
Table 22-1 Results of the 2009 European Parliament elections – Poland . . . . 141
Table 23-1 Results of the 2009 European Parliament elections – Portugal . . . . 147
Table 24-1 Results of the 2009 European Parliament elections – Romania . . . . 153
Table 25-1 Results of the 2009 European Parliament elections – Slovakia . . . . 159
Table 26-1 Results of the 2009 European Parliament elections – Slovenia . . . . 164
Table 27-1 Results of the 2009 European Parliament elections – Spain . . . . 169
Table 28-1 Results of the 2009 European Parliament elections – Sweden . . . . 175
VIII
f
iguresFigure 1-1 Turnout in EP elections 1979-2009 . . . . 4
Figure 1-2 Turnout in the 2009 EP elections by country . . . . 5
Figure 1-3 Turnout in the most recent two EP elections by country . . . . 6
Figure 1-4 Leading parties of government in the European Union (June 2009) . . . . 9
Figure 1-5 Gains and losses of leading parties of government in the 2009 EP elections . . . . 10
Figure 4-1 An example of an EU Profiler statement - Welfare, family and health . . . . 28
Figure 4-2 An example of an EU Profiler ‘political landscape’ (Denmark) . . . . 29
Figure 5-1 Political Composition of the European Parliament after the 2009 elections . . . . 34
Figure 5-2 The percentage of seats controlled by EP political groups in the previous and current legislature . . . . 35
THE 2009 EP ELECTIONS
f
orewordYves Mény, President of the European University Institute 2002-2009
The European University Institute (EUI) was set up in 1972 by the six founding Member States of the European Communities to provide advanced academic training to doctoral researchers and to promote research at the highest level. It opened its doors to its first researchers in 1976. This event preceded the first direct elections to the European Parliament of 1979 by only three years. Although politicians and the leading European elite welcomed these elections with great hope, the electorate did not attach much importance to them, and soon afterwards political scientists began to refer to them as second-order elections.
Today, the EUI is a world-class postgraduate and postdoctoral research institute for Economics, History, Law, and Political and Social Sciences. Comparative Europe-focused research has always been at the forefront of our activities. Prior to the 2009 elections to the European Parliament, we successfully embarked on two large research projects. First, the European Union Democracy Observatory (EUDO), a new and blossoming research centre based at the Institute, launched the unique innovative voting aid application EU Profiler. More than 2.5 million European citizens visited this website in search of information about the programme profiles of the political parties competing in the 2009 elections. Secondly, the EUI is hosting the large interdisciplinary research project PIREDEU (Providing an Infrastructure for Research on Electoral Democracy in the European Union). This project is perhaps the largest and most comprehensive analysis of the European Parliamentary elections to date, and its preliminary results will become available in the course of the year 2010.
However, we wish to go beyond that. One of our objectives for the future will be to communicate more often with the world of practice, and hopefully, also with ordinary citizens. The EUI has the ambition of playing an important role in building civil society and in bringing the EU closer to its citizens. Based on this premise, a group of young scholars both from the EUI and from all over the EU has engaged in preparing this publication devoted to the 2009 elections to the European Parliament. The publication is innovative in several regards. First of all, I am very pleased that 5 introductory chapters and 24 standardized country reports contained in this eBook were written by young members of our academic community. Throughout my presidency of the EUI, I have always tried to create conditions for young academics to develop and flourish, and I am very happy that we created an opportunity for them to be engaged in a comparative research project of this kind. It must be emphasized that the initiative to prepare the publication came from these young academics, who correctly identified a gap in the availability to those interested of reliable well-researched academic analysis of this election. From the very beginning, our idea was to put the entire eBook on-line and to provide unlimited access to it. We therefore hope that it will become a useful source of reference for academia, the media and the wider public.
In the next few years, European politicians will need to thoroughly rethink how to bridge the gap between the EU and ordinary citizens and how to strengthen the democratic legitimacy of the Union. The EUI is ready to be fully engaged in this debate, and through such initiatives as EUDO and the results of our research, we will continue to provide viable academic explanations
FOrEwOrd
X
of, and solutions to, the well-known deficiencies in EU democracy. I am confident that the next President of the EUI, Josep Borrell Fontelles, a former president of the European Parliament, will continue to build close links between academia and the world of practice with a view to finding solutions to many of the problems that the EU is facing at this time.
THE 2009 EP ELECTIONS
p
refaCe:
b
ringingThee
uropeanp
arliamenTeleCTionresulTsCloserToTheCiTizensWojciech Gagatek, Alexander H . Trechsel and Fabian Breuer 1
The European Parliament elections are a fascinating, and at the same time slightly disappointing, event. What fascinates is the sheer size of the electorate (350 million) and the number of parties running in the campaign (more than 300); what disappoints is that these parties run campaigns on totally different issues, based on national, rather than European themes. Despite the continuing strengthening of the Parliament, citizens do not pay much attention to these elections, parties fight low-profile dull campaigns, and the media are not much interested either. The list of fascinations and disappointments could be much longer, as political scientists have produced vast volumes explaining the overall nature of these elections (see Gagatek in this volume).
In this context, the 2009 EP elections of June 4-7 seem to confirm the steady trends observed since the first direct elections to the European Parliament of 1979. Political scientists often refer to the second-order or even third-order character of the elections, which altogether describes their relative unimportance. Overall, turnout is much lower than in national elections; if people go to the polls, then they often use their vote to sanction their national governments; small and relatively unimportant, or newly established, parties tend to receive surprisingly large support in EP elections; and finally, parties fight their campaigns on national, rather than European issues.
Obviously there are some new developments which cannot be dismissed. Politically speaking, the 2009 result brings a new Parliament looking to the right of the political spectrum, with the left quite heavily beaten in most EU member states. Second, the new arrival of nationalist and extreme parties is argued to be a sign of popular disillusionment. However, these populist and extremist parties, even though they make a lot of fuss and attract large media interest, hardly ever sit within a single political group in the Parliament, and therefore, are barely able to influence the way the Parliament works and the kind of decisions it takes.
The role for political scientists
Every five years, both politicians and academics try to come up with ideas to improve the above-mentioned deficiencies. How to increase turnout? How to best communicate the benefits of European integration? How to make the Parliament a more interesting place? With the Lisbon Treaty in force, the Parliament will have more powers and its role in the Union will further increase. The need to come up with suggestions on how to get citizens more interested in the only democratically elected institution of the EU will then be even more pressing. However, what can academics do to help redress some of the failures of these elections? Is there any role for political scientists, such as the three of us signed below?
1 Wojciech Gagatek, Lecturer in European Politics, University of Warsaw, Collaborator for the EUDO Observatory
on Political Parties and Representation; Alexander H. Trechsel, Swiss Chair Professor in Federalism and Democracy, European University Institute, Florence, EUDO Director; Fabian Breuer, Project Assistant of EUDO and EU-Profiler coordinator, European University Institute, Florence.
XII
XIII
PrEFaCE: brINgINg THE EurOPEaN ParLIamENT ELECTION rESuLTS CLOSEr TO THE CITIzENSWe strongly believe that the role of academics should be extended, and should not only focus on explaining things post-factum, but actually on helping voters to make their choice. For many years political scientists have observed that party programmes have converged, so that it is increasingly difficult to distinguish one party’s programme from another. Furthermore, voters do not have enough interest or time to study party programmes. In effect, they are often left without clear ideas of who to vote for. This is one of the reasons why the number of undecided voters is getting higher each election. Some of them often refrain from voting, precisely because they do not know who to vote for and what options they have to choose from.
This is why a group of political scientists from the European University in Florence launched a revolutionary internet voting-aid application – the EU Profiler – before these EP elections. The EU Profiler, 2 which was launched at the end of April 2009, was the only Europe-wide
voting advice application for the 2009 European Parliament elections, and was available in all the national EU languages. It was customised to each country’s national campaign context and included almost 300 European parties, which were coded according to 30 political statements in 9 policy categories. To do this, party programmes and similar sources were analysed and documented. The tool allowed voters to compare their own policy preferences with those of their national parties by answering a simple questionnaire. Based on this, the EU Profiler provided users with textual and graphical representations of parties’ stances compared to their own positions. It also enabled the academic team to shed new pan-continental light on public opinion, voting behaviour, campaign dynamics, party cohesion and political participation (see Breuer in this volume for more details).
However, the second, parallel aspect of our perceived role is to explain this election to the wider public. A huge part of the citizenry expects comparative, reliable information on this election. Other groups in society, including politicians and journalists may also like to have clear, succinct, and understandable analyses which they can use in their own work. With the eBook that you are reading at this moment, we rise to these expectations. We thought that it would be a pity not to use the efforts of so many academics engaged in the EU Profiler project to produce a publication about the results of these elections. This is why we have decided to prepare short country reports analyzing EP elections in each country comparatively.
eBook structure
We open this eBook with five introductory chapters. By analyzing these elections through the lenses of the second-order election thesis, Alexander H. Trechsel argues that they confirm the thesis while, at the same time, representing the first real European elections in terms of their political outcome. Mainly due to the current economic crisis Europe witnesses an electoral convergence at both the national and the European levels of party competition. Wojciech Gagatek looks at the campaign patterns, trying to identify how these elections were fought and what new aspects they brought. Lutz Meyer presents and assesses the effects of the information campaign that the European Parliament commissioned from Scholz and Friends PR Agency, in which he himself plays a key role. Fabian Breuer presents the EU Profiler and the problems that this project faced when analyzing party programmes in more detail. Finally, Wojciech Gagatek introduces the political composition of the newly elected Parliament and speculates on how it can influence the way it works.
These chapters serve as introduction to 24 country reports prepared mostly by young political scientists. Each chapter is relatively short (5-6 pages), and follows the same structure, being composed of four clearly-defined sections: Background, Issues, The election campaign and Results. The brief section entitled Background contextualizes the election campaign by bringing in the most recent national election results, presenting the political scene and by briefly covering the general political atmosphere in the first half of 2009. The next section, entitled Issues, presents the reader with an account of the themes of the campaign, especially covering the areas on which political parties differed. In other words, the aim of this section is to give the reader a basic understanding of party approaches and policies on European integration, and
wOjCIECH gagaTEk, aLExaNdEr H. TrECHSEL aNd FabIaN brEuEr
additionally voters’ perception of the EU and of the European Parliament. In the third section, entitled The election campaign, we look at party campaign strategies and campaign dynamics. What kind of activities and means of communication did different parties prefer? What kinds of candidates were presented to the voters? What role did European political parties play during the campaign? Finally, the section entitled Results offers tentative explanations of the turnout (especially if it was lower than expected) and presents the results. Does this election mark continuity with the 2004 election? How can the gains and losses of various parties be explained? What will the direct consequences of this election be for national politics? We believe that framed in such a way, these chapters build a coherent picture of EP election development. All the above chapters were written in the period between June and October 2009.
We believe that our eBook will be particularly useful to non-academics, such as politicians, journalists and, last but not least, ordinary people. We particularly wanted to avoid using difficult academic vocabulary or sophisticated statistical analyses so that these chapters are understandable to everybody. However, more interested readers will be given a chance to focus much more deeply on the election results once the first fully-blown academic analyses emerge.
Section I
Introduction
THE 2009 EP ELECTIONS
1
h
owmuCh‘
seCond-
order’
wereThee
uropeanp
arliamenTeleCTions2009
?
Alexander H . Trechsel 1
In this contribution I will briefly examine a 30 year-old patient: the European Parliament elections and their most recent results of June 2009. What is produced on a new born baby within minutes of its birth – the test of its vital functions, known as the APGAR test – took a full year in the case of the EP elections. One year after the first EP elections of 1979, Karlheinz Reif and Hermann Schmitt published a seminal article in the European Journal of Political Research. They became immediately aware that the 1979 EP elections were different from national elections: they were held as a set of simultaneous national elections, less important, however, than the latter and more particularly, less important than ‘first order’ elections. For Reif and Schmitt, “first-order elections in parliamentary systems are the national parliamentary elections, and in presidential systems, the national presidential elections”. In all western democracies, these first-order elections are complemented by second-first-order elections, such as “by-elections, municipal elections, various sorts of regional elections, those to a ‘second chamber’ and the like”. 2 Parting
from this observation, they developed a systematic, analytical framework for diagnosing the ‘second order’ character of the EP elections.
Reif and Schmitt were then the very first to detect symptoms of anomalies in the electoral newborn. Contrary to sub- national second order elections, there was even less at stake in these trans-national EP elections. Hence, involvement and participation (in Reif and Schmitt’s terms) were expected to be even lower than in other second-order elections. Generally, the ‘less-at-stake’ dimension of the second-order model would lead to pathologically low levels of participation (turnout), particularly bright prospects for small and new parties, particularly elevated percentages of invalid ballots as well as strongly losing governing parties. Their empirical results confirmed this state of affairs for the 1979 elections and, largely, for all subsequent EP elections. 3
But what about the 2009 EP elections, is there any sign of weakening of the second-order character, or to the contrary, are these elections even more second-order than before? Thirty years ago, for Reif and Schmitt, the fact that the first EP elections were held in a “new and unfamiliar arena” made these elections particularly vulnerable to second-order characteristics. 4
Today, with EP elections having matured, one could hypothesise that the arena is now much better known than thirty years ago, 5 that there is much more at stake than 30 years ago and
1 Swiss Chair Professor in Federalism and Democracy, European University Institute, Florence; EUDO Director. 2 K. Reif & H. Schmitt, ‘Nine Second Order National Elections. A Conceptual Framework for the Analysis of
European Elections Results’, European Journal of Political Research, vol. 8 (1), 1980, p. 3.
3 M. Marsh, ‘Testing the Second-Order Election Model after Four European Elections’, British Journal of Political
Science, vol. 28 (4), 1998, pp. 591-607; W. van der Brug & C. van der Eijk, European elections & domestic politics: lessons from the past and scenarios for the future, University of Notre Dame Press, Notre Dame, Ind., 2007; S. Hix and M. Marsh, ‘Punishment or Protest? Understanding European Parliament Elections’, The Journal of Politics, vol. 69 (2), 2007, pp. 495-510.
4 Reif and Schmitt, p. 11.
5 Note, however, the point made by Gagatek in this volume: citizens’ knowledge about the European Parliament’s
4
5
HOw muCH ‘SECONd-OrdEr’ wErE THE EurOPEaN ParLIamENT ELECTIONS 2009?that therefore the second order character of EP elections would rather show a trend towards the first-order rather than a potential third-order character. In other words: now that actors are used to EP elections, now that both voters and parties have witnessed the (at least the indirect) impact of EP elections on politics and ultimately on themselves, there should be signs of a weakening of the second-order character.
In the following, I would like to briefly look at the outcomes of the 2009 EP elections in the light of the – arguably – three central elements of the second-order thesis: low turnout, small parties’ success and electoral losses by governing parties. 6 By doing so, I will be able to
determine if the initially diagnosed pathologies of EP elections have evolved or stabilised over time.
1. Low turnout?
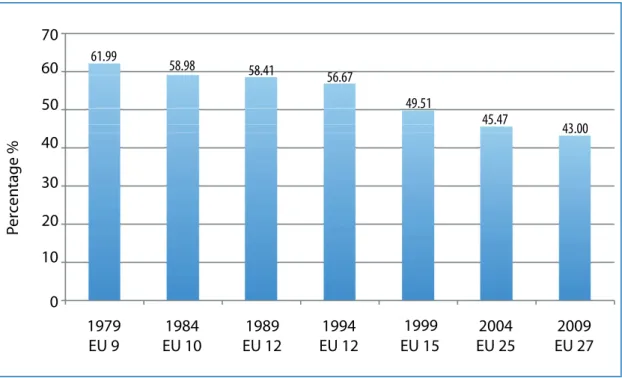
Thirty years after the first holding of European elections, the picture regarding turnout confirms – at first sight – the second order character of EP elections. In all EU 27 countries, turnout in EP elections is structurally lower than in national elections. And this is also the case for the June 2009 elections. Add to this the overall trend: turnout steadily sank from almost 62% in 1979 to a record-low of 43% (Figure 1-1).
Figure 1-1 Turnout in EP elections 1979-2009
Notes:
1979 - EU9 - 9 Member States: Germany, France, Italy, the Netherlands, Belgium, Luxembourg, the UK, Denmark and Ireland.
1984 - EU10 - The 9 Member States + Greece in 1981.
1989 - EU12 - The 10 Member States + Spain and Portugal in 1986. 1994 - EU12 - 12 Member States.
1999 - EU15 - The 12 Member States + Austria, Sweden and Finland in 1995.
2004 - EU25 - The 15 Member States + Poland, Hungary, Slovenia, Slovakia, the Czech Republic, Estonia, Latvia, Lithuania, Cyprus and Malta in 2004.
2009 - EU27 - The 25 Member States + Bulgaria and Romania in 2007
Source: http://www.europarl.europa.eu/parliament/archive/elections2009/en/turnout_en.html
6 I exclude from this analysis the aspect of ‘invalid ballots’.
61.99 58.98 58.41 56.67 49.51 45.47 43.00 0 10 20 30 40 50 60 70 1979 EU 9 EU 10 1984 EU 12 1989 EU 12 1994 EU 15 1999 EU 25 2004 EU 27 2009 Pe rc en ta ge %
aLExaNdEr H. TrECHSEL
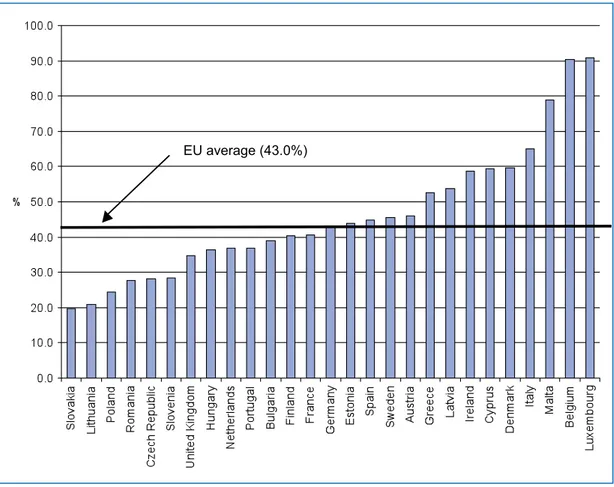
Of course, the EU grew from nine to 27 member states in the meantime, of which ten – Eastern European countries – have structurally lower turnout rates than West European countries, also in their respective national elections. Figure 1-2 shows the great variance in turnout between the highest level measured in Luxembourg and Belgium (where voting is mandatory) and Slovakia and Lithuania, where only one out of five voters went to the polls. Generally, the most recent rounds of enlargement account for a large part of the downward trend.
Figure 1-2 Turnout in the 2009 EP elections by country
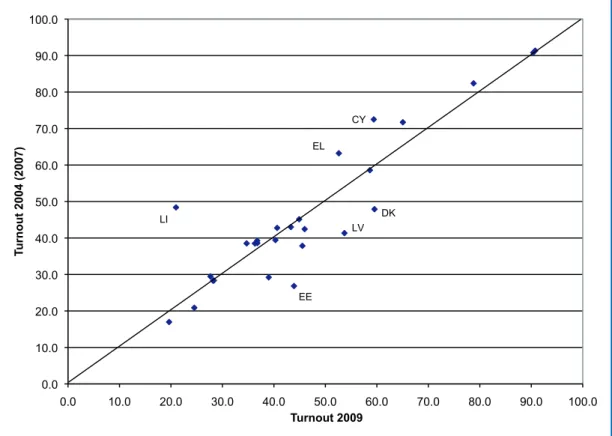
However, East-West differences do not explain the full picture. In particular, between the penultimate EP elections and the June 2009 elections, the average of aggregate turnout in West European member states was reduced by 1.3 percent (Table 1-1). On the other hand, in the 10 new member states of Eastern Europe, turnout went up by 1.4 percent. While still important, the turnout gap between East and West is shrinking.
Table 1-1 Regional differences in turnout (national levels of turnout averaged by region)
Region 2004(07) 2009 Change in %
West 55.6 54.3 -1.3
East 30.8 32.2 1.4
EU27 45.5 43.1 -2.4
Add to this, the rather large stability between the 2004 and the 2009 elections. Not much changed for most countries – some won a few percent in turnout rates, most lost a few. To be precise: turnout went up in eleven countries, with the rest of the EU27 member states showing a downward trend. Extreme cases of both positive and negative trends can be seen in Figure 1-3. Two Baltic states win in both categories. While turnout in Estonia increased by 17 percentage
6
7
HOw muCH ‘SECONd-OrdEr’ wErE THE EurOPEaN ParLIamENT ELECTIONS 2009?points, 7 Lithuanian voters have become a rarity. Turnout figures in Lithuania dropped by over
27 percentage points and barely reached the 20 percent mark in 2009. When one dismisses the eight cases in which turnout varied by less than one percent between 2004/07 and 2009, the picture becomes even more balanced: turnout went down more than one percent in eleven countries and went up by more than one percent in eight EU Member states.
Figure 1-3 Turnout in the most recent two EP elections by country
Overall, turnout figures decreased in Europe though this trend that is not exclusive to the EP: national elections have been hit by voter apathy and generally political disaffection just as badly if not worse. In this sense, I would argue, EP elections remain second-order events but their second-order character – in terms of turnout – did not get more prominent in 2009. Here and there turnout even increased, though still in a minority of cases.
2. Small (and new) political parties gain votes?
This aspect of the second-order character of EP elections is – at least in this very first attempt to look at the phenomenon – rather confirmed for the EP 2009 elections. There are now 168 national parties represented in the European Parliament, more than six political parties per member state on average. Numerous small and new parties, such as the Swedish Pirate Party, have entered the EP electoral arena successfully. Extreme right-wing and populist parties have, in several countries, made massive gains compared to their national election results (such as in the UK, in Hungary, the Netherlands and in Austria). The same is true for anti-EU parties, which are, at least partially, overlapping with populist right-wing parties.
7 The European Union Democracy Observatory (EUDO) is currently carrying out a study, on behalf of the Council
of Europe, focusing on internet voting in the EP 2009 elections in Estonia. This small Baltic republic was the only EU Member State to offer its citizens the possibility to vote over the internet in the EP elections. Also, it extended its advance polling place voting considerably. A direct link between the large increase in turnout in Estonia and these new possibilities of casting votes are examined in the forthcoming study that will be featured on the EUDO website in early 2010 (www.eudo.eu).
0.0 10.0 20.0 30.0 40.0 50.0 60.0 70.0 80.0 90.0 100.0 0.0 10.0 20.0 30.0 40.0 50.0 60.0 70.0 80.0 90.0 100.0 T u rnout 2004 (2007) Turnout 2009 LI EE LV DK EL CY
aLExaNdEr H. TrECHSEL
Most notably the progress of anti-EU parties could be felt, for example, in the UK and in Bulgaria.
When applying the same criteria as Reif and Schmitt to the 2009 EP elections, we find that 41 of the 56 big parties 8 indeed lost in the share of votes. Looking at all other parties for which
we have figures from the last national election, the picture is (of course) the inverse: 73% of all small parties won in the EP elections compared to the last national elections.
The overall fragmentation of parties in the EP is somewhat reduced, though, by the political groups that federate the various national parties in the European hemicycle. The four largest groups (EPP, S&D, ALDE and GREENS/EFA) make up 80% of all seats in the European Parliament (see the chapter on the political composition of the new EP by Gagatek in this volume). And this has always been the case. Post-electoral fragmentation can be curbed through the inclusion of parties into political groups, and the capacity to do so remains very stable over time. The sum of seats held by the four largest political groups in the EP represents about 80% of all seats in incoming European Parliaments since 1979. However, despite the relative stability of post-electoral aggregation into party groups: EP elections remain a fertile ground for small and new political parties. This aspect of the second-order model has hardly changed, with Reif and Schmitt’s model remaining largely valid.
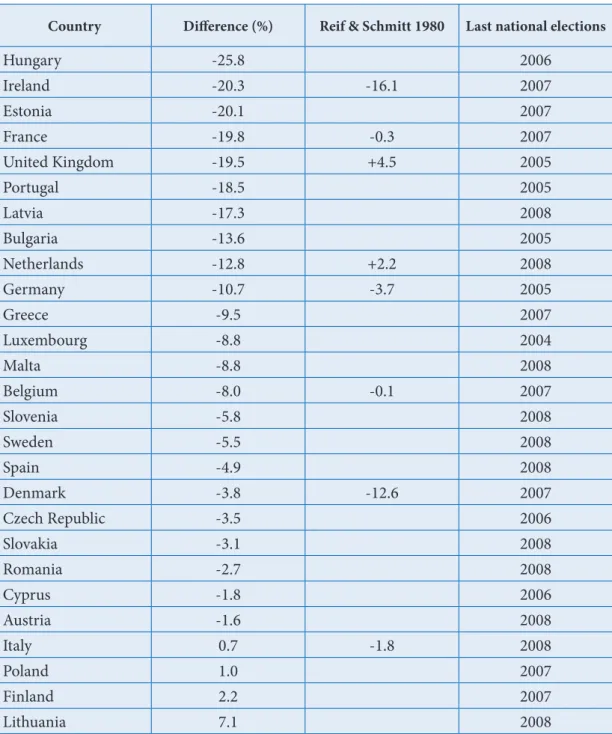
3. Governing parties lose?
According to Reif and Schmitt, not only big parties lose, but also those who govern. At the time of the EP 2009 elections, there were a total number of 60 political parties represented in EU member states’ governments. Indeed, 39 (63.9%) of them lost vote shares in the EP 2009 elections, compared to the last respective national elections. Analogous to the table presented by Reif and Schmitt 9 I calculated the total loss of all governing parties by country (Table 1-2).
In parentheses are the values calculated by Reif and Schmitt for the EP 1979 elections.
Table 1-2 shows that in 2009, government coalition parties lost in 23 EU member states (that is 85% of all coalitions). This is even worse than in the 1979 EP elections, where Reif and Schmitt report 6 coalitions out of 8 losing (75%). Also, with the only exceptions of Denmark and Italy, the other six governmental coalitions already included in the analysis of the first EP elections did worse in 2009 than thirty years earlier. In a sense, therefore, coalition government parties in Europe lost even more today than in the first elections to the EP. A major element of the second-order hypothesis – government coalition parties lose – is therefore confirmed and even emphasised by the results of 2009. I should add an important qualification to this. Reif and Schmitt also argued that the moment in the electoral cycle could explain the winning or losing of vote share by governmental parties. It is not my intention to go into great detail on this point. A preliminary analysis 10 shows, however, that
the distance to the last election has no impact at all on governmental parties’ probability to win or to lose in the EP 2009 elections.
8 For Reif and Schmitt big parties are those who won more than 15 percent of vote share at the last national
elections. In the Parlgov database on which I rely I thereby find 56 big parties. At this point I would like to warmly acknowledge the sharing of the data contained in the Parlgov database, directed by Holger Döring, currently a Max Weber Fellow at the EUI and actively involved in EUDO.
9 Reif and Schmitt, p. 16.
10 I used the number of days since the last national election as an independent variable, with the loose/win-dummy
for all governmental parties constituting the dependent variable and run a binary logistic regression. It goes without saying that such an analysis is impressionistic at best.
8
9
HOw muCH ‘SECONd-OrdEr’ wErE THE EurOPEaN ParLIamENT ELECTIONS 2009?Table 1-2 National Government Parties Lose (Difference in Percent of Votes Cast for Governing Parties: European Elections 2009 and Last Preceding National Elections)
Country Difference (%) Reif & Schmitt 1980 Last national elections
Hungary -25.8 2006 Ireland -20.3 -16.1 2007 Estonia -20.1 2007 France -19.8 -0.3 2007 United Kingdom -19.5 +4.5 2005 Portugal -18.5 2005 Latvia -17.3 2008 Bulgaria -13.6 2005 Netherlands -12.8 +2.2 2008 Germany -10.7 -3.7 2005 Greece -9.5 2007 Luxembourg -8.8 2004 Malta -8.8 2008 Belgium -8.0 -0.1 2007 Slovenia -5.8 2008 Sweden -5.5 2008 Spain -4.9 2008 Denmark -3.8 -12.6 2007 Czech Republic -3.5 2006 Slovakia -3.1 2008 Romania -2.7 2008 Cyprus -1.8 2006 Austria -1.6 2008 Italy 0.7 -1.8 2008 Poland 1.0 2007 Finland 2.2 2007 Lithuania 7.1 2008
Source: ParlGov Database and Reif and Schmitt 1980, p. 16.
These results are quite clear and we could stop digging any further at this point. However, in the aftermath of the EP elections, which took place at the momentary peak of the economic crisis, attentive observers could not miss the left-right dimension of the election outcome. When looking a bit more closely at the results, in particular of the governing parties, there is an astonishing structure that offers itself to us.
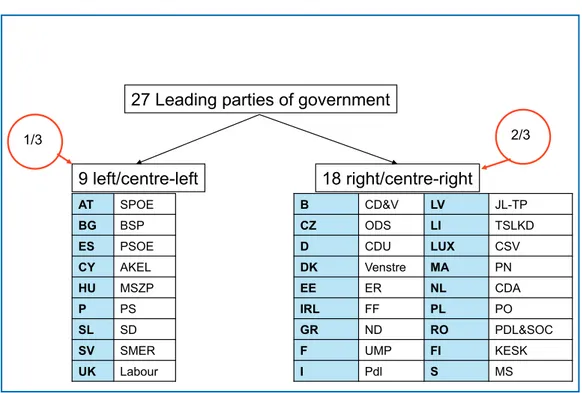
Before showing this structure, let me briefly present the 27 leading parties of government in Europe, at the time of the EP elections. Figure 1-4 shows that two-thirds (18) of member state governments were led by a right/centre-right party and one third (9) by a left/centre-left party.
aLExaNdEr H. TrECHSEL
Figure 1-4 Leading parties of government in the European Union (June 2009)
Let us now limit our analyses to these 27 leading parties of government, and look at their success in the EP elections in a different way. So far I applied the same logic as Reif and Schmitt, i.e. I calculated the difference between political parties’ vote share in the 2009 EP elections and their vote share in the last respective national elections. As we have seen, smaller parties gain disproportionate levels of vote share in EP elections, penalising large parties. As the probability of large parties to govern a country is, however, higher than the probability of small parties to do so, it follows that size of a party, interacting with governmental responsibility, will cause in a large majority of cases governmental parties or governmental coalitions to lose. Indeed, when looking at coalitions, and as we saw, 23 out of 27 coalitions lost compared to the preceding national elections (see above). When we limit ourselves at the leading parties of government, the situation is similar, as 21 of these leading parties of government lost vote shares in the 2009 EP elections.
However, I would argue that there is another way of looking at winners and losers of an election. Limiting ourselves to comparing past with present results will tell us something about individual parties or coalitions. But to see whether a party won or lost the elections at stake, one needs to compare the election results of a party with the results of all other competing parties in the same election. A party may well lose vote shares compared to the last national elections, but still largely – win the elections – as their main competitors lost even more heavily. Inversely, a party may gain vote shares in an EP election compared to the last national election but still remain the number two or three electoral force in the country. In cases where small parties find a particularly fertile ground for electoral competition – and this is precisely the case in EP elections – simply looking at ‘governmental parties’ losing over time’ may be missing the point as the latter phenomenon is more probable from the outset.
I therefore suggest looking at the same data in a different light. I do so by parting from the principle that the leading party in government held the number one position in the partisan landscape at the time of the 2009 EP elections. I then look at whether leading parties in government could defend and maintain their number one positions in the EP elections. Instead of looking at absolute gains and losses I therefore rather look at relative political positions before and after the EP elections.
When doing so, we first find confirmation – again – of the majority of the leading parties of government losing these elections. However, the ‘government parties lose’ phenomenon is
27 Leading parties of government
9 left/centre-left 18 right/centre-right AT SPOE BG BSP ES PSOE CY AKEL HU MSZP P PS SL SD SV SMER UK Labour B CD&V LV JL-TP CZ ODS LI TSLKD D CDU LUX CSV DK Venstre MA PN EE ER NL CDA IRL FF PL PO GR ND RO PDL&SOC F UMP FI KESK I Pdl S MS 1/3 2/3
10
11
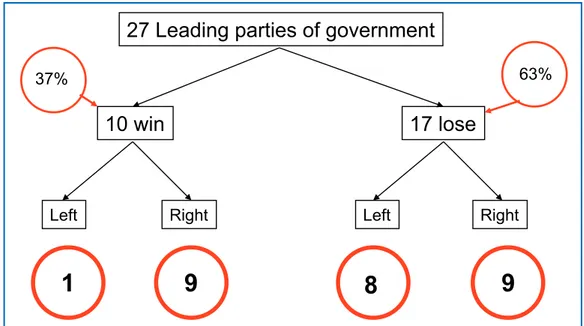
HOw muCH ‘SECONd-OrdEr’ wErE THE EurOPEaN ParLIamENT ELECTIONS 2009?clearly less pronounced. We are now down to 17 out of 27 leading parties of government (63%) that belong to the category of ‘losers’, i.e. those that lost their previously held number one position in the electoral landscape (Figure 1-5).
Figure 1-5 Gains and losses of leading parties of government in the 2009 EP elections
These 17 ‘losers’ split almost equally between the left/centre left and right/centre right parties. Losers do not politically distinguish themselves, which confirms the political neutrality of governmental parties’ losses. However, this is overlooking the winners of the EP elections, i.e. the ten leading parties of government that extended or, at least, maintained their number one position in the national political landscape. Among these ten winners, only one party (the Slovak SMER) is a left/centre left party. All the others are right/centre right parties. Table 1-3 presents this situation most explicitly.
Table 1-3 Winners and losers across the left-right dimension in the EP 2009 elections
L-R Losers Winners N
Left 88.9 11.1 9
Right 50.0 50.0 18
Total 37.0 63.0 27
Eight out of nine (88.9%) of all left/centre-left leading parties of government lost their number one position in the EP elections of 2009. This is very different of right/centre right parties, who overall did much better: their probability of maintaining their number one position among their competitors was 50%. More so, the other half of right/centre right leading parties of government did not always lose their number one position to a competing left-wing party. In Latvia and Finland, both right-wing leading parties in government lost their number one position to another right-wing party. The emerging picture is therefore above all politically tainted: in the 2009 EP elections the right/centre-right in government was more often than not on the winning side. At the same time, the left/centre-left in government lost very badly. With one single exception, all left-wing leading parties of government lost their leading position. 4. Preliminary conclusions
This contribution constitutes a very first, preliminary attempt to interpret the results of the EP 2009 elections in the light of the second-order elections’ thesis, established 30 years earlier by Reif and Schmitt. All three central elements of this thesis were confirmed in these elections, at least in this APGAR-like test, but with important nuances.
27 Leading parties of government
10 win
17 lose
37% 63%
Left Right Left Right
9
9
8
aLExaNdEr H. TrECHSEL
First, the EP 2009 elections were marked by the lowest turnout ever measured. However, as I argue, this is not due to a consistent decline in turnout across all of Europe. In several member states, turnout even went up from the 2004 elections. Furthermore, the gap between East and West in turnout is closing, indicating a possible floor that was reached in terms of electoral participation. In other words, and in my view, the 2009 EP elections did not really become more second-order when looking at turnout figures.
Second, the EP 2009 elections were largely beneficial to small and new political parties. Relatively speaking, large parties lost vote shares to these small and new formations. Reif and Schmitt’s thesis is confirmed regarding this element of the model.
Third, parties in government lose. This is indeed the case, but it is not the most important political outcome of the EP 2009 elections. In unison with the second-order hypothesis, governmental parties lose in EP elections. This is true when looking at differences in vote share between the 2009 EP elections and the preceding national elections. Both governmental coalitions and individual leading parties of government overwhelmingly lose in the EP elections. However, and much more importantly: left and centre-left leading parties in government disproportionately lost the EP elections. In 27 member states, only one single left-wing leading party in government could defend its number one position (SMER in Slovakia). This very clear pattern makes the EP elections of 2009 much less second-order than any preceding EP elections. In 2009, left-wing parties lost, across the entire continent. In this sense, the EP elections of 2009 possibly became the first ‘real’ European elections ever, despite the traditional elements of the second-order hypothesis being confirmed (with nuances). To therefore answer our initial question: yes, the 2009 EP elections confirm the second-order hypothesis by Reif and Schmitt. However, they simultaneously represent the first real European elections in terms of their political outcome. The reason for this ‘Europeanization of European elections’ arguably lies within the effects of the economic crisis. National elections taking place shortly before and after the EP elections of June 2009 largely confirm the shift to the right in governments across Europe. In a sense, the current economic crisis lead to an electoral convergence at both the national and the European levels of party competition.
Note, tout de même, that the EP elections remain a series of (at least) 27 electoral competitions and that the converging outcome is not due to a Europewide, coordinated mobilization, but rather the result of unconnected – though similar in content – election campaigns. In a sense, and for the first time, the individual electoral puzzle pieces nicely fit together and form a clear picture. However, this picture was not previously designed to look like it does. Rather, it possibly emerges, first and foremost, because of the economic crisis. If we accept this logic, it is rather amusing to note that – again – it needed a severe crisis to make European integration leap forward. This time even in electoral terms.
THE 2009 EP ELECTIONS
2
C
ampaigninginThee
uropeanp
arliamenTeleCTionsWojciech Gagatek 1
Since the beginnings of academic research on European Parliament elections, political scientists have devoted large volumes to explaining their second-order nature (see Trechsel in this volume). Particular attention has been paid to investigating the ‘outputs’ of these elections, such as low turnouts, their use as a sanction vote against governing parties, and the relatively good results of small or unknown parties. However, the problem of campaigning has remained virtually untouched. Only more recent scholarship has started to argue that the second-order character of the European Parliament elections also concerns the second-order campaigning of the political parties and the second-order reporting of this event by the mass media. 2 In other
words, elections to the European Parliament differ from national ones, among other ways in the intensity of campaigning, which generally speaking is conducted on a much lower scale and with the use of much fewer financial resources. Regardless of the widespread view of these elections as second-order contests, it is nevertheless a very interesting exercise to observe the commonalities and differences in national styles and traditions of campaigning characterizing EU Member States. What factors can be cited to make a case for characterizing the campaigning in EP elections as second-order? How uniform are the campaign patterns? In which areas of campaigning practice do we still observe differences across the member states? Overall, a look into campaign patterns offers a better view of the European Parliament elections because of its ability to explain the general approach of political parties to these elections.
Rather than being a separate analysis, this chapter will serve as an introduction to the 24 country reports depicting the 2009 European Parliament election. It does not aim to look extensively into the various details and specific occurrences (this is undertaken within the country reports), but rather to list the similarities and differences between campaigning in national and EP elections, and also to analyze the pan-European aspect with regard to attempts to coordinate the campaign at the European level. In the first place I will try to list the most common factors responsible for this low-level campaigning. Secondly, I will focus on the 2009 elections, investigating sources of continuity and change with regard to campaigning patterns. Finally, I will analyze the campaign at the European level.
Factors influencing campaign patterns
Without going deeply into national political contexts, a number of pan-European tendencies can be listed to illustrate the differences between national and European elections, which all together explain the low-profile campaigning in the latter. Some of them are closely related
1 Lecturer in European Politics, University of Warsaw.
2 See C. H. de Vreese, ‘Second-Rate Election Campaigning? An Analysis of Campaign Styles in European
Parliamentary Elections’, Journal of Political Marketing, vol. 8 (1), 2009, pp. 7-19; C. H. de Vreese, E. Lauf and J. Peter, ‘The Media and European Parliament Elections: Second-rate Coverage of a Second-order Event?’, in: W. van de Brug, C. van der Eijk (eds.), European elections & domestic politics: lessons from the past and scenarios for the future, Notre Dame, Ind., University of Notre Dame Press, 2007, pp. 116-130.
CamPaIgNINg IN THE EurOPEaN ParLIamENT ELECTIONS
14
15
to the reasons explaining the low turnout. 3 The following enumeration does not claim to be
exhaustive, but it can certainly provide a useful background to reading the country reports included in this volume.
1. Low awareness of the European Parliament
Various and repeated opinions polls in all the EU Member States confirm a low level of civic awareness regarding both the nature, functioning and role of the European Parliament and of the system under which the Members of the European Parliament (MEPs) are elected. For example, according to pre-election Eurobarometer surveys conducted in late 2008, only about 23% of citizens felt well informed about these elections. More than a half of Europeans had never heard or read anything about the EP in any type of mass media, including the Internet. About a half also did not know that MEPs are elected by popular direct ballot. 4 Certainly, these
figures must have risen shortly before the election date, but the general conclusion of low-awareness of the EP remains.
A standard argument found in the academic literature links this low awareness to the resulting low turnout. However, it also has a very strong impact on campaigning styles. In a situation where awareness about the functioning of the EP and the nature of the election to this house is so low, national parties have no incentive to structure their main campaign messages around European issues. To offer a slightly simplified example, in national elections, even if certain issues can be very complex and difficult to understand for non-experts (e.g. macro-economic policy), parties can always refer to the everyday problems of the citizens, e.g. relating to the health system, unemployment, etc. In contrast, in the European Parliament elections such a campaigning strategy is difficult to conceive, simply because citizens do not realize the impact of the EU in general, and of the EP in particular, on their daily lives. Therefore, from a practical point of view, it is difficult to identify what the specific tenets of a campaign strategy, the specific selling points which should be targeted at the voters, should be. If only a very limited number of citizens are aware of the real nature and functions of the EP, if the politicians themselves often refrain from engaging in a debate about European issues (see the chapters in this volume), then no wonder that the whole campaign strategy is focused on national problems. Parties choose the terrain that they know best, that is, they repeat national campaign patterns, except for the fact that they do it on a much smaller scale and with fewer resources (see below).
What is especially noticeable is that although most parties develop detailed European programmes, they choose not to focus on them extensively, reverting instead to national issues. As Cater et al. note in this volume with regard to the UK, the issues in the parties’ manifestos and campaign literature were not the same as the themes that shaped the campaign. A similar mechanism was most apparent with regard to the German liberal Free Democratic Party, which despite developing an extensive programme for the European elections, ran a personalized campaign focusing on its top candidate in connection with national issues (see Brunsbach et al. in this volume). On the other hand, the 2009 elections proved that sometimes it is becoming increasingly difficult to distinguish between a national and a European issue. For example, climate change, the financial crisis, and some other issues can be treated both as national and European problems, depending on how they are presented by national politicians.
2. Unknown candidates
The whole matter is further complicated by the results of many opinions polls, which show that on average candidates for the European Parliament remain unknown to citizens. The fact that the Parliament is treated as an institution secondary to national parliaments often results in applying the same perspective to the candidates. Given that the whole campaign
3 For different explanations of a low turnout, see M. Matilla, ‘Why bother? Determinants of turnout in the European
elections’, Electoral Studies, vol. 22, 2003, pp. 449-468.
4 European Parliament Eurobarometer (EB Standard 70) - autumn 2008, http://ec.europa.eu/public_opinion/
wOjCIECH gagaTEk
is focused on national issues, then automatically national leaders come to the forefront. For this reason, parties often treat the European Parliament elections as a sparring match or rehearsal before more important national elections. In the 2009 elections, this was the case in Germany, Bulgaria, Romania, Portugal and Greece (see the country reports in this volume). For example, the Romanian parties used the election campaign for the European Parliament to advertise the Romanian presidential candidates for the election set for December 2009 (see Todor in this volume). In this situation, the European Parliament candidates remain largely in the background. The only exception is when well-known national politicians run for the European Parliament. To simplify a little, often this can be explained by politicians wanting to rebuild their positions in the EP and then return to national politics, or wanting to spend their political ‘pension’ there. In some cases they also do it to increase their parties’ vote share, and then give up the mandate to the next on the list. This was especially visible during the 2009 election in Italy, in which the leaders of almost all the major parties, including the Prime Minister Berlusconi himself, ran for the European Parliament as top candidates in each of the five Italian constituencies, only in order to further legitimize their position in national politics, without really intending to take up a seat in the European Parliament (see Bressanelli et al. in this volume). The effect then is that not only the candidates are unknown, but even the elected members of the house.
Finally we come to questions related to the design of the electoral system. An important issue is whether MEPs are elected from one single national list, or whether the country is divided into a number of regional constituencies. A large majority of the Member States (21 out of 27 to be precise) have adopted the single list system, in which the whole country forms an electoral constituency, and every citizen, regardless of place of residence, chooses among the same names. 5 Such a system influences the campaign style, with regional campaigning limited
to echoing national campaign patterns, rather than focusing on regional-level problems. 3. Concurrent elections
In 7 Member States the 2009 European Parliamentary elections took place together with national, regional or local elections. For example, this happened in Luxembourg (which traditionally holds European and national elections on the same day), Belgium (holding regional elections) and Latvia (local elections). The case of Bulgaria in 2009 nicely illustrates the dilemma over whether to hold national and European elections together (see Lyubenov in this volume) when the date of the national election is to be set within a relatively short time distance from the European one. The Bulgarian opposition argued for holding the European and national elections on the same day in order to increase turnout, whereas the governing parties preferred to have the elections separately so as to make sure that in the former there would be space to discuss EU affairs. The second option prevailed. However, since the distance between the national and European elections was only one month, the EP elections ended up being characterized both by a low turnout and a focus on national, rather than European, issues. Overall, much as concurrent elections generally are likely to increase the turnout, the side-effect is that in these circumstances national parties focus even more on national rather than European issues. Overall, the whole campaign strategy focuses on the national elections, with the European contest remaining in the background.
4. Few resources spent on the campaign
As the chapters in this volume illustrate, on average the funds appropriated by parties to the EP campaign usually vary between 10 to 30% of those spent on national elections, despite the
5 A difficult case concerns Germany, where CDU/CSU submits lists at the regional level (Länder) but the other
parties (SPD, Greens, FDP and Die Linke) propose single national lists. For a thorough and up-to-date analysis of legislation regarding all aspects of the EU elections, including regulations concerning election campaign, see W. Lehmann, The European Elections: EU Legislation, National Provisions and Civic Participation, European Parliament, Brussels, 2009, http://www.europarl.europa.eu/eplive/expert/multimedia/20090303MLT50670/ media_20090303MLT50670.pdf, accessed October 2009.
CamPaIgNINg IN THE EurOPEaN ParLIamENT ELECTIONS
16
17
fact that in some countries the overall amount of campaign expenditure in the 2009 EP election doubled (e.g. Sweden, Poland). Nonetheless, the relatively low amount of overall expenditure on EP elections both confirms that parties treat these elections as second-order contests and also explains the low intensity of campaigning. Certainly, besides the level of spending, it is also important to consider how parties spend their funds, but nevertheless these low figures speak volumes about what we can expect with regard to the intensity of EP election campaigns.
It is important to notice that in many Member States, low spending limits are set already by law. For example, in Poland parties and electoral committees can in practice spend a maximum of a third of what they spend in the national elections (see Gagatek et al. in this volume). In other words, legal rules can limit the possibility of organizing a high-profile campaign. However, we need to bear in mind that the rules on campaign spending have been passed by the parties themselves while acting in national parliaments. In all cases then, either by the letter of law or out of practical considerations, the parties themselves recognize that the EP elections are a second-order contest, and hence limit the amount of resources which they allocate to the campaign.
5. Lack of visible pan-European political parties
Many commentators observe that if these elections were really to be called ‘European’, one of the conditions would be that the campaign for the European Parliament should actually be coordinated by European political parties, rather than the national ones. Such European political parties, understood as federations of national political parties, have been present at the EU level for the last 30 years. There are currently ten Europarties, most of them based on the ideological commitments of certain party families in Europe and usually corresponding closely to their respective group in the European Parliament. Among the largest and most well known Europarties are the European People’s Party (EPP), uniting Christian democratic, centrist and like-minded parties; the Party of European Socialists (PES), gathering socialist, social democratic, labour and democratic progressive forces; the European Liberal Democrat and Reform Party (ELDR) and the European Green Party (EGP). Their principal role has always been focused on coordinating the activities of their national member parties at the EU level, for example by trying to develop common programmes, and enabling exchanges of views between heads of state and governments representing the same political family. For a few years they have even been directly financed by the EU. Despite this, their campaigning role has only recently started to emerge but is still practically speaking invisible. Awareness of their existence is minimal, and their resources are too limited to change this situation. The simplest explanation is that the national parties (who are members of their EU-level counterparts) are not in fact interested in coordinating their campaigns at the European level. For example, although most of these European political parties adopt a manifesto for the elections (agreed on by all of their national member parties), these manifestos are rarely used as the instruments of the national electoral campaigns. On the other hand, the logic of second-order elections understood as national contests, together with the variety of different national political contexts, makes it difficult to develop a viable pan-European campaign strategy. From this point of view, the EP elections are often presented as a number of national electoral contests with a European result, that is, affecting the political composition of the European Parliament.
6. Lack of purpose
Finally, the whole topic of EP elections is further complicated when we analyze their purpose. To offer a rather simplified explanation, the primary result of a national election either leads to the reconfirmation of the incumbent government or the nomination of a new one. In EP elections, on the other hand, no government at EU level is either reconfirmed or overthrown. The composition of the European Commission, and more specifically the nomination of Commissioners by national governments, depends in practice solely on the result of national rather than European elections. Even if a governing party (or parties) loses the EP elections, it still has the right to nominate the candidate for European Commissioner of its choice.
wOjCIECH gagaTEk
The only slight exception to this rule concerns the nomination for the president of the European Commission, who, according to the Treaty of Lisbon, should be nominated with a view to the result of the EP elections. In practice, this means that the candidate for Commission presidency should be affiliated to the largest political group in the European Parliament, which in fact had already happened informally even before the Treaty of Lisbon came into force on 1 December 2009, namely on the occasion of the first nomination of José Manuel Barroso in 2004.
Overall, compared to national elections, in the European Parliament elections there is much less at stake. From the point of view of campaign goals, the key point is to notice that the voters do not recognize the connection between the election result and the nomination for the presidency of the European Commission, or any other posts, as it is too distant and too vague. The overall effect is then that EP elections are often presented as having no discernible purpose. Certainly, there are many other factors to consider, but overall the above-mentioned tendencies have profound consequences on the way campaigning is conducted in all the EU Member States.
Convergence and differences in national campaign styles
Scholarship that emerged in the 1980s and 1990s offered a new view of the political party. Contrary to previous models of the traditional mass party, where a large active membership played an important role, the new models, such as electoral-professional or cartel parties, 6
diminish the role of the members and instead highlight the role of professional campaigners. From the point of view of this analysis it is important to notice that parties no longer rely on members in their campaigns, but instead revert to external help and the advice of professional campaigners, who organize centralized media-focused campaigns, often based on sophisticated research aiming at targeting the voters. 7 Political marketing, defined as the application of
business-like marketing principles to political campaigns, is therefore commonly employed by all parties, regardless of whether we are speaking about national or European Parliament campaigns. As explained above, the difference only lies in the level of resources attributed to political marketing, national campaigns being highly financed and European campaigns under-financed and low-profile.
From this point of view, it is important to notice that the professionalization of political campaigns in Europe has been largely influenced by American campaigning. The 2009 election also saw such an impact. Not only did many candidates shout Obama’s now proverbial ‘Yes We Can’ slogan, or focus on the word ‘change’ (the key slogan used in Obama’s campaign), but many of them also tried to copy web-based fund-raising techniques, modelled on the American example. Obviously this influence also concerns the use of Internet campaigning. Although the power of the Internet has always been highly regarded, the example of the 2008 US Presidential elections showed how important the use and development of Internet-based social networks can be. The 2009 elections in most countries showed that key questions for the candidates were: who has more ‘fans’ on Facebook, or who is more active on Twitter. What is especially important is that the mass media were very eager to report on the use of these new techniques by the candidates. Furthermore, the 2009 EP election saw the development of various web-based voting aid applications, with EU Profiler being offered in all Member States in all EU languages (see Breuer in this volume). However, from a general perspective, an Internet campaign is just one of several channels through which the parties try to reach voters. As the chapters in this volume confirm, the Internet is perceived as an excellent tool for reaching young voters, although traditional means, such as TV, posters and door-to-door canvassing, are the major forms of political communication. However, apart from the potentially large
6 See A. Panebianco, Political Parties: Organization and Power, Cambridge University Press, Cambridge; New York,
1988; R. Katz and P. Mair, ‘Changing Models of Party Organization and Party Democracy: The Emergence of the Cartel Party, Party Politics, vol. 1 (1), 1995, pp. 5-28.
7 See D. M. Farrell and P. Webb, Political Parties as Campaign Organizations in R. J. Dalton and M. P. Wattenberg
(eds.), Parties without partisan: political change in advanced industrial democracies. Oxford University Press, Oxford, 2000, pp. 129-153.