21
How neutral is the choice of the allocation
mechanism in cap-and-trade schemes? Evidence
from the EU-ETS
*di Nicola De Vivo† e Giovanni Marin‡
Abstract
The European Emission Trading Scheme (EU ETS) is the central EU policy instrument aimed at mitigating climate change. According to Coase (1960), the level of emissions for each firm in an emission trading, in equilibrium, does not depend on the assignment of property rights over the emissions but this could not be the case in a real-world system, with a lot of possible frictions, as transaction costs and behavioural anomalies.
This paper exploits the asymmetry in the allocation mechanisms introduced from the third phase of the EU ETS to evaluate whether different allocation mechanisms are neutral in terms of emission abatement decisions. Results suggest a non-neutral role of the allocation mechanisms.
Keywords: EU ETS, grandfathering, auctioning, carbon leakage. JEL Classification: Q54, Q58.
Quanto è neutrale il meccanismo di allocazione dei permessi in
uno schema di cap-and-trade? Evidenza basata sull’EU ETS
Sommario
L’Emission Trading Scheme Europeo (EU ETS) è il principale politico dell’UE per la mitigazione del cambiamento climatico. Secondo Coase (1960), il livello di emissioni di ogni impresa appartenente a un emission trading, in equilibrio, non dipende dall’assegnazione dei diritti di proprietà riguardo al permesso a inquinare. Questa assunzione potrebbe fallire nel mondo reale a causa di possibili frizioni, costi di transazioni e anomalie comportamentali.
Questo articolo sfrutta l’asimmetria nel meccanismo di allocazione dei permessi introdotta a partire dalla terza fase dell’EU ETS per valutare se diversi meccanismi di allocazione sono neutrali in termini di decisioni di abbattimento delle emissioni. I risultati indicano un ruolo non neutrale dei meccanismi di allocazione
Parole chiave: EU ETS, grandfathering, aste, carbon leakage. Classificazione JEL: Q54, Q58.
* This paper is a revised version of a chapter in the PhD dissertation of Nicola De Vivo. † IMT Institute for Advanced Studies Lucca, Piazza San Ponziano, 6, 55100 Lucca (Italy). E-mail address: [email protected].
‡ Department of Economics, Society and Politics, University of Urbino ‘Carlo Bo’. E-mail address: [email protected].
22
Introduction
Since the very beginning, the European Emission Trading Scheme (EU ETS) has attracted a lot of attention among scholars and policy makers, because it is the central EU policy instrument in order to mitigate climate change and to comply with the target agreed in the Kyoto protocol. The EU ETS represents the first attempt to develop a transboundary system of emissions trading and, therefore, it represents a prototype to other ETSs spreading around the world (see Borghesi et al, 2016). The attractiveness of a cap-and-trade scheme like the EU ETS is due to the fact that, under certain conditions, it allows to attain a certain environmental target exogenously defined in an efficient way as a homogeneous price for emission permits across all the participants to the scheme will induce the equalization of marginal abatement costs.
According to the conventional wisdom (Palmer et al, 1995), by setting a price for carbon emissions the EU ETS adds a constraint to firms, thus reducing (at least from a static point of view) expected profits with respect to a no-policy scenario. Many recent papers (see Marin et al, 2017, for recent evidence on manufacturing firms in the EU, and Martin et al, 2015, for a comprehensive review) have looked at the potential impact of the EU ETS on the economic performance of treated firms, finding mixed evidence on a large variety of measures of economic performance (productivity, turnover, employment, etc). Carbon pricing, however, also induces investments in low carbon technologies aimed at reducing the cost of complying with the regulation. Calel and Dechezlepretre (2016) found a significant positive inducement effect of the EU ETS on the development of low-carbon technologies (measured with new patent applications) for EU ETS firms. According to Porter and van der Linde (1995), the impact of environmental regulation on innovation could partly (weak version of the Porter Hypothesis) or even more than compensate (strong version of the Porter Hypothesis) for the costs of compliance, leading to improved economic performance of regulated firms.
The potentially harmful impacts on the competitiveness of European firms subject to the EU ETS coupled with the fact that the EU ETS was unilaterally introduced in Europe may induce firms to relocate their carbon-intensive production activities in countries with less stringent regulations for mitigating climate change (carbon leakage effect, see Martin et al, 2014
23
and, for Italy, Borghesi et al, 2018).1 Carbon leakage has two negative implications for the country (or group of countries) that introduces a unilateral stringent climate mitigation policy. First, in case the strong version of the Porter Hypothesis does not hold, emissions are just partly or fully displaced towards other countries. As GHG emissions are global externalities (i.e. they contribute to global warming no matter where they are emitted), a simple displacement of carbon intensive activities undermines the environmental objective of the regulation. Second, the relocation of carbon-intensive industries has a negative impact on the wealth and jobs created within the country. For this reason, the European Commission has been particularly sensitive about the issue of carbon leakage. In the first two phases of the EU ETS, emissions permits were allocated for free (i.e. grandfathering) while starting from the third phase (2013-2020) an increasing share of permits will be sold in auctions (generating revenues for public budgets) just for those sectors that are not exposed to carbon leakage risks.
According to the seminal paper by Coase (1960), the level of emissions of each firm in equilibrium does not depend on the assignment of property rights over the emissions. If we apply this statement to the case of the EU ETS that means that the same result in terms of the distribution of abatement choices should be attained independently on the choice of the allocation mechanism. Different allocation mechanisms would only generate a different distribution of net benefits across firms or between firms and the government. This nice theoretical result implies that cap-and-trade schemes attain the equalization of marginal abatement costs across firms and thus a socially efficient distribution of the burden for climate policy. On the other hand, if for any reason the allocation mechanism is no longer neutral, a cap-and-trade scheme does not necessarily represent a first-best solution.
In this paper we exploit the asymmetry in the allocation mechanisms introduced from the third phase of the EU ETS as a way to evaluate whether different allocation mechanisms are neutral in terms of emission abatement decisions. The paper is structured as follows. In section 2 we
1 There is an extensive literature on the so-called ‘Pollution Haven Effect’ that is aimed at evaluating (theoretically and empirically) the extent to which stringent environmental regulation in one country induce the displacement of pollution intensive activities towards unregulated countries (e.g. Frankel and Rose, 2005). Empirical analysis on this topic found mixed results, depending on the type of approach (micro vs macro estimates), the type of environmental regulation, the environmental pressures that is evaluated and the sample of regions and countries that are considered.
24
describe in detail the European Emission Trading Scheme. Section 3 provides a theoretical discussion of the issues at stake, with a focus on the role played by carbon leakage considerations within the EU ETS and the possible reasons that may explain non-neutrality of the allocation mechanism. Section 4 provides an overview of recent trends in allocated and verified emissions for the EU ETS. Section 5 provides empirical evidence on whether verified emissions are independent on the allocation mechanism. Section 6 concludes.
1. The EU ETS
The EU ETS was introduced by the Directive 2003/87/EC2 as the main initiative of the European climate change mitigation policy to reach the Kyoto targets and in order to be compliant with other current and future regional and international targets. In a few words, this is a cap-and-trade scheme put in place in order to keep CO2 emissions under control: in this scheme, emissions permits are allocated to the participants at the beginning of each period, either for free (also known as grandfathering) or auctioned. At the end of each period, all the participants are required not to have debt on emissions, that is they are required to return an amount of emissions permits at least corresponding to the actual amount of verified emissions. In the meantime, permits can be traded on a market, that is they can be transferred between participants at a price per ton of CO2 that, in equilibrium, should be equal to the marginal abatement cost, leading to efficient distribution of abatement across participants. Within the EU ETS, the penalty for non-complying (that is, a participant is not able to return a sufficient number of emissions permits at the end of the compliance period) was set to 40 euros per ton in the pilot phase (2005-2007) and to 100 euros per ton for the period 2008-2012.
In this scheme, three main periods can be identified: the period 2005-2007 represented a pilot phase. No banking of unused permits was allowed between the pilot phase and subsequent EU ETS phases. The first commitment period (2008-2012), that was even the period leading to the Kyoto commitment period (2012), extended the scope of the scheme to aviation (2012) and increased the penalty for non-compliant plants to 100 euros per ton. Finally, the second commitment period (2013-2020)
2 Emended by the Directives 2004/101/EC and 2008/101/EC, the Regulation 219/2009 and the Directive 2009/29/EC.
25
introduced a single cap valid for all the EU for total emissions and a rising use of auctioning in the allocation of permits, with some exception for selected sectors.
The EU ETS covers, now, all EU28 countries plus Norway, Iceland and Liechtenstein. As it is characterised by substantial sunk and fixed costs (including administrative and monitoring costs for participants and governments), the Commission decided to include in the scheme only the biggest emitters of CO2. These emitters are identified by their sector of operation (or type of activity) and by the size of the plant in terms of production capacity. The scheme currently covers about 11,000 plants in Europe that contribute to around 45 percent of overall European greenhouse gases emissions.3 The sectors and thresholds involved in the ETS scheme are reported in Annex I of the Directive and have been emended twice since 2003.
However, some exemptions were awarded in order to reduce the possible carbon leakage effect, that is the phenomenon for which firms may relocate part of the production in countries where this kind of regulation is not in place: this effect may hinder the policy effectiveness of the regulation. In this light, a major amendment to the Directive concerned the differentiation of the allocation scheme across sectors for the second EU ETS commitment period (2013-2020) according to the criteria described in the new articles 10 bis and 10 ter (Directive 2009/29/EC). The Decision of the European Commission 2010/2/EU ‘Determining, pursuant to Directive
2003/87/EC of the European Parliament and of the Council, a list of sectors and subsectors which are deemed to be exposed to a significant risk of carbon leakage’ provided a list of 4-digit NACE sectors for which
permits could be grandfathered rather than auctioned also in the second commitment period due to potentially relevant risks of off-shoring of these production activities deriving from the EU ETS. These sectors were identified through qualitative and quantitative analysis on the importance of potential carbon leakage and, to some extent, through a political negotiation. Three main criteria were included in the amendment to identify the list of sectors to be exempted from auctioning:4
• The first is a ‘trade-based’ criterion according to which industries (4-digit NACE) having a non-EU trade intensity (import plus export over
3 http://ec.europa.eu/clima/policies/ets/index_en.htm
4 A fourth criterion refer to qualitative assessment (Art. 10bis.17) of the likely impact of EU ETS on production costs, investments and profit margins.
26
domestic production) greater than 30% are exempted from auctioning (trade criterion);
• The second refers to those industries (4-digit NACE) that are expected to experience additional (either direct and indirect) costs as a consequence of the implementation of the ETS Directive greater than 30% of their gross value added (emission criterion);
• The last criterion concerns industries (4-digit NACE) having, at the same time, moderate trade intensity and implementation costs (trade intensity greater than 10% and costs greater than 5% of gross value added.5
The list was subsequently further emended to add other sectors with the decisions of the European Commission 2012/498/EU (that added sector 2614 ‘Manufacture of glass fibres’) and 2014/9/EU (that added sector 2653 ‘Manufacture of plaster’ and sector 2662 ‘Manufacture of plaster products for construction purposes’). However, the practice of exempting specific sectors from existing regulations is not uncommon: as Martin et al. (2015) recall, since the introduction of carbon taxes back in the ‘90s, most of the countries involved grant some sort of exemptions to energy intensive firms to avoid their relocation.
2. Literature review
As a free allocation scheme can potentially have distorting effects on the effectiveness and the working of an emissions cap-and-trade system, this issue has increasingly attracted interest from research and policy communities. This is because the absence of distortionary effects of free allocations can be seen as a necessary condition for the cost-effectiveness of a cap-and-trade scheme. Whether such distortions occur or not is, obviously, of particular interest, especially for those cap-and-trade schemes in which a large portion (or even the most) of the total allowance allocation occurs practically free of charge: installations receive a free an annual endowment of permits, usually based on the installation’s history in terms of verified emissions. If we were in an idealized world, allocations and emissions had to be totally independent: in this way, any arbitrary distributions of property rights would not affect outcomes, either on the
5 These criteria are thoroughly discussed in the following document: http://ec.europa.eu/clima/policies/ets/cap/leakage/documentation_en.htm
27
trading side and on the emissions side (Coase, 1960). The occurrence of this independence property in actual cap-and-trade schemes would be a very important finding as this leave to policy-makers the freedom to use free allocation of allowances in a political way, letting the cap-and-trade system do not suffer any negative consequence, especially in terms of cost effectiveness (Hahn and Stavins, 2011). However, in a real-world cap-and-trade system, there are a lot of reasons for which a free allocation of permits could distort and affect emissions outcomes, for example the presence of transaction costs (Coase, 1960; Stavins, 1995) or behavioural anomalies (Kahneman et al., 1991). So, ensuring in a rigorous way if different allocation mechanisms affect emission outcomes becomes of major relevance.
The insight that, in the absence of any significant friction, optimal emissions at the installation level are invariant with respect to the initial allocation of property rights dates back to Coase (1960). Hahn and Stavins (2011) defined this invariance as the independence property in cap-and-trade systems. It has been shown that this independence (or invariance) property holds in a frictionless cap-and-trade system, as long as allocation occurs in a lump-sum fashion (Montgomery, 1972). However, as we said before, there is a number of reasons why this independence property could fail in a real-world cap-and-trade scheme, when installations receive some endowments of allowance allocations free of charge, even when the allocation is a lump-sum one. Transaction costs (Stavins, 1995) or imperfect competition (Hahn, 1984) can lead to some kind of distortions in installation-level emission and abatement outcomes. This independence property can fail also due to some behavioural anomalies. It has been shown in the behavioural economics literature that in experimental settings subjects value their allowance in a different way, depending on their allocation status, leading to under-trading and a loss in cost-effectiveness in the cap-and-trade system (Kahneman et al, 1990; Murphy and Stranlund, 2007).
However, using empirical analysis, it is still challenging to evaluate in a rigorous way whether there exists a causal relationship between installation-level allocation and emissions. The main difficulty is due to the endogeneity of allocations, which are typically correlated to historical plant-level emissions. Therefore, in order to identify an actual causal effect of allocation on emissions, we require an exogenous source of variation in allocation. This is the major reason why the empirical literature focusing on the causal relationship between emissions and initial allocations in cap-and-trade systems is very poor, consisting of only two papers. Fowlie and Perloff (2013) investigate this question, using the context of California’s
28
RECLAIM program6 and using an instrumental variable approach to identification. Reguant and Ellerman (2008), instead, investigate the same question for Spanish thermal power plants regulated under the EU ETS during ETS Phase I (2005-2008) and exploit a non-linearity in the national allocation rule for identification. Both of these papers did not find a significant endowment effect.
Which are the reasons that motivate a free allocation system in a cap-and-trade scheme? When a government intervenes in a marketplace, this intervention is always intended as a mean to increase net social welfare. Increasing social welfare by regulation could impose a cost on some industries for being compliant to the new regulation and then a government could use part of the revenues to partially compensate industries. This distributional effect of the new regulation could have, in principle, consequences on the policy design. Let us suppose industries are offered no compensation at all, then the same industries have strong incentives to spend money on supporting political parties that are against the regulation, or to push to have exemption clauses, that could weaken the policy’s effectiveness. Even worse, new regulation could push industries to relocate to unregulated countries, and this is a threat for politicians, as job losses could affect re-election probability.
When we are dealing with policies about climate change (that is a global externality), this threat about relocation is even worse because of the so-called ‘carbon leakage’. The relocation of industrial production does not only shift jobs to other countries, but also relocates GHG emissions: in this way, the policy does not only cause job losses in the country (or countries, in case of trans-national regulation) but does not reach the goal in environmental terms. The threat of relocation within the EU ETS gave rise to the three exemption criteria that were discussed in section 2.
6 REgional CLean Air Incentives Market is an emission trading program operating in the state of California since 1994. This program was imposed by SCAQMD (South Coast Air Quality Management District) in order to replace a series of more than 40 prescriptive rules, which had been opposed by the industry. The main goal of the program was to make so that hundreds of polluting facilities cut their emissions of nitrogen oxides (NOx) and Sulphur Oxides (SOx). At its inception, in 1994, RECLAIM included 392 facilities whose combined NOx emissions accounted for over 65% of the region's stationary NOx emissions. Almost all facilities in SCAQMD with annual NOx or SOx emissions of four tons or more were included in the program. A RECLAIM trading credit (RTC) confers the right to emit one pound of emissions in a twelve-month period. At the outset of the program, facilities were informed of how many permits they would be allocated for free each year through 2010. NOx emissions permitted under RECLAIM were reduce by over the 70 percent over the first ten years of the program.
29
Nonetheless, the importance of carbon leakage in climate policy design, there is little empirical evidence about the link the defined EU criteria and a sector’s vulnerability to carbon leakage. All the existing studies are ex-post ones and they find no evidence of possible strong adverse impacts of the new regulation on competitiveness indicators, in case allocations are given for free: see, for example, Anger and Oberndorfer (2008); Abrell et al., (2011); Bushnell et al. (2013); Chan et al. (2013); Commins et al. (2011); Petrick and Wagner (2014); Wagner et al. (2013); Borghesi et al. (2018). Instead, if we move to theoretical and simulation-based studies, we find a negative impact of the new cap-and-trade scheme on production in most manufacturing industries: see, for example, Reinaud (2005); Demailly and Quirion (2006, 2008); McKinsey and Ecofys (2006a, 2006b). They also show that the free allowances allocation compensates negative profit impacts in most industries and can even lead to overcompensation, as shown in Smale et al. (2006).
3. Trends in emissions within the EU ETS
In this section, we analyse the behaviour of emission distribution, either considering our whole data-set and splitting it in different subsets. We employ data at the establishment level available from the European Union Registry for the period 2008-2014.7
As a first step, we plot the rank-size distribution, reported in Figure 1. The figure is built in the following way: we sort all the plants in our dataset in a descending order on the basis of their verified emissions and we rank them from 1 to n, then we plot the logarithm of emissions and the logarithm of rank. The distribution has essentially the same shape for the first and last year of our series (2008 and 2014, respectively). What is worth noticing is that the distribution in 2014, with few exceptions, lies below the distribution for 2008 (only the highest ranks behave in the opposite way, having an amount of verified emissions that is greater with respect to the 2008) signalling that, in those 6 years, emissions have been lowered.
30
Fig. 1 - Log Emissions vs Log Rank
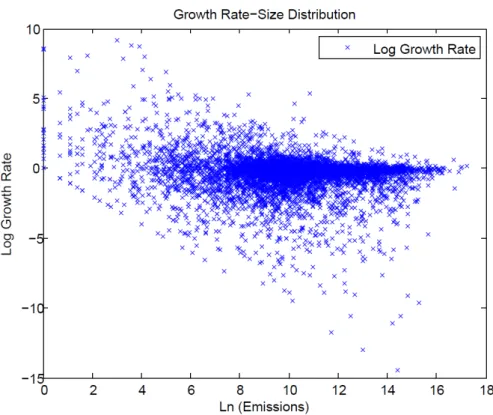
In Figure 2 we reported, for each plant for which we have data both in 2008 and in 2014, the plant’s verified emission growth rate (computed as logarithmic return: log(emissions(2014)/emissions(2008))) against the logarithm
of the initial emission size (verified emissions in 2008). The plot suggests that there has been a decrease in the growth rate as the emissions’ size increase, i.e. the smallest plants have a higher growth rate with respect to the biggest ones. As there is large variance in the growth rate in verified emissions across plants, we decide to split the sample in smaller quantiles of verified emissions and take the mean logarithmic growth rate within each quantile. This plot is much clearer than the first one, confirming our first impression of growth rate decreasing as a function of initial emissions’ size. Moreover, as we found a very regular behaviour, we tried to fit it, obtaining a very good fit with a power law distribution (R squared equal to 0.63, not reported), as we show in Figure 3.
31
Fig. 2 - Log Growth Rate vs Log (Emissions)
The decreasing relationship seems to be quite glaring: whereas the largest emitters decreased (on average) their amount of emissions, the smallest emitters, on average, increased a lot their amount of emissions. This result seems to go against the evidence discussed for Figure 3. However, this is not the case because, as we said before, in Figure 3 we do not have any hint about which plant was in the highest ranks in 2008 and which in 2014 whereas in Figure 4 on the x-axis the ranking in 2008 is, in a way, considered and we can observe how it changed throughout those 6 years. Moreover, whereas in Figure 3 there is a complete representation of all our data, in Figure 4 each point represents an average of plants that fall in the same bin.
32
Fig. 3 - Log Growth Rate vs Log (Emissions)
So far, we considered the longest period for which we have data (from 2008 to 2014). However, as discussed in the previous sections, during this period, the regulation moved from the second phase (2008-2012) to the third phase (from 2013 onwards), in which emissions were not any more freely allocated (grandfathering) but increasingly auctioned, with the exclusion of leakage-exposed sectors. As discussed in the theoretical part, this change in the regulation should not have effect on the polluting behaviour of the plants as at the margin the opportunity cost of emitting or abating should remain the same. As a first step to evaluate this hypothesis, we look at the logarithmic growth rate of emissions as a function of the ratio between verified and allocated emissions: this could represent a measure of how much impact could have the change of normative on plants’ emissions (Figure 4).
The figure is realized in the following way. On the y-axis, as we did before, we report the logarithmic growth rate of emissions, whereas, on the x-axis, we report the ratio between verified and allocated emissions. Each point in the plot represent the mean logarithmic growth rate and the mean ratio of verified and allocated emissions of several plants falling in the same bin.
33
Fig. 4 - Logarithmic emissions’ growth rate as a function of the ratio between verified and allocated emissions
2008-2012
2013-2014
On the left, we find the plot for the period 2008-2012 whereas, on the right, we can find the plot for the period 2013-2014. The red line is a zero-level line in order to distinguish plants who increased their emissions from plants who decreased their emissions.
In this way, we can distinguish different behaviours for plants who needed to buy allowances on the market to cover their verified emissions (that is, the average verified-to-allocated emission ratio is greater than one) and plants who could sell allowances on the market because they were endowed with more than needed (verified-to-allocated emission ratio below one). As we can see from the figure, there was a huge change in the polluting behaviour from the first period (2008-2012, first ETS and Kyoto commitment period) to the second period (2013-2014). The difference is particularly big for plants whose ratio between verified and allocated emissions is greater than 1.
Lastly, we wanted to check if this different polluting behaviour is different between exempted and not exempted sectors, in order to see whether the above-mentioned exemption from auctioning could have had an impact on the behaviour in the two periods. To do so, we repeat the plot of Figure 4 splitting our sample in two, one for plants in sectors that were exempted (Esentati) and one for plants in sectors that were not exempted (No Esentati). Results are reported in Figure 5.
34
Fig. 5 - Logarithmic emissions’ growth rate as a function of the ratio between verified and allocated emissions
2008-2012
2013-2014
On the left, we find the plot for the period 2008-2012 whereas, on the right, we can find the plot for the period 2013-2014. In red, we find plants in exempted sectors whereas, in blue, we find plants in not exempted sectors.
There does not seem to be a systematic difference in emission growth in the two periods between exempted and non-exempted plants for different levels of the average verified-to-allocated ratio. When looking at trends in verified and allocated emissions (Figure 6) we observe that, even before the exemption, the amount of permit allocated to sectors more exposed to trade systematically exceeded the amount of verified emissions while the opposite occurred for sectors not exposed to leakage. This fact is a signal that even before the change in regulation sectors exposed to leakage were either over-endowed of permits or they were over-abating with respect to other sectors. As expected, the number of allocated permits dropped substantially (almost to zero) for establishments in non-exempted sectors from 2013 onwards, while the drop was much smaller for establishments in exempted sectors. Interestingly, in 2013 (first year after the reform) verified emissions of sector exempted from auctioning increased substantially while verified emissions of other sectors (that had to buy permits) experienced a moderate growth. This is a first indication that the initial endowment of permits matters for the distribution of pollution abatement.
35
Fig. 6 - Trend in verified and allocated emissions for exempted and non-exempted plants
4. Regression analysis
The detailed descriptive evidence highlighted so far suggests that plants in those sectors that were forced to purchase pollution permits through auctions from 2013 onwards reduced their emissions relatively more than plants in sectors exempted from auction. This may suggest that the allocation mechanism chosen by the regulator is not neutral in terms of abatement choice of firms and that the coexistence of different allocation mechanisms within the same cap-and-trade scheme may generate distortions. To better identify whether this descriptive evidence is not the result of other factors that influence emissions and abatement choice we employ a state of the art econometric approach to evaluate whether this change in regulation influenced abatement choices.
A recent paper by Zaklan (2016) evaluates the impact of the same change in the allocation mechanism of the EU-ETS only for plants that operate in the power sector. Their identification is based on the fact that for 8 EU countries (with a GDP per capita below 60% of the EU average) obtained from the Commission a postponement of the allocation through
36
auction for plants in the power sector up to year 2020 to ease the modernization of the power sector. Exploiting this asymmetry in regulation, the authors find little support for significant impacts of heterogeneous allocation mechanisms on verified emissions in the power sector.
It should be noted, however, that the features of the power sector (i.e. large firms, non-tradability of the output and inelastic demand for electricity) are likely to attenuate the expected impact of changes in allocation mechanisms on abatement behaviour. Companies in the power sector can easily pass-through increases in production costs to consumers, creating little incentives, at least in the short term, to change their abatement behaviour. On the contrary, plants in tradable industries such as manufacturing industries, exposed to international competition, have much smaller possibility to pass through higher upfront costs for complying with the regulation and may decide to change their abatement behaviour even in the shorter run. For this reason, our focus from now onwards is on the manufacturing industry only.
To evaluate how the distribution of pollution abatement changed after the reform of the EU-ETS that exempts plants in specific sector from auctioning we estimate a simple econometric model. The idea is that in absence of exemption, verified emissions and allocation of permits would have evolved in the same way for both treated and control plants. As we expect that plants belonging to section exempted from auctioning differ systematically in pre-treatment features from other ETS plants, we identify a suitable counterfactual by means of a propensity score matching approach. We thus estimate the following equation on the sample that contains treated and matched (based on propensity score) control plants:
𝑙𝑜𝑔(𝑉𝑒𝑟𝑖𝑓𝑖𝑒𝑑_𝑒𝑚𝑖𝑠𝑠𝑖𝑜𝑛𝑠/0) = 𝛽 𝐴𝑢𝑐𝑡𝑖𝑜𝑛9× 𝑃𝑜𝑠𝑡20130+ 𝑋B𝛾 + +𝜏0+ 𝛼/+ 𝜀/0
where 𝑉𝑒𝑟𝑖𝑓𝑖𝑒𝑑_𝑒𝑚𝑖𝑠𝑠𝑖𝑜𝑛𝑠/0 represents verified emissions for establishment i in year t, 𝐴𝑢𝑐𝑡𝑖𝑜𝑛9 is a dummy variable (time-invariant) that equals one for those sectors that are not exempted from auctioning from 2013 onwards, 𝑃𝑜𝑠𝑡20130 equals one for years 2013 and 2014 and zero otherwise, 𝑋B is a vector of control variables (EU28-level trends in production by 4-digit NACE sector in log from PRODCOM, country-specific dummies and sector country-specific - 2 digit NACE - dummies), 𝜏0 are time dummies and 𝛼/ is the plant fixed effect.
37
Our parameter of interest is 𝛽 which describes the estimated decrease in verified emissions in establishments that are required to purchase permits with auctions from 2013 onwards. This is a simple difference-in-difference approach. The identification assumption is that treated and untreated individuals would have followed the same trend in absence of the treatment. As the assignment to treatment is not random (i.e. it is based on the sector of operation of the plant), there are many possible reasons that may give rise to different trends in emissions even in absence of the treatment. We already partly account for these confounding factors with the inclusion of the establishment fixed effect (that account for time-invariant differences across plants), the sectoral trend in production (that account for the dynamics of demand), country-specific trends and activity-specific trends. This may not be enough as other systematic differences between plants in different sectors may give rise to different trends. For this reason, we try to further reduce the heterogeneity between treated and control plants by matching controls to treated by means of the propensity score. We estimate the probability of belonging to non-exempted sectors as a function of trends in production for the 4-digit NACE sector over 2005-2009 (to account for possible difference in output growth), average ratio between verified and allocated emissions in 2008-2009 for the 4-digit NACE sector to account for pre-treatment systematic over- or under-endowment in the sector, the log of verified emissions in the plant for 2008 to account for differences in the size of plants and country dummies. As a baseline, we employ kernel matching to exploit as much information as possible about controls in a flexible way. In this way, in fact, the counterfactual is a weighted average of different controls, with weights being specific for each treated and inversely proportional to the distance in terms of estimated propensity score.8
Results of the propensity score estimate and of the balancing (before and after matching) are reported in Table 1. The propensity score is successful in reducing the heterogeneity in terms of all the variables we included in the propensity score estimation.
Figure 7 reports the distribution of the estimated propensity score for treated, all controls and matched controls. The density function for treated and controls is very similar, suggesting that the two groups are rather
8 As a robustness check we also repeat our analysis with one nearest neighbour matching with caliper (0.05) to reduce the possible bias of using very heterogeneous controls in the kernel approach.
38
homogeneous after matching. The dark grey dot, however, describes a plant that was not matched due to absence of common support in the propensity score.
Tab. 1 - Propensity score and balancing
Propensity score Pr(Auction=1) Average treated Average controls (all) t-test on the difference Average matched controls t-test on the difference Growth in production (4-digit
NACE) -0.0103** 1.415 2.5239 -4.02*** 1.2391 0.450 for 2005-2009 (0.0061) Average verified/allocated emissions 1.760*** 0.7781 0.75477 2.58** 0.76895 1.30 (4-digit NACE) for 2008-2009 (0.2666)
log(verified emissions of the
plant, 2008) 0.241*** -0.4296 -3.413
-11.32*** -4.2739 0.851
(0.0211)
N 2867
Fig. 7 - Distribution of estimated propensity score
Average treatment effect on the treated, where the outcome variable is the growth in emissions for the years 2009 to 2014 with respect to emissions in 2008, are reported in Table 2. These are simple difference-in-differences estimates, with no additional control variable. We observe that the estimated difference in growth rates in verified emissions between
0 1 2 3 4 0 .2 .4 .6 .8 1 Predicted PS
Treated Matched controls
39
treated and controls is small and insignificant until 2012 and becomes large and significant from 2013 onwards, that is the year in which we observe the change in regulation. Overall, the estimated difference is around 12 log points in 2013 and reaches 14.6 log points in 2014, pointing to a large estimated effect. The negative sign means that those plants that continued to receive their allowances for free have increased their emissions with respect to the ones that had to purchase them in auction, leading to non-neutrality of abatement choices with respect to allocation mechanisms.
Tab. 2 - Average treatment effect (simple difference in differences on matched plants)
Treatment effect Difference SE t-test Change in log verified Unmatched 0.0425 (0.0220) 1.94* emissions 2008-2009 ATT 0.0284 (0.0253) 1.13 Change in log verified Unmatched 0.0111 (0.0241) 0.46 emissions 2008-2010 ATT -0.0014 (0.0275) -0.05 Change in log verified Unmatched -0.0098 (0.0309) -0.32 emissions 2008-2011 ATT -0.0256 (0.0345) -0.74 Change in log verified Unmatched 0.0225 (0.0331) 0.68 emissions 2008-2012 ATT -0.0096 (0.0359) -0.27 Change in log verified Unmatched -0.0425 (0.0424) -1.00 emissions 2008-2013 ATT -0.1203 (0.0415) -2.90*** Change in log verified Unmatched -0.0674 (0.0483) -1.40 emissions 2008-2014 ATT -0.1457 (0.0499) -2.92***
Tab. 3 - Difference-in-differences with kernel matching and controls
log(verified emissions) (1) (2) (3) (4) (5) (6) Exempted x anticipation (2010-2012) -0.0133 -0.0264 -0.0209 -0.0276 -0.0227 -0.0293 (0.0211) (0.0234) (0.0232) (0.0271) (0.0229) (0.0273) Exempted x post 2013 -0.0762** -0.147*** -0.162*** -0.205*** -0.163*** -0.205*** (0.0353) (0.0384) (0.0382) (0.0500) (0.0373) (0.0491) log(Production, NACE 4-digit) 0.510*** 0.0540 0.523*** 0.0931 (0.0804) (0.114) (0.0835) (0.110) Matched on PS No Yes Yes No Yes Yes Year dummies Yes Yes Yes Yes Yes Yes Sector (NACE 2 digit) year
dummies No No No Yes No Yes
Country-year dummies No No No No Yes Yes N 20125 20055 20055 20055 20055 20055 Fixed effects model. Robust standard errors in parenthesis. * p<0.1, ** p<0.05, *** p<0.01. Only establishments observed all years over the period 2008-2014 are included.
Our baseline estimates (that also account for a series of control variables) are reported in Table 3. Column 1 reports estimates for the full sample with no matching of treated with similar controls while in the other columns we weight plants according to the weights estimated in the matching phase. Column 6 is our favourite estimate, in which we match treated with similar control and add the full set of control variables. The
40
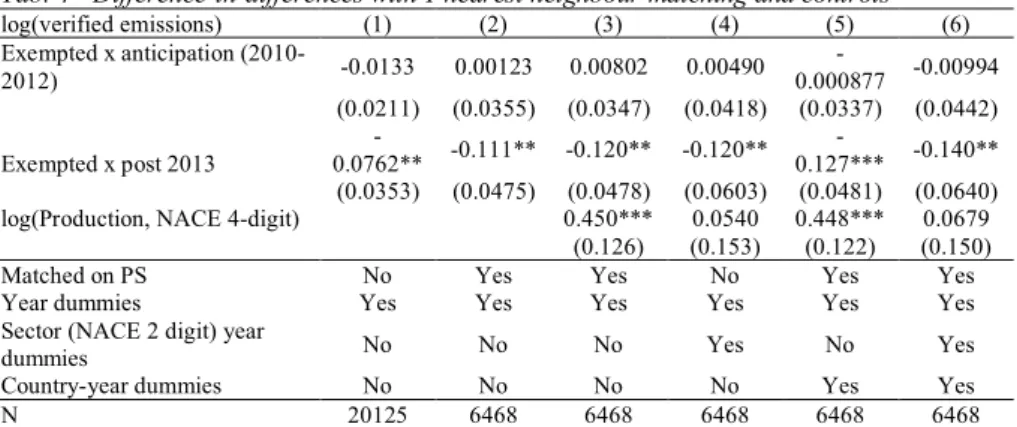
treatment effect is negative, significant and around 20.5 log points. We also account for possible anticipation effects as the exemption was already agreed upon in December 2009. Overall, there is no evidence of anticipation which turns out to be insignificant in all estimates. Results appear to be very similar (though smaller in magnitude) when using the one nearest neighbour matching algorithm (Table 4). Finally, when looking at the time profile of the estimated effect in a more flexible way (Table 5) we observe that no effect is found before 2013 while the effect is large and robust afterwards, especially so in 2014.
Tab. 4 - Difference-in-differences with 1 nearest neighbour matching and controls
log(verified emissions) (1) (2) (3) (4) (5) (6) Exempted x anticipation (2010-2012) -0.0133 0.00123 0.00802 0.00490 -0.000877 -0.00994 (0.0211) (0.0355) (0.0347) (0.0418) (0.0337) (0.0442) Exempted x post 2013 -0.0762** -0.111** -0.120** -0.120** -0.127*** -0.140** (0.0353) (0.0475) (0.0478) (0.0603) (0.0481) (0.0640) log(Production, NACE 4-digit) 0.450*** 0.0540 0.448*** 0.0679
(0.126) (0.153) (0.122) (0.150)
Matched on PS No Yes Yes No Yes Yes Year dummies Yes Yes Yes Yes Yes Yes Sector (NACE 2 digit) year
dummies No No No Yes No Yes
Country-year dummies No No No No Yes Yes
N 20125 6468 6468 6468 6468 6468
Fixed effects model. Robust standard errors in parenthesis. * p<0.1, ** p<0.05, *** p<0.01. Only establishments observed all years over the period 2008-2014 are included.
Tab. 5 - Time profile of the effect
log(verified emissions) (1) (2) Exempted x D2009 -0.0281 -0.0491 (0.0312) (0.0472) Exempted x D2010 -0.0355 -0.0275 (0.0313) (0.0485) Exempted x D2011 -0.0327 -0.0262 (0.0370) (0.0623) Exempted x D2012 -0.0612 -0.0472 (0.0487) (0.0740) Exempted x D2013 -0.202*** -0.122 (0.0529) (0.0775) Exempted x D2014 -0.234*** -0.205*** (0.0583) (0.0763) log(Production, NACE 4-digit) 0.103 0.0939
(0.115) (0.153)
Matching Kernel One NN
Year dummies Yes Yes
Sector (NACE 2 digit) year dummies Yes Yes
Country-year dummies Yes Yes
N 20125 19810
Fixed effects model. Robust standard errors in parenthesis. * p<0.1, ** p<0.05, *** p<0.01. Only establishments observed all years over the period 2008-2014 are included.
41 Concluding remarks
The paper proposes an empirical evaluation of the neutrality (or absence thereof) of the allocation mechanism for abatement decisions within cap-and-trade schemes. Our analysis is based on data on emissions of the European ETS. This scheme, the largest in the world in terms of amount of emissions and number of involved establishments, is particularly suitable to test the neutrality of allocation mechanisms as it experienced a change in the allocation mechanism in recent years. The move from grandfathering to partial (i.e. with exemption) auctioning allows to estimate whether the way permits are allocated has an influence on abatement decisions, against the prediction of the Coase theorem.
After providing a comprehensive descriptive evidence on recent trends in verified emissions and allocation of permits, we evaluate whether the change in regulation, with an exemption from auctioning granted to leakage-exposed sectors, influenced abatement behaviours of firms. Focusing on manufacturing establishment, our preferred estimate suggests an increase in emission of about 20.5 log points for plants that are exempted from auctioning with respect to the ones that should buy permits through auctions. This contradicts the theoretical prediction about the neutrality of allocation mechanisms in cap-and-trade schemes, thus leading to sub-optimal outcomes. These findings should inform policy makers about possible ways of improving ETS-like schemes in order to improve their economic efficiency and correct for potential distortions induced by specific rules for specific case such as the case of carbon leakage.
Even though these findings already represent a useful contribution for the policy debate, further research is needed to understand which are the more important mechanisms that induce changes in abatement choices as a consequence of changes in allocation mechanism. This additional research should consider both theoretical reasoning about the non-neutrality and empirical validation of these theoretical hypothesis.
References
Abrell, J., Ndoye, A., and Zachmann, G. (2011). Assessing the impact of the EU ETS using firm level data. Bruegel Working Paper 2011/08, Brussels, Belgium.
Anger, N., and Oberndorfer, U. (2008). Firm performance and employment in the EU Emissions Trading Scheme: An empirical assessment for Germany. Energy Policy, 36(1): 12–22.
42
Borghesi, S., Montini, M., and Barreca, A. (2016). The European Emission Trading System and Its Followers. Comparative Analysis and Linking Perspectives. SpringerBriefs in
Environmental Science, Springer.
Borghesi, S., Franco, C., and Marin, G. (2018). Outward Foreign Direct Investments Patterns of Italian Firms in the EU ETS. Scandinavian Journal of Economics, forthcoming
Bushnell, J. B., Chong, H., and Mansur, E. T. (2011). Profiting from Regulation: An Event Study of the European Carbon Market. Dartmouth College Working Paper, Hanover, NH.
Calel, R., and Dechezlepretre, A. (2016). Environmental policy and directed technological change: Evidence from European carbon market. Review of Economics and Statistics, 98(1): 173–191.
Chan, H. S., Li, S., and Zhang, F. (2013). Firm competitiveness and the European Union Emissions Trading Scheme. Energy Policy, 63: 1056-1064
Commins, N., Lyons, S., Schiffbauer, M., and Tol, N. C. (2011). Climate Policy and Corporate Behavior. The Energy Journal, 32(4)
Coase, R.H. (1960). The problem of social cost. Journal of Social Economics, 3: 1-44 Demailly, D., and Quirion, P. (2006). CO2 abatement, competitiveness and leakage in the
European cement industry under the EU ETS: grandfathering versus output-based allocation. Climate Policy, 1: 93–113.
Demailly, D., and Quirion, P. (2008). European Emission Trading Scheme and competitiveness: A case study on the iron and steel industry. Energy Economics, 30(4): 2009–2027.
Fowlie, M., and Perhoff, J. M. (2013). Distributing pollution rights in cap-and-trade programs: are outcomes independent of allocations? Review of Economics and Statistics, 95: 1640-1652.
Frankel, J. A., and Rose A. K. (2005). Is Trade Good or Bad for the Environment? Sorting Out the Causality. Review of Economics and Statistics, 87(1): 85-91.
Greenstone, M. (2002). The Impact of Environmental Regulations on Industrial Activity: Evidence from the 1970 and 1977 Clean Air Act Amendments and the Census of Manufactures. Journal of Political Economy, 110(6): 1175-1219.
Hahn, R. W. (1984), Market Power and Transferable Property Rights. Quarterly Journal of
Economics, 99: 753-765.
Hahn, R. W., and Stavins R. N. (2011). The Effect of Allowance Allocations on Cap-and-Trade System Performance. Journal of Law and Economics, 54: 267-294.
Kahneman, D., Knetsch J. L., and Thaler R. H. (1990). Experimental Tests of the Endowment Effect and the Coase Theorem. Journal of Political Economy, 98(6): 1325-1348.
Kahneman, D., Knetsch, J. L., and Thaler, R. H. (1991). Anomalies: The Endowment Effect, Loss Aversion, and Status Quo Bias. Journal of Economic Perspectives, 5: 193-206 Levinson, A. (1996). Environmental Regulations and Manufacturers’ Location Choices:
Evidence from the Census of Manufactures. Journal of Public Economics, 62: 5-29. Marin, G., Marino, M., and Pellegrin, C. (2017) The impact of the European Emission
Trading Scheme on multiple measures of economic performance. Environmental and
Resource Economics, online first.
Martin, R., Muuls, M., de Preux, L. B., and Wagner, U. J. (2014). Industry compensation under relocation risk: A firm-level analysis of the EU Emissions Trading Scheme.
43
Martin, R., Muuls, M., and Wagner, U. J. (2015). The Impact of the European Union Emissions Trading Scheme on Regulated Firms: What Is the Evidence after Ten Years?
Review of Environmental Economics and Policy, 10 (1): 129-148.
McKinsey, and Ecofys (2006a). EU ETS REVIEW Report on International Competitiveness. European Commission Directorate General for Environment, Brussels. McKinsey, and Ecofys (2006b). Review of Emissions Trading Scheme: Survey highlights.
European Commission Directorate General for Environment, Brussels.
Montgomery, W. D. (1972). Markets in Licenses and Efficient Pollution Control Programs.
Journal of Economic Theory, 5: 395-418.
Murphy, J. J., and Stranlund J. K. (2007). A Laboratory Investigation of Compliance Behavior under Tradable Emissions Rights: Implications for Targeted Enforcement.
Journal of Environmental Economics and Management, 53: 196-212.
Palmer, K., Oates W. E., and Portney P. R. (1995). Tightening Environmental Standards: The Benefit-Cost or the No-Cost Paradigm? Journal of Economic Perspectives, 9(4): 119-132.
Petrick, S., and Wagner U. J. (2014). The Impact of Carbon Trading on Industry: Evidence from German Manufacturing Firms. Kiel Working Paper, 1912.
Porter, M. E., and van der Linde C. (1995). Toward a New Conception of the Environment-Competitiveness Relationship. Journal of Economic Perspectives, 9(4): 119-132. Reguant, M., and Ellerman, D. (2008). Grandfathering and the Endowment Effect: An
Assessment in the Context of the Spanish National Allocation Plan. MIT CEEPR Working Paper, 08-018.
Reinaud, J. (2005). Industrial competitiveness Trading Scheme. IEA Information Paper, International Energy Agency, Paris, France.
Smale, R., Hartley, M., Hepburn, C. J.,Ward, J., and Grubb, M. (2006). The impact of CO2 emissions trading on firm profits and market prices. Climate Policy, 6(1): 31–48. Stavins, R. N. (1995). Transaction Costs and Tradeable Permits. Journal of Environmental
Economics and Management, 29: 133-148.
Wagner, U. J., Muuls M., Martin R., and Colmer, J. (2013). The causal effect of the European Union Emission Trading Scheme: Evidence from French manufacturing plants. mimeo.
Zaklan, A. (2016). Free allocation and the endowment effect in cap-and-trade systems: evidence from the European electricity sector. EAERE Conference 2016, Zurich.
44
Appendix - 4-digit sectors’ classification criteria
The criteria according to which a sector is believed to be exposed to high carbon leakage risk are the following:
A. Criterion explained at article 10 bis, paragraph 15, directive 2003/87/EC; at least middle trade and emissions
B. Criterion explained at article 10 bis, paragraph 16, a) letter, directive 2003/87/EC; high emissions
C. Criterion explained at article 10 bis, paragraph 16, b) letter, directive 2003/87/EC; high trade
Paragraph 15 A sector or a sub-sector is believed to be exposed to high carbon
emissions relocation risk if:
a) the sum of extra costs (either direct or indirect) caused by the compliance to this directive could lead to a considerable increase in production costs, computed as a percentage of the gross value added, of at least 5%; and b) the intensity of exchange with third countries, intended as the ratio
between the sum of the exportation value towards third countries and the importation value from those countries and the overall market volume for European Community (annual business volume plus total importations from those countries) is greater than 10%.
Paragraph 16 Furthermore, a sector or a sub-sector is believed to be exposed
to high carbon emissions relocation risk if:
a) the sum of extra costs (either direct or indirect) caused by the compliance to this directive could lead to a very considerable increase in production costs, computed as a percentage of the gross value added, of at least 30%; or
b) the intensity of exchange with third countries, intended as the ratio between the sum of the exportation value towards third countries and the importation value from those countries and the overall market volume for European Community (annual business volume plus total importations from those countries) is greater than 30%.
Paragraph 17 The list at paragraph 13 can be integrated after a qualitative
valuation has been completed, taking into account, should be available applicable data, the following criteria:
a) the measure in which each plant of the interested sector or subsector is able to reduce emission level or electric energy consumption, taking into account, in case, the possible increase of production costs deriving from corresponding investment, for example, applying most efficient techniques;
b) the present and foreseen market characteristics, even when commercial exposition or costs growth rate (either direct or indirect) are close to the maximum, explained at paragraph 16
c) profit margins, as potential indicators for investment decisions, either long-term or transfer.